

Ventilatory Burden as a Measure of Obstructive Sleep Apnea Severity Is Predictive of Cardiovascular and All-Cause Mortality
- PMID: 37698405
- PMCID: PMC10868353
- DOI: 10.1164/rccm.202301-0109OC
Ventilatory Burden as a Measure of Obstructive Sleep Apnea Severity Is Predictive of Cardiovascular and All-Cause Mortality
Abstract
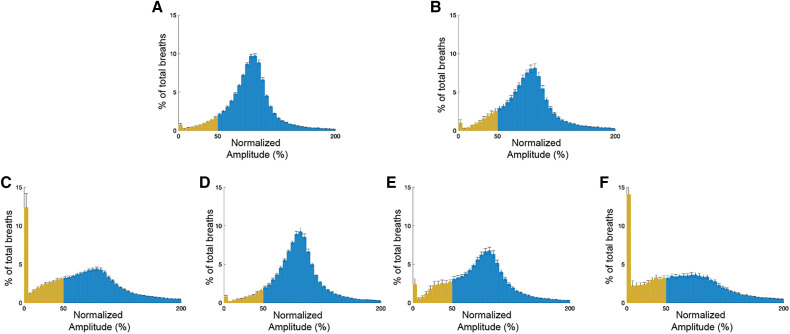
Rationale: The apnea-hypopnea index (AHI), used for the diagnosis of obstructive sleep apnea, captures only the frequency of respiratory events and has demonstrable limitations. Objectives: We propose a novel automated measure, termed "ventilatory burden" (VB), that represents the proportion of overnight breaths with less than 50% normalized amplitude, and we show its ability to overcome limitations of AHI. Methods: Data from two epidemiological cohorts (EPISONO [Sao Paolo Epidemiological Study] and SHHS [Sleep Heart Health Study]) and two retrospective clinical cohorts (DAYFUN; New York University Center for Brain Health) were used in this study to 1) derive the normative range of VB, 2) assess the relationship between degree of upper airway obstruction and VB, and 3) assess the relationship between VB and all-cause and cardiovascular disease (CVD) mortality with and without hypoxic burden that was derived using an in-house automated algorithm. Measurements and Main Results: The 95th percentiles of VB in asymptomatic healthy subjects across the EPISONO and the DAYFUN cohorts were 25.2% and 26.7%, respectively (median [interquartile range], VBEPISONO, 5.5 [3.5-9.7]%; VBDAYFUN, 9.8 [6.4-15.6]%). VB was associated with the degree of upper airway obstruction in a dose-response manner (VBuntreated, 31.6 [27.1]%; VBtreated, 7.2 [4.7]%; VBsuboptimally treated, 17.6 [18.7]%; VBoff-treatment, 41.6 [18.1]%) and exhibited low night-to-night variability (intraclass correlation coefficient [2,1], 0.89). VB was predictive of all-cause and CVD mortality in the SHHS cohort before and after adjusting for covariates including hypoxic burden. Although AHI was predictive of all-cause mortality, it was not associated with CVD mortality in the SHHS cohort. Conclusions: Automated VB can effectively assess obstructive sleep apnea severity, is predictive of all-cause and CVD mortality, and may be a viable alternative to the AHI.
Keywords: hypertension; mortality; sleep apnea; sleepiness; ventilation.
Figures


Comment in
-
Ventilatory Burden: Development of a New Approach to Better Quantify Obstructive Sleep Apnea Severity and Its Impacts.Am J Respir Crit Care Med. 2023 Dec 1;208(11):1153-1155. doi: 10.1164/rccm.202310-1718ED. Am J Respir Crit Care Med. 2023. PMID: 37878826 Free PMC article. No abstract available.
-
Ventilatory Burden in Obstructive Sleep Apnea: A Novel Indicator for Assessing Severity?Am J Respir Crit Care Med. 2024 Apr 15;209(8):1035-1036. doi: 10.1164/rccm.202309-1681LE. Am J Respir Crit Care Med. 2024. PMID: 38271708 Free PMC article. No abstract available.
References
-
- Cherniack NS. The sleep apnea number game: counting the apnea-hypopnea index. Respiration . 2009;77:21–22. - PubMed
-
- Muraja-Murro A, Nurkkala J, Tiihonen P, Hukkanen T, Tuomilehto H, Kokkarinen J, et al. Total duration of apnea and hypopnea events and average desaturation show significant variation in patients with a similar apnea-hypopnea index. J Med Eng Technol . 2012;36:393–398. - PubMed
Publication types
MeSH terms
Grants and funding
LinkOut - more resources
Full Text Sources
Medical
