Review
. 2024 Jan;20(1):652-694.
doi: 10.1002/alz.13449. Epub 2023 Sep 12.

The Alzheimer's Disease Neuroimaging Initiative in the era of Alzheimer's disease treatment: A review of ADNI studies from 2021 to 2022

Affiliations
Review

The Alzheimer's Disease Neuroimaging Initiative in the era of Alzheimer's disease treatment: A review of ADNI studies from 2021 to 2022

Dallas P Veitch et al. Alzheimers Dement. 2024 Jan.

Abstract

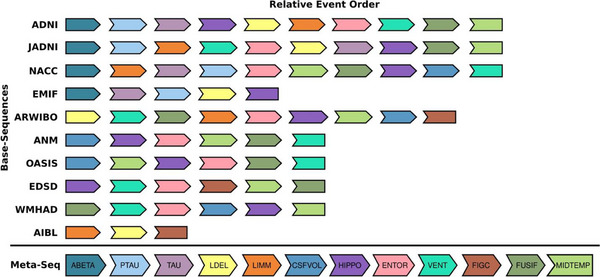
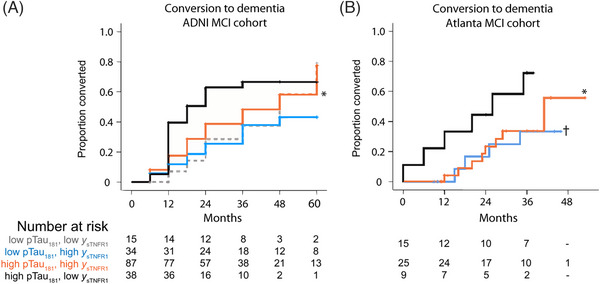
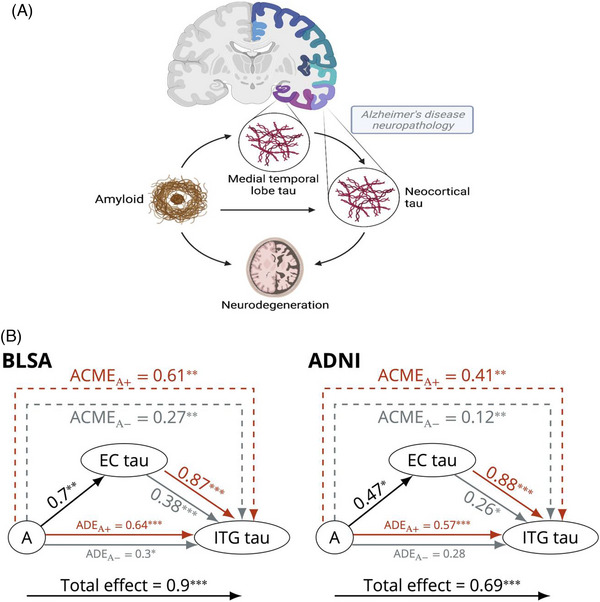
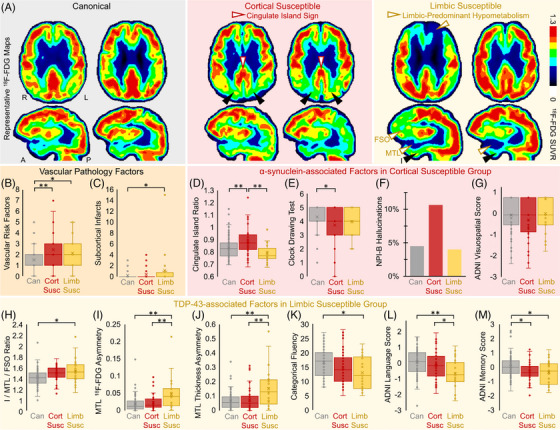
The Alzheimer's Disease Neuroimaging Initiative (ADNI) aims to improve Alzheimer's disease (AD) clinical trials. Since 2006, ADNI has shared clinical, neuroimaging, and cognitive data, and biofluid samples. We used conventional search methods to identify 1459 publications from 2021 to 2022 using ADNI data/samples and reviewed 291 impactful studies. This review details how ADNI studies improved disease progression understanding and clinical trial efficiency. Advances in subject selection, detection of treatment effects, harmonization, and modeling improved clinical trials and plasma biomarkers like phosphorylated tau showed promise for clinical use. Biomarkers of amyloid beta, tau, neurodegeneration, inflammation, and others were prognostic with individualized prediction algorithms available online. Studies supported the amyloid cascade, emphasized the importance of neuroinflammation, and detailed widespread heterogeneity in disease, linked to genetic and vascular risk, co-pathologies, sex, and resilience. Biological subtypes were consistently observed. Generalizability of ADNI results is limited by lack of cohort diversity, an issue ADNI-4 aims to address by enrolling a diverse cohort.

Keywords: Alzheimer's Disease Neuroimaging Initiative; Alzheimer's disease clinical trials; Alzheimer's disease subtypes; amyloid; cerebrovascular disease; co-pathologies; diagnosis; disease progression; generalizability; neurodegeneration; neuroinflammation; plasma biomarkers; prediction; resilience; tau.


Conflict of interest statement

Dr. Ashford, Dr. Beckett, Dr. Jack, Dr. Miller, Dr. Morris, Dr. Nho, Dr. Okonkwo, Dr. Perrin, Dr. Toga, Dr. Tosun, and Dr. Veitch have no conflicts to declare. Dr. Aisen has research grants from NIH, Lilly, and Eisai, and consults with Merck, Roche, Genentech, Abbvie, Biogen, ImmunoBrain Checkpoint, and Arrowhead. Dr. Green has received compensation for advising the following companies: Allelica, Atria, Fabric, Genome Web, Genomic Life, Grail, Verily, and VinBigData and is co‐founder of Genome Medical and Nurture Genomics. Dr. Harvey serves as a Statistical Advisor for PLOS ONE. Dr. Jagust serves as a consultant to Eisai, Roche, Biogen, Prothena, and Lilly. Dr. Landau has received travel funding from the Alzheimer's Association, served on the Scientific Advisory Board and DSMB for KeifeRx, and has received speaker fees from Eisai, Inc. Dr. Nosheny receives support in the form of grants to UCSF from NIH, The Alzheimer's Association, and Genentech, Inc. Dr. Petersen has consulted for Roche, Inc., Merck, Inc., Biogen, Inc., Eisai, Inc., Nestle, Inc., and Genentech, Inc. Dr. Rivera Mindt serves on the following boards: ALL‐FTD External Advisory Board, Brown University Carney Center, Harlem Community and Academic Partnership, Mayo Clinic Alzheimer's Disease Research Center Advisory Board, National Centralized Repository for AD RD (NCRAD) Committee, Natives Engaged in Alzheimer's Research (NEAR) Study Data Safety Monitoring Board, South Texas Alzheimer's Disease Research Center (ADRC) External Advisory Board, University of California, San Francisco Alzheimer's Disease Research Center Advisory Board, University of Texas Rio Grande Valley Resource Center For Minority Aging Research Advisory Board, and University of Washington ADRC External Advisory Board. Dr. Saykin has received support from Avid Radiopharmaceuticals, a subsidiary of Eli Lilly (in kind contribution of PET tracer precursor) and consulting fees from Bayer Oncology (Scientific Advisory Board), Eisai (Scientific Advisory Board), Siemens Medical Solutions USA, Inc. (Dementia Advisory Board), Springer‐Nature Publishing (Editorial Office Support as Editor‐in‐Chief, Brain Imaging and Behavior). Dr. Shaw receives support Roche (IIS and in‐kind reagents and instrumentation support for CSF AD biomarkers); he has received honoraria from Roche, Biogen, and Fujirebio for participation in teaching programs; and served on Advisory Boards for Roche and Biogen. Dr. Weiner serves on Editorial Boards for Alzheimer's & Dementia, MRI and TMRI. He has served on Advisory Boards for Acumen Pharmaceutical, ADNI, Alzheon, Inc., Biogen, Brain Health Registry, Cerecin, Dolby Family Ventures, Eli Lilly, Merck Sharp & Dohme Corp., National Institute on Aging (NIA), Nestle/Nestec, PCORI/PPRN, Roche, University of Southern California (USC), NervGen. He has provided consulting to Baird Equity Capital, BioClinica, Cerecin, Inc., Cytox, Dolby Family Ventures, Duke University, Eisai, FUJIFILM‐Toyama Chemical (Japan), Garfield Weston, Genentech, Guidepoint Global, Indiana University, Japanese Organization for Medical Device Development, Inc. (JOMDD), Medscape, Nestle/Nestec, NIH, Peerview Internal Medicine, Roche, T3D Therapeutics, University of Southern California (USC), and Vida Ventures. He has acted as a speaker/lecturer to The Buck Institute for Research on Aging, China Association for Alzheimer's Disease (CAAD), Japan Society for Dementia Research, and Korean Dementia Society. He holds stock options with Alzheon, Inc., Alzeca, and Anven. The following entities have provided funding for academic travel: University of Southern California (USC), NervGen, ASFNR, and CTAD Congress. Author disclosures are available in the supporting information.

Figures

FIGURE 1
FIGURE 1
Rates of change of three cognitive outcomes in a simulated clinical trial in ADNI using inclusion criteria from anti‐amyloid trials. Left column: individual trajectories on the (A) CDR‐SB, (C) ADAS‐Cog, and (E) MMSE. The vertical dotted lines represent scores at 18 months. Right: simulated group differences in change from baseline to month 18 based on the total sample (n = 302) on (B) CDR‐SB, (D) ADAS‐Cog, and (F) MMSE, including 95% range of effect sizes as indicated by vertical gray lines and effect sizes reported for recent clinical trials as indicated by vertical dashed colored lines (blue = EMERGE; yellow = ENGAGE; green = EXPEDITION‐3; orange = DAYBREAK‐ALZ; red = IDENTITY‐2; magenta = BAPINEZUMAP). ADAS‐Cog, Alzheimer's Disease Assessment Scale‐Cognitive subscale; ADNI, Alzheimer's Disease Neuroimaging Initiative; CDR‐SB, Clinical Dementia Rating Sum of Boxes; MMSE, Mini‐Mental State Examination. Reproduced under open access from Jutten et al.
FIGURE 2
FIGURE 2
ROC curves for distinguishing pathology‐confirmed AD dementia from non‐AD dementia and Aβ‐PET–negative healthy controls. ROC curves showing the performance of (A) Elecsys CSF biomarkers and (B) plasma biomarkers compared to CSF tau phosphorylated at threonine 181 (p‐tau181) for the discrimination of pathology‐confirmed AD dementia from (A.a and B.a) Aβ‐PET–negative healthy controls and (A.b and B.b) non‐AD dementia. AUC and 95% confidence interval are reported in the inset of each panel. Aβ, amyloid beta; AD, Alzheimer disease; AUC, areas under the curve; CN, cognitively normal; CSF, cerebrospinal fluid; NfL, neurofilament light; PET, positron emission tomography; ROC, receiver operating characteristic; T‐tau, total tau. Reproduced under open access from Grothe et al.
FIGURE 3
FIGURE 3
Prediction of cognitive decline using biomarkers individually or in combination. Effect sizes for each biomarker in predicting future cognitive decline either alone (orange bars, on top) or in a combined model (black bars, below). Significant biomarkers are represented with a star. The models using CSF biomarkers are shown on the left panel and the models using plasma markers on the right panel. Bars represent 95% confidence intervals. APOE, apolipoprotein E; CSF, cerebrospinal fluid; MRI, magnetic resonance imaging; NfL, neurofilament light; PET, positron emission tomography; p‐tau, phosphorylated tau. Reproduced under open access from Smith et al.
FIGURE 4
FIGURE 4
Tau prognostic index to predict future tau accumulation. (A), Cortical maps show average rate of tau accumulation for individuals classified as Clinically Stable (CS) versus Clinically Declining (CD). (B), Relationship of the scalar projection with future rate of tau accumulation within the fusiform gyrus (circled in cortical maps are shown in [A]). The solid black vertical line indicates the probabilistic boundary used to perform the binary stratification, blue crosses indicate rate of tau accumulation for the clinically stable group, black circles indicate future rate of tau accumulation for the clinically declining group. Restratification to a more stringent threshold, indicated by the dashed black vertical line, using the prognostic index allows a new sample to be selected with higher future rates of tau accumulation and lower heterogeneity within the sample. SUVR, standardized uptake value ratio. Reproduced under open access from Giorgio et al.
FIGURE 5
FIGURE 5
Consensus ordering of AD biomarkers from 10 cohorts. All base sequences from the 10 investigated cohorts and the resulting meta‐sequence. Due to only partially overlapping lists, the determining factor for an event's position in the meta‐sequence was not its absolute position in each base sequence (i.e., rank 1, 2, …, 11), but its relative position to other biomarkers in the same sequence. ABETA, amyloid beta; AD, Alzheimer's disease; AIBL, Australian Imaging, Biomarker, & Lifestyle Flagship Study of Ageing; ANM, AddNeuroMed; ARWIBO, Alzheimer's Disease Repository without Borders; JADNI, Japanese ADNI; EDSD, European DTI Study on Dementia; EMIF, European Medical Information Framework; CSFVOL, accumulated CSF volume in the brain; ENTOR, entorhinal volume; FICG, Figure Copy; FUSIF, fusiform volume; HIPPO, hippocampal volume; LDEL, Logical Memory–Delayed Recall; LIMM, Logical Memory‐Immediate Recall; MIDTEMP, middle temporal lobe volume; NACC, National Alzheimer's Coordinating Center; OASIS, Open Access Series of Imaging Studies; PTAU, phosphorylated tau; VENT, ventricular volume; WMHAD, White Matter Hyperintensities in Alzheimer's Disease. Reproduced under open access from Golriz Khatami et al. [Correction added on September 21, 2023, after first online publication: First author name has been corrected for reference 150.]
FIGURE 6
FIGURE 6
Conversion to dementia diagnosis by levels of CSF p‐tau181 and sTNFR1. (A) ADNI. (B) Atlanta replication cohort. *Lower conversion compared to those with p‐tau181 ≥ 24.1 pg/mL but low yf sTNFR1 (P = 0.049 in ADNI and P = 0.038 in the Atlanta cohort). Two subgroups with p‐tau181 < 24.1 were combined due to small numbers, P = 0.068 versus high p‐tau181 and low y sTNFR1. ADNI, Alzheimer's Disease Neuroimaging Initiative; CSF, cerebrospinal fluid; MCI, mild cognitive impairment; p‐tau, phosphorylated tau; sTNFR1, soluble tumor necrosis factor 1. Reproduced under open access from Hu et al.
FIGURE 7
FIGURE 7
Tau neocortical progression is influenced by synergistic interaction of medial temporal lobe amyloid and tau. (A), Schematic of relationship among amyloid, medial temporal lobe tau, neocortical tau, and neurodegeneration. (B), Causal mediation analysis results for the model investigating the relationships among amyloid groups (+/–) and tau in the EC and the ITG in the BLSA and ADNI. The effect of amyloid on ITG tau is mediated by EC tau. Arrow from A to EC tau indicates the linear regression coefficient, and the gray and red arrows from EC tau to ITG tau indicate the linear regression coefficients for the amyloid negative and positive groups, respectively. Both the mediator and the outcome models were adjusted for age, sex, APOE ε4 positivity, years of education, and 10‐year cardiovascular disease risk. ***P < 0.001, **P < 0.01, *P < 0.05. A, amyloid; ACME, average causal mediation effect; ADNI, Alzheimer's Disease Neuroimaging Initiative; APOE, apolipoprotein E; BLSA, Baltimore Longitudinal Study of Aging; EC, entorhinal cortex; ITG, inferior temporal gyrus. Reproduced from Bilgel et al.
FIGURE 8
FIGURE 8
The dissociation of tau pathology and neuronal hypometabolism is related to co‐pathologies. (A), Representative 18F‐FDG SUVR images from six patients. Susceptible patients shown here have imaging findings consistent with co‐pathology (sagittal views are slices through the right hemisphere). The cortical susceptible group (middle) had participants with cingulate island sign, the sparing of posterior cingulate cortex (white arrowheads) relative to cuneus (black arrowheads). The limbic susceptible group (right) had participants with MTL and FSO 18F‐FDG hypometabolism (white arrowheads) relative to inferior temporal gyrus (I, black arrowheads). Vascular pathology features in susceptible groups included greater (B) vascular risk factors and (C) subcortical infarcts. The cortical susceptible group (D) had higher cingulate island ratio across groups, (E) had significantly worse clock drawing scores, and trended toward (F) greater proportion of participants with hallucinations on the Neuropsychiatric Inventory (NPI) item B and (G) worse ADNI visuospatial scores than the other groups. The limbic susceptible group had larger (H) I/MTL/FSO 18F‐FDG ratio and worse MTL asymmetry in (I) 18F‐FDG SUVR and (J) thickness, and significantly worse (K) categorical fluency, (I) language, and (M) memory z scores. Box plots show data points as dots, mean as an X symbol, median as the middle box line, first quartile (Q1) and third quartiles (Q3) as box edges (denoting the IQR), whiskers as the minimum/maximum points and outliers based on thresholds <Q1 − 1.5(IQR) or >Q3 + 1.5(IQR). Cognitive test comparisons included Aβ status, education, sex, and age as covariates. Significant differences in pairwise comparisons by two‐tailed likelihood ratio tests are denoted by *P < 0.05, **P < 0.005. Aβ, amyloid beta; ADNI, Alzheimer's Disease Neuroimaging Initiative; FDG, 18F‐fluorodeoxyglucose; FSO, frontal supraorbital; IQR, interquartile range; MTL, medial temporal lobe; SUVR, standardized uptake value ratio. Reproduced under open access from Duong et al.

References

    1. Mueller SG, Weiner MW, Thal LJ, et al. Ways toward an early diagnosis in Alzheimer's disease: the Alzheimer's disease neuroimaging initiative (ADNI). Alzheimers Dement. 2005;1:55‐66. - PMC - PubMed
    1. Marek K, Jennings D, Lasch S, et al. The Parkinson progression marker initiative (PPMI). Prog Neurobiol. 2011;95:629‐635. - PMC - PubMed
    1. Franzmeier N, Brendel M, Beyer L, et al. Tau deposition patterns are associated with functional connectivity in primary tauopathies. Nat Commun. 2022;13:18. - PMC - PubMed
    1. Cadby G, Giles C, Melton PE, et al. Comprehensive genetic analysis of the human lipidome identifies loci associated with lipid homeostasis with links to coronary artery disease. Nat Commun. 2022;13:17. - PMC - PubMed
    1. Weiner MW, Harvey D, Landau SM, et al. Traumatic brain injury and post‐traumatic stress disorder are not associated with Alzheimer's disease pathology measured with biomarkers. Alzheimers Dement. 2023;19:884‐895. - PMC - PubMed

Publication types