. 2023 Sep 12:12:RP87515.
doi: 10.7554/eLife.87515.

Molecular consequences of peripheral Influenza A infection on cell populations in the murine hypothalamus

Affiliations

Molecular consequences of peripheral Influenza A infection on cell populations in the murine hypothalamus

René Lemcke et al. Elife. .

Abstract

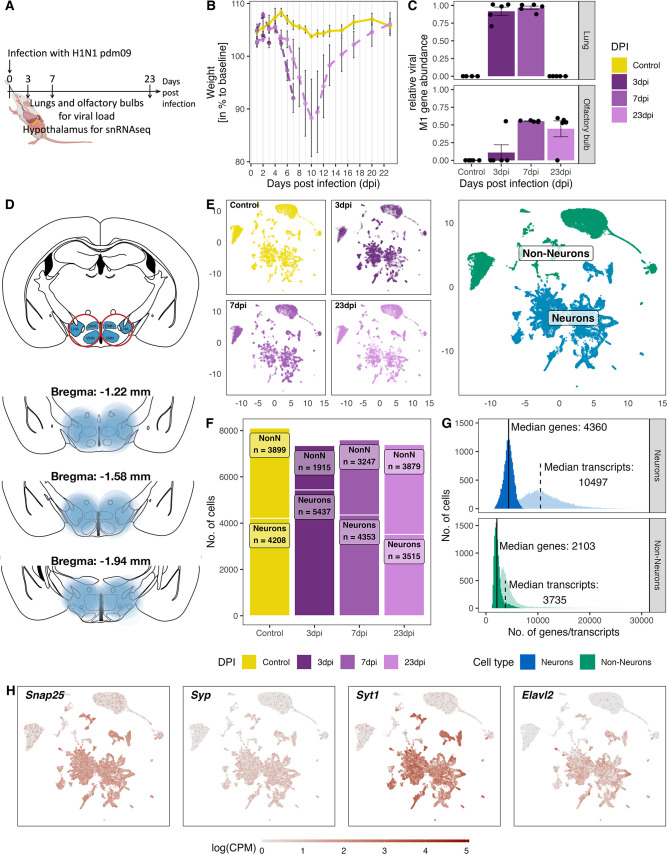
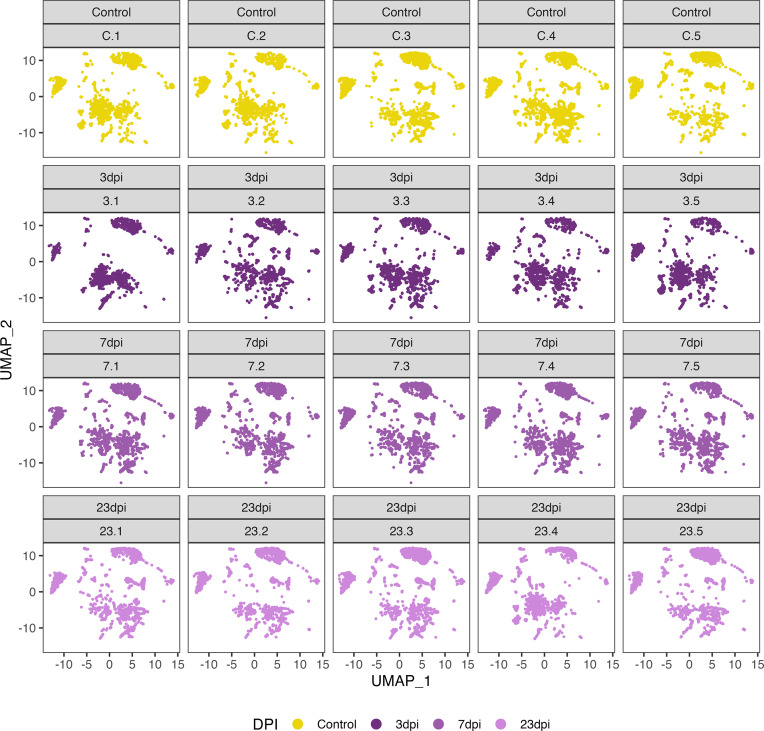
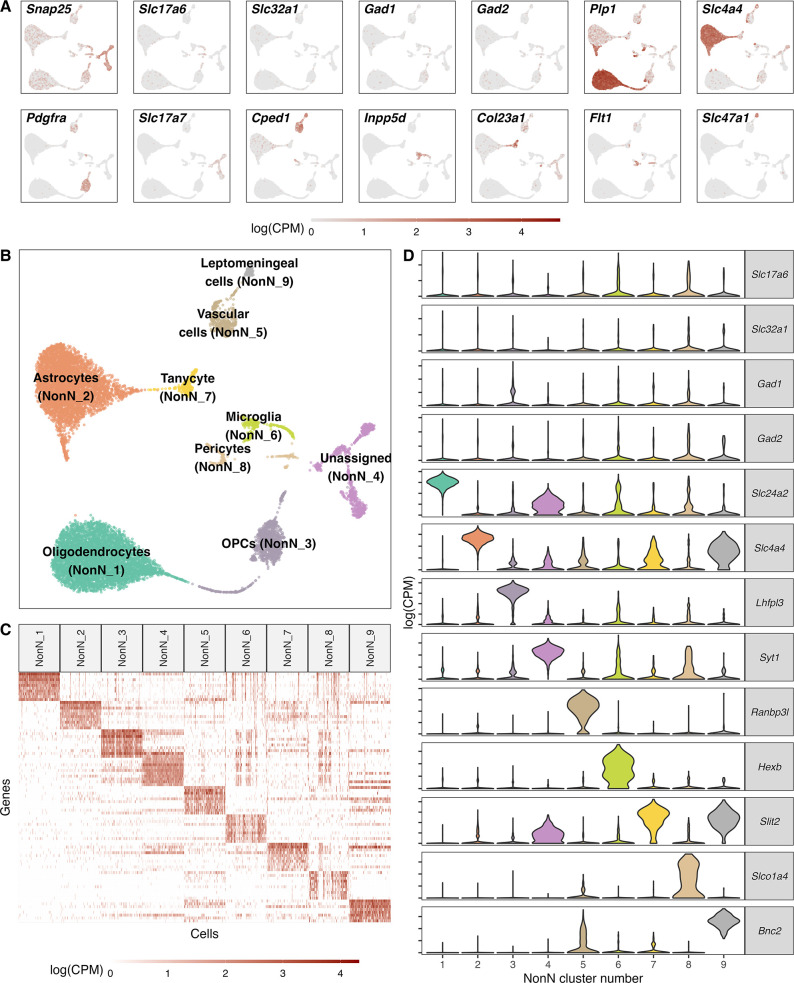
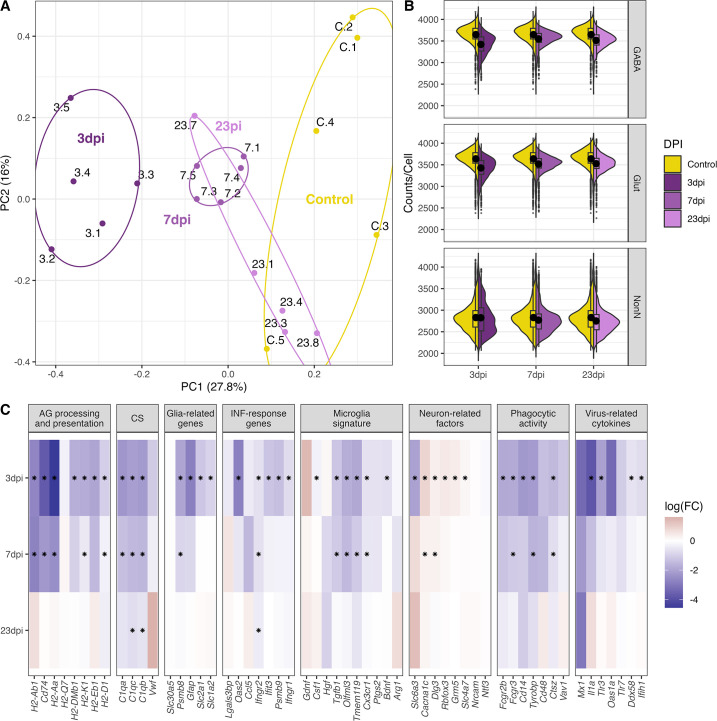
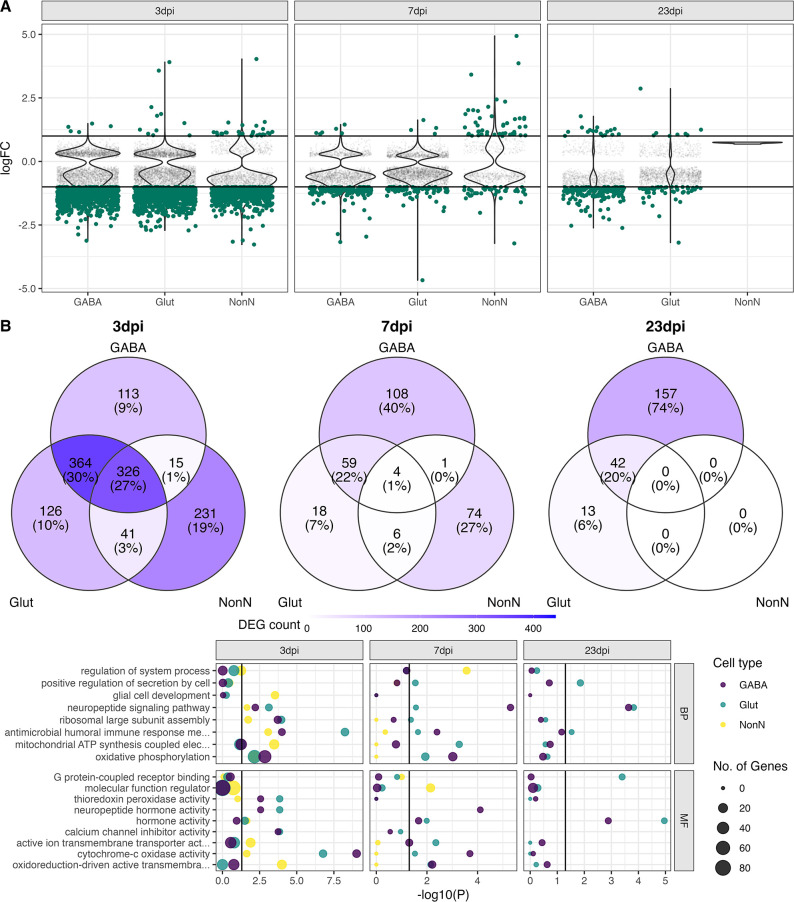
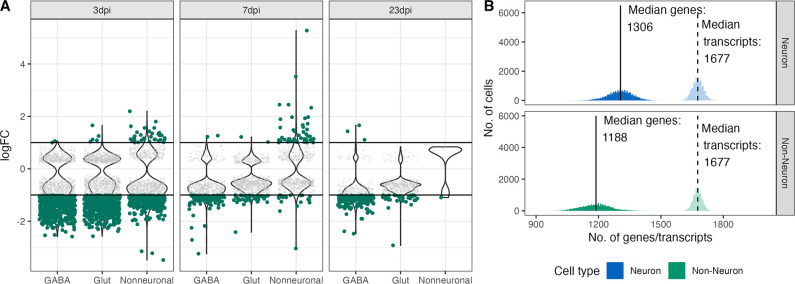
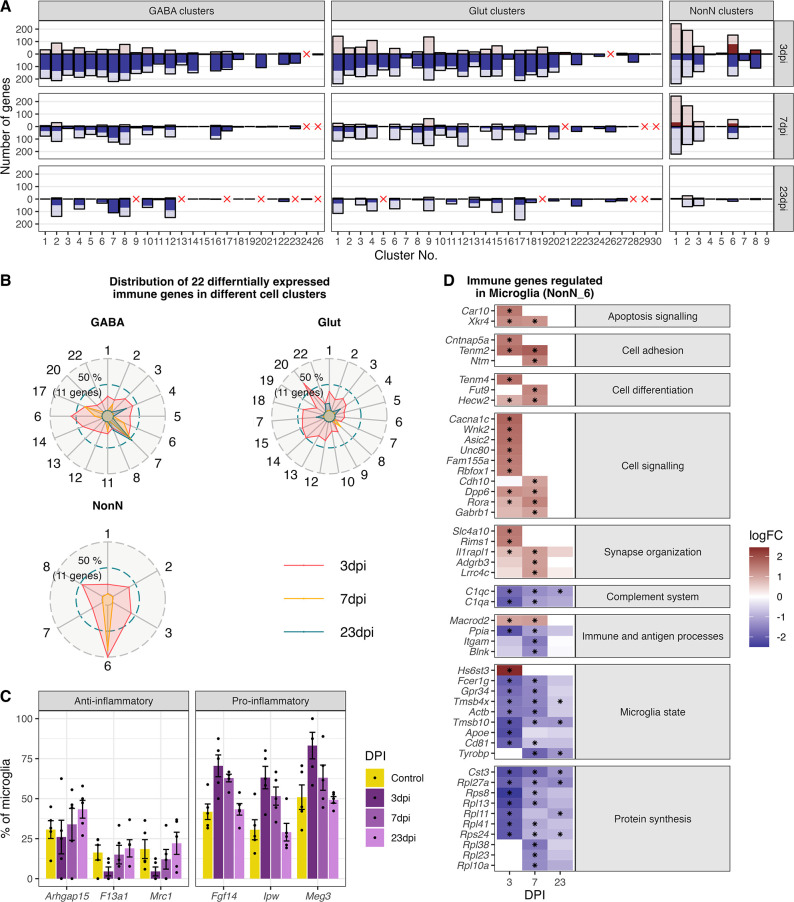
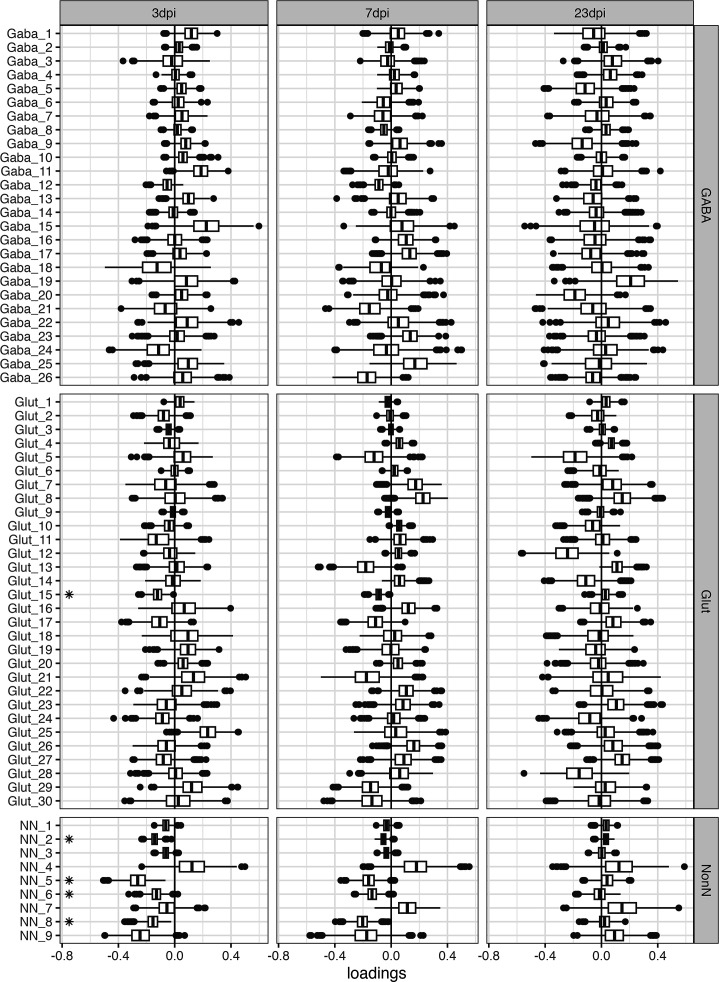
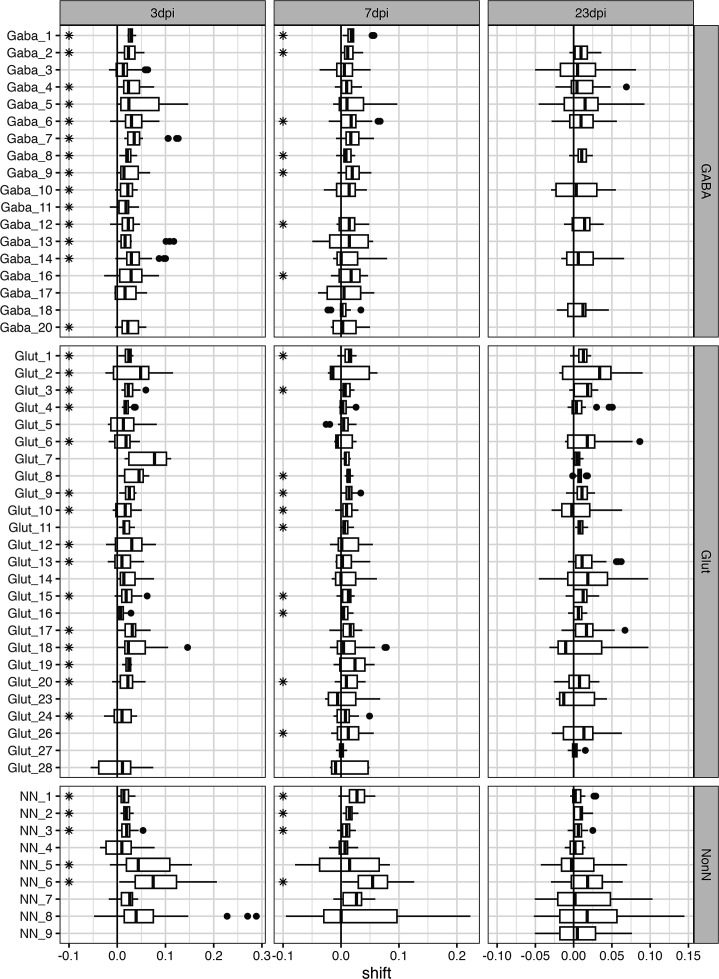
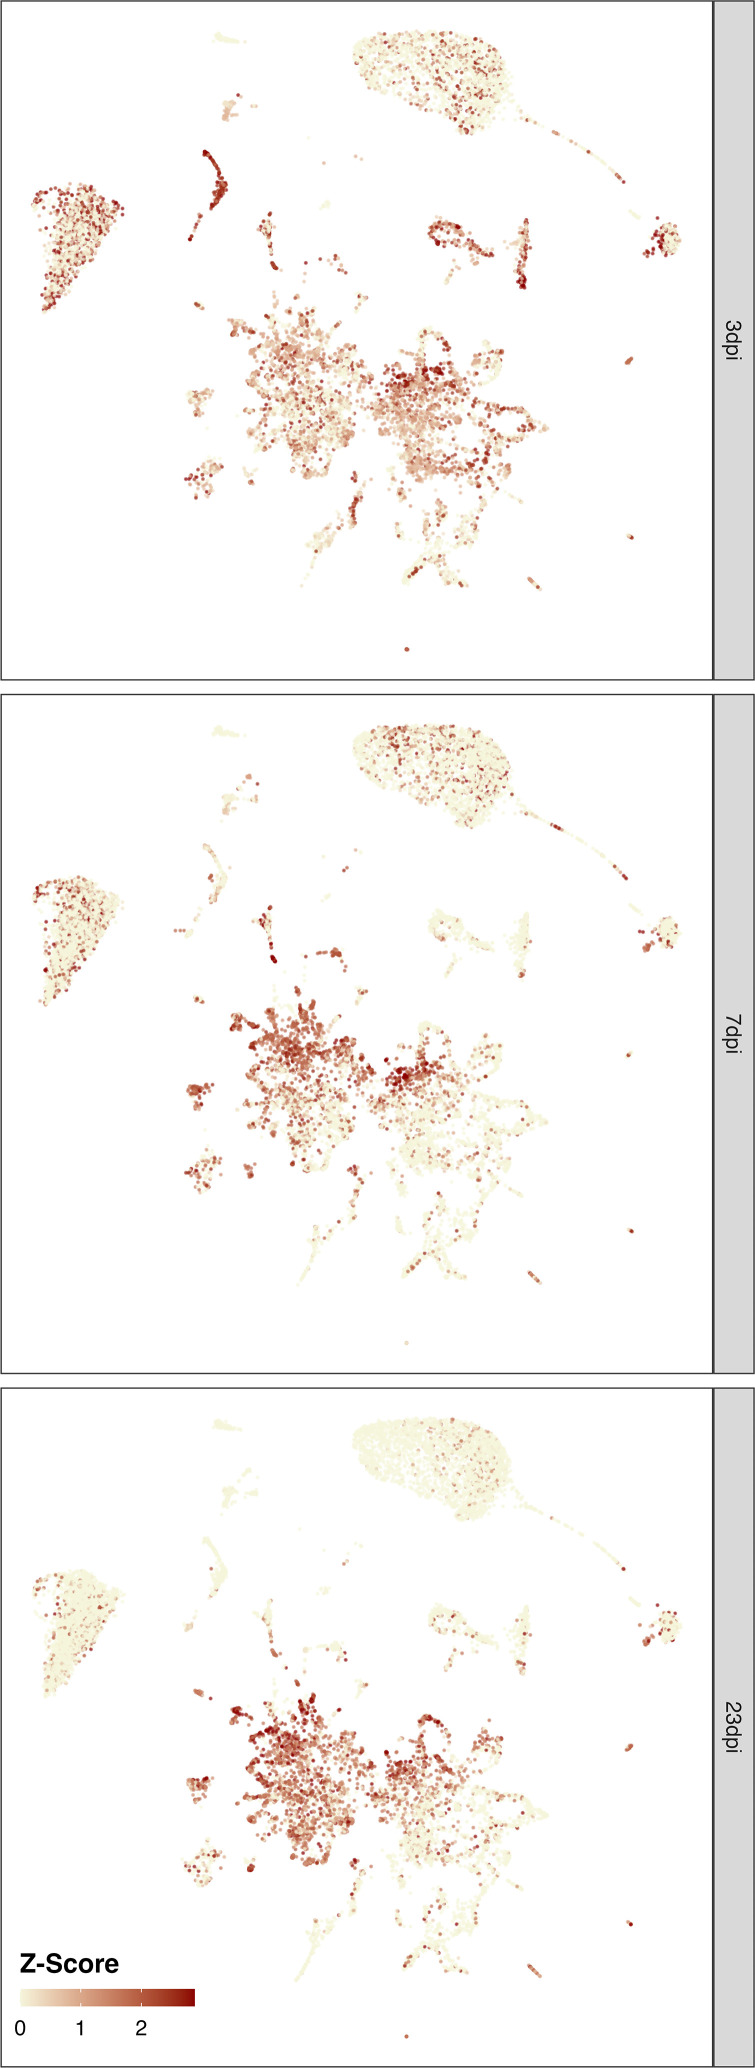
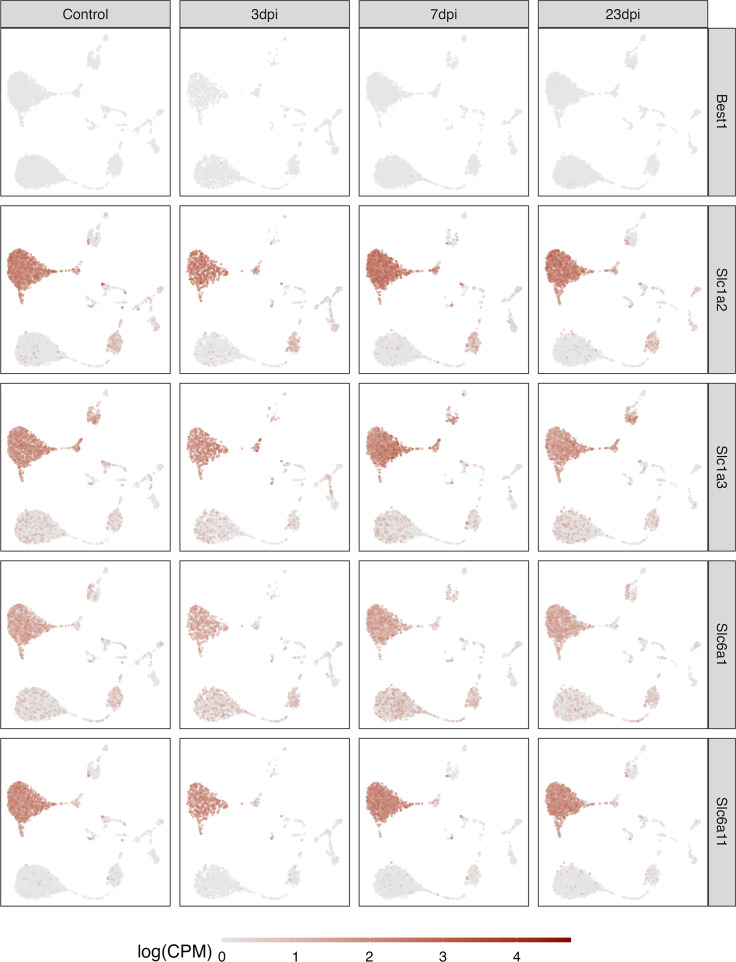
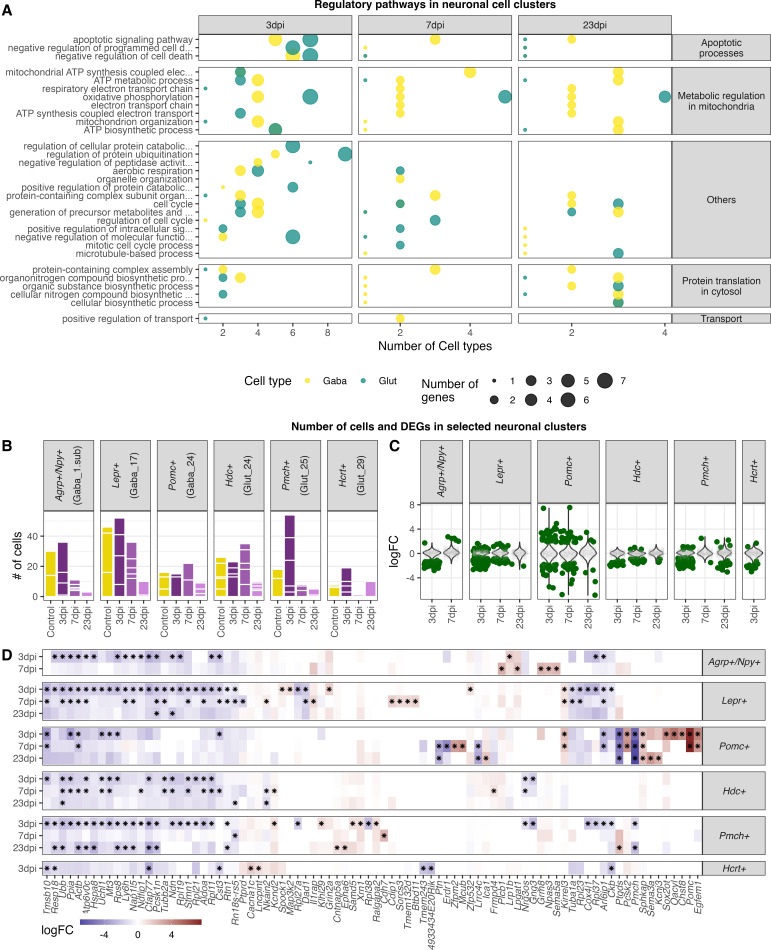
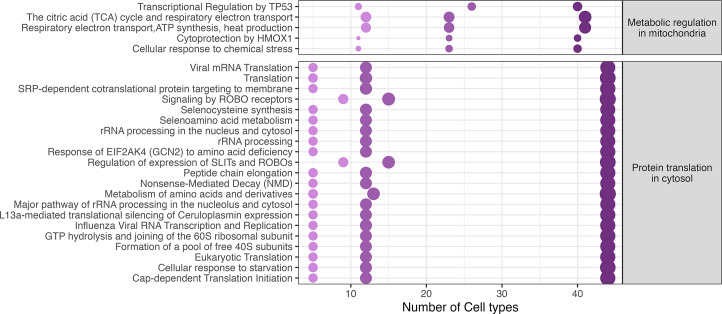
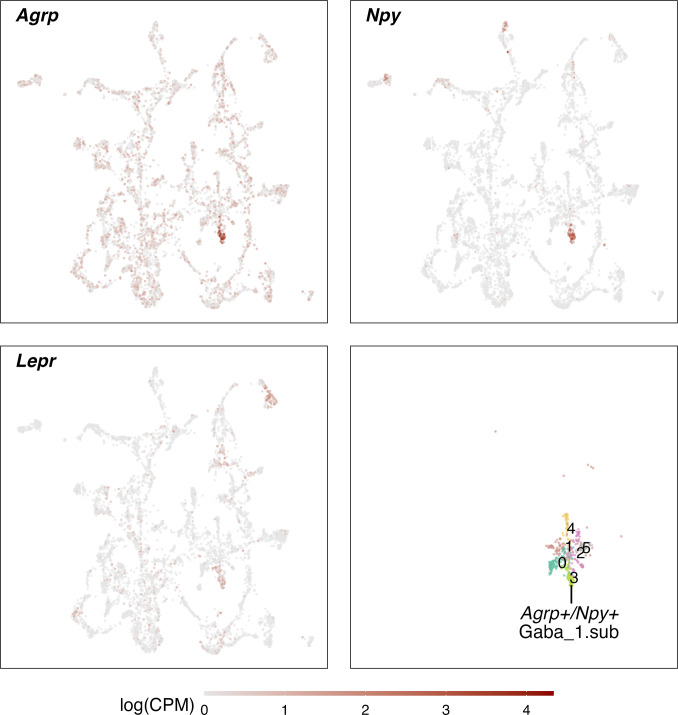
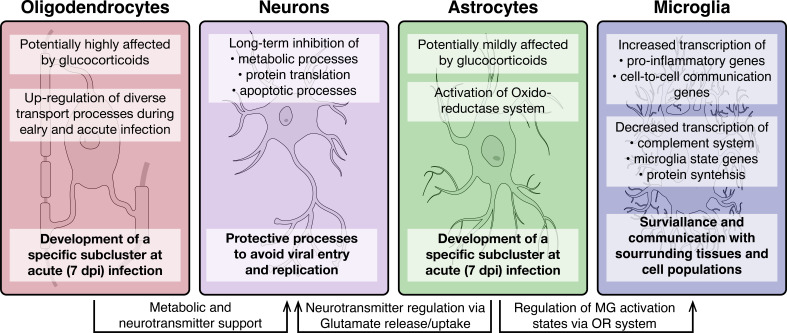
Infection with Influenza A virus (IAV) causes the well-known symptoms of the flu, including fever, loss of appetite, and excessive sleepiness. These responses, mediated by the brain, will normally disappear once the virus is cleared from the system, but a severe respiratory virus infection may cause long-lasting neurological disturbances. These include encephalitis lethargica and narcolepsy. The mechanisms behind such long lasting changes are unknown. The hypothalamus is a central regulator of the homeostatic response during a viral challenge. To gain insight into the neuronal and non-neuronal molecular changes during an IAV infection, we intranasally infected mice with an H1N1 virus and extracted the brain at different time points. Using single-nucleus RNA sequencing (snRNA-seq) of the hypothalamus, we identify transcriptional effects in all identified cell populations. The snRNA-seq data showed the most pronounced transcriptional response at 3 days past infection, with a strong downregulation of genes across all cell types. General immune processes were mainly impacted in microglia, the brain resident immune cells, where we found increased numbers of cells expressing pro-inflammatory gene networks. In addition, we found that most neuronal cell populations downregulated genes contributing to the energy homeostasis in mitochondria and protein translation in the cytosol, indicating potential reduced cellular and neuronal activity. This might be a preventive mechanism in neuronal cells to avoid intracellular viral replication and attack by phagocytosing cells. The change of microglia gene activity suggest that this is complemented by a shift in microglia activity to provide increased surveillance of their surroundings.

Keywords: hypothalamus; immunology; inflammation; influenza a virus; mouse; neurons; neuroscience; non-neuronal cells; olfactory bulb; snRNA sequencing; viruses.

Plain language summary

When you are ill, your behaviour changes. You sleep more, eat less and are less likely to go out and be active. This behavioural change is called the ‘sickness response’ and is believed to help the immune system fight infection. An area of the brain called the hypothalamus helps to regulate sleep and appetite. Previous research has shown that when humans are ill, the immune system sends signals to the hypothalamus, likely initiating the sickness response. However, it was not clear which brain cells in the hypothalamus are involved in the response and how long after infection the brain returns to its normal state. To better understand the sickness response, Lemcke et al. infected mice with influenza then extracted and analysed brain tissue at different timepoints. The experiments showed that the major changes to gene expression in the hypothalamus early during an influenza infection are not happening in neurons – the cells in the brain that transmit electrical signals and usually control behaviour. Instead, it is cells called glia – which provide support and immune protection to the neurons – that change during infection. The findings suggest that these cells prepare to protect the neurons from influenza should the virus enter the brain. Lemcke et al. also found that the brain takes a long time to go back to normal after an influenza infection. In infected mice, molecular changes in brain cells could be detected even after the influenza infection had been cleared from the respiratory system. In the future, these findings may help to explain why some people take longer than others to fully recover from viral infections such as influenza and aid development of medications that speed up recovery.


Conflict of interest statement

RL, CE, NB, KE, AT, TP, JC, BK No competing interests declared

Figures

Figure 1.
Figure 1.. Overview of the experiment, development of the infection, and the resulting snRNA-seq dataset.
(A) Schematic representation of the experiment. (B) Loss of body weight of mice during disease progression until full recovery (n=5 per group). (C) Viral M1 gene abundance in lung and olfactory bulb tissue at the three time points during disease progression and in controls. (D) Location of microdissection punches of the hypothalamus mapped to the mouse brain atlas at distances from bregma of −1.22, –1.58 and −1.94. (E) UMAP dimensional reduction of 30.452 cells, color-coded based on their sample group (different time points and control) membership (left) or their neuronal and non-neuronal identity (right). (F) Bar graph showing the cell counts of neuronal and non-neuronal cells in the different sampling groups. (G) Histograms depicting the distribution of transcript (lighter shading) and genes (solid shading) in all non-neuronal and neuronal cells. (H) Normalized expression of neuronal marker genes (Snap25, Syp, Syt1, Elval2) in all cells shown on a UMAP plot.
Figure 1—figure supplement 1.
Figure 1—figure supplement 1.. Quality control plots for the generated snRNA-seq dataset.
(A) Percentages of mitochondrial RNA in the different samples. Light gray dots were categorised as outliers and removed form the downstream analysis. (B) Cell counts per time point after different filter steps.
Figure 1—figure supplement 2.
Figure 1—figure supplement 2.. Weight curves depicting the weight-loss due to H1N1 pdm09 infection in the different individuals.
Weight curves are group by time point samples. Grey coloured animals were not used for snRNA-sequencing.
Figure 1—figure supplement 3.
Figure 1—figure supplement 3.. Punching location.
Location of 4 mm punches for RNA extraction and snRNA-seq in the hypothalamus in the different sampling groups.
Figure 1—figure supplement 4.
Figure 1—figure supplement 4.. UMAP embeddings per hash-tagged sample.
UMAP embeddings show the distribution of cells across the different cell types of the individual hash-tagged samples. Colours depict and shadings depict the time points.
Figure 2.
Figure 2.. Classification of non-neuronal cell types.
(A) Normalized expression values of different neuronal and non-neuronal cell type markers (pan-neuronal marker - Snap25; Glutamatergic marker - Slc17a6; GABAergic markers - Slc32a1, Gad1, Gad2; Oligodendrocyte marker – Plp1; Astrocyte markers – Slc4a4; Oligodendrocyte precursor marker – Pdgfra; Cped1 – Vascular and leptomeningeal cell markers – Cped1, Slc47a1, Microglia marker – Inpp5d, Tanycytic marker – Col23a1, Pericyte marker – Flt1) in all non-neuronal cells (n=12.940) mapped on a UMAP. (B) Unsupervised clustering of non-neuronal cell types shown in a UMAP embedding and color-coded and annotated by potential cell type annotations. (C) Heatmap of normalized expression values showing discriminatory cell type markers of 9 non-neuronal cell populations. (D) Violin plots showing distribution of normalized expression values of neurotransmitters and best discriminatory cell type markers.
Figure 2—figure supplement 1.
Figure 2—figure supplement 1.. Label transfer of cell-type labels from the HypoMap (Steuernagel et al., 2022) annotations (C7) to the Non-neuronal cell cluster here identified.
(A/B) Shows the cell label transfer for HypoMap cell-type level C7. (C) Depicts prediction scores. (D) Original cell-clusters and labels identified in the here presented study. (F) Detailed overview of predicted names for the different identified cell clusters.
Figure 2—figure supplement 2.
Figure 2—figure supplement 2.. Cell-type label transfer for non-neuronal cells.
Depicting the prediction scores and potential cell-type labels in non-neuronal cells from different published datasets (Campbell et al., 2017; Chen et al., 2017; Hochgerner et al., 2018; Mickelsen et al., 2019; Mickelsen et al., 2020; Moffitt et al., 2018; Zeisel et al., 2018).
Figure 3.
Figure 3.. Classification of GABAergic and glutamatergic neuronal cell types in the hypothalamus.
(A) Normalized expression values of different neurotransmitters (Glutamatergic marker - Slc17a6; GABAergic markers - Slc32a1, Gad1, Gad2) in all neuronal cells (left) and a color-coded UMAP projection based on their GABAergic or glutamatergic identity (right) (n=17.512). (B) Un-supervised clustering of GABAergic (upper, n=6.032) and glutamatergic (lower, n=11.481) cells in UMAP plots. Cell type clusters are color-coded and annotated with labels. (C) Violin plots showing normalized expression values of neurotransmitters and discriminating marker genes of selected GABAergic (left) and glutamatergic (right) cell type clusters. (D) Glutamatergic UMAP plots showing normalized expression values of distinct markers for hypothalamic neuron populations (HCRT neurons – upper left, PMCH neurons – lower left, GnRH neurons – upper right, Histaminergic neurons – lower right).
Figure 3—figure supplement 1.
Figure 3—figure supplement 1.. Label transfer of cell-type labels from the HypoMap (Steuernagel et al., 2022) annotations (C285) to glutamatergic cell cluster here identified.
(A/B) Shows the cell label transfer for HypoMap cell-type level C285 (_named).( C) Depicts prediction scores.( D) Original cell-clusters and labels identified in the here presented study.( F) Detailed overview of predicted names for the different identified cell clusters.
Figure 3—figure supplement 2.
Figure 3—figure supplement 2.. Label transfer of cell-type labels from the HypoMap (Steuernagel et al., 2022) annotations (C285) to GABAergic cell cluster here identified.
(A/B) Shows the cell label transfer for HypoMap cell-type level C285 (_named).( C) Depicts prediction scores.( D) Original cell-clusters and labels identified in the here presented study.( F) Detailed overview of predicted names for the different identified cell clusters.
Figure 3—figure supplement 3.
Figure 3—figure supplement 3.. Cell-type label transfer for glutamatergic cells.
Depicting the prediction scores and potential cell-type labels in glutamatergic cells from different published datasets (Campbell et al., 2017; Chen et al., 2017; Mickelsen et al., 2019; Mickelsen et al., 2020; Moffitt et al., 2018; Zeisel et al., 2018).
Figure 3—figure supplement 4.
Figure 3—figure supplement 4.. Cell-type label transfer for GABAergic cells.
Depicting the prediction scores and potential cell-type labels in GABAergic cells from different published datasets (Campbell et al., 2017; Chen et al., 2017; Mickelsen et al., 2019; Mickelsen et al., 2020; Moffitt et al., 2018; Zeisel et al., 2018).
Figure 4.
Figure 4.. General changes in the transcriptomic landscape of the hypothalamus during peripheral IAV infections.
(A) Principial component plot of combined counts per sample. Each sample snRNA-library were down-sampled to a total of 300 cells (100 non-neuronal, 100 GABAergic, 100 glutamatergic cells) before normalized counts were aggregated before principal component analysis. Samples are color-coded according to their group membership and the numbers correspond to the individual animal IDs. (B) Violin plot showing the distribution of counts per cell at the different time points. The three points of infections are compared to the control group. (C) Heatmap showing log-transformed log-fold changes of known immune-related genes. Black stars indicate significant expression (FDR ≤ 0.05).
Figure 5.
Figure 5.. Transcriptional changes in GABAergic and glutamatergic neurons of the hypothalamus during peripheral IAV infections.
(A.) Violin plots showing the log-transformed fold changes (logFC) per gene calculated for the GABAergic, glutamatergic, and non-neuronal cells at 3, 7, and 23 dpi. Dark-green dots represent significantly differential expressed genes (FDR ≤ 0.05) with a logFC greater than 1 or lower than –1. Small grey dots show significantly expressed genes with a logFC between –1 and 1. (B) Venn diagrams depicting the overlap of highly differential expressed genes (logFC >1 or logFC < –1) between the three main cell type clusters at each time point. (C) Gene ontology analysis showing the most significant ontology terms for the category of Biological Process (BP, top) and Molecular Function (MF, bottom). The two highest significant ontology’s for each time point and each cell type were chosen if it included more than 4 annotated genes. The size of the dots indicates the number of genes included in the ontology term and the colour show the cell type annotation.
Figure 5—figure supplement 1.
Figure 5—figure supplement 1.. DEG analysis in down-sampled dataset.
lepsy onset is seasonal and incr(A) Scatter- and Violin-plot showing the results of a differential gene expression analysis comparing infected groups against control groups on all Glutamatergic, GABAergic and Non-neuronal cells on a down sampled data set. (B) Histogram showing the distribution of features (genes) and transcripts per cell in a down0sampled dataset (down-sampled to 1600 transcripts per cell).
Figure 6.
Figure 6.. Gene expression changes in different cell type clusters and microglia activation during peripheral IAV infections.
(A) Bar plot showing the number of significantly differentially expressed genes in each cell type cluster at 3, 7, and 23 dpi. Dark solid blue and red bars show the number of highly differential expressed gene (FDR ≤ 0.05, logFC <= –1 or logFC ≥ 1) per cell type cluster and time point. Lighter shaded bars depict the number of all significant regulated genes (FDR ≤ 0.05, logFC ≥ 0 or logFC ≤ 0). Differentially expressed genes (DEGs) were only included for clusters containing at least three cells per sample and per time point in the cluster. A red cross indicates instances where these criteria were not met. (B) Radar plot showing the number of significantly and strongly regulated genes (FDR ≤ 0.05, logFC ≥ 1 or logFC<= –1: n=22) involved in immune processes (based on their gene ontology annotations) per cell cluster at the different time points (red: 3 dpi, yellow: 7 dpi, blue: 23 dpi). (C) Percentage of the number of cells expressing distinct anti- or pro-inflammatory signature genes in the microglia cluster. Cells with a raw count of 0 for a gene were assumed as non-expressing, all other cells were assumed to express this gene. Shown are percentages of microglia cells expressing a gene compared to all microglia at each time point across all samples. (D) Relative changes in expression levels of disease associated genes within the microglia cluster. Data is show as log-transformed fold changes (logFC) of each time point compared with control group. Black stars depict significant differentially expressed genes (FDR ≤ 0.05).
Figure 6—figure supplement 1.
Figure 6—figure supplement 1.. Cluster-based composition shifts calculated by Cacoa.
Box-plots shwoing cluster-based expression shifts of the different infected groups in comparison to the control calculated with the Cacoa package (Petukhov et al., 2022). Shifts on the x-axis in the negative space show a increase of cell proportions in the control samples, whereas a shift towards the positive space indicate an increase in the different infected groups (3, 7, and 23 dpi). Stars depict significance change in cell densities (p ≤ 0.05 after BH correction).
Figure 6—figure supplement 2.
Figure 6—figure supplement 2.. Cluster-based analysis of changes in expression magnitudes.
Boxplots show the shifts in expression magnitudes based on Cacoa package (Petukhov et al., 2022) in the different infected samples compared to the control group. Stars depict a significant change in expression in a cluster (p ≤ 0.05, after BH correction).
Figure 6—figure supplement 3.
Figure 6—figure supplement 3.. Cluster-free expression shifts.
UMAP embedding showing of the whole dataset showing adjusted statistical significance levels (color) of expression shift magnitudes. Analysis was performed based on Cacoa package (Petukhov et al., 2022).
Figure 6—figure supplement 4.
Figure 6—figure supplement 4.. Identified gene programs at 3 dpi based on cluster-free genes expression analysis.
Adjusted z-scores are shown (color) for most pronounce genes programs identified comparing Control samples with infection at 3 dpi.
Figure 6—figure supplement 5.
Figure 6—figure supplement 5.. Identified gene programs at 3 dpi based on cluster-free genes expression analysis.
Adjusted z-scores are shown (color) for most pronounce genes programs identified comparing Control samples with infection at 7 dpi.
Figure 6—figure supplement 6.
Figure 6—figure supplement 6.. Identified gene programs at 3 dpi based on cluster-free genes expression analysis.
Adjusted z-scores are shown (color) for most pronounce genes programs identified comparing Control samples with infection at 23 dpi.
Figure 7.
Figure 7.. Identification of distinct oligodendrocyte and astrocyte sub-clusters at 7 dpi.
(A) Combined UMAP plot of all cells of the oligodendrocyte (upper right, n=5.023) and astrocyte (lower right, n=4.542) cluster in controls and at different time points. (B) Relative gene expression changes (in comparison of to the mock-infected group) of stress-related oligodendrocyte and astrocyte markers within the oligodendrocyte (NN_1) and astrocyte (NN_2) subcluster. Data is shown as log-transformed fold changes, an asterisks indicates statistical significance (FDR ≤ 0.05). (C) Normalized expression values of selected marker genes at 7-dpi in UMAP plots of all oligodendrocytes or astrocytes. (D) Number of differentially expressed genes (FDR ≤ 0.05, logFC <= –1 or logFC ≥ 1) annotated to gene ontologies associated with transport process in the oligodendrocytes at 3 and 7 dpi. (E) Expression dynamics of differential expressed oxidoreductase genes in the astrocyte cluster at 3, 7, and 23 dpi. A black star indicated significant differential expression (FDR ≤ 0.05).
Figure 7—figure supplement 1.
Figure 7—figure supplement 1.. Expression of different GABAergic and glutamatergic transporters.
Depicted are normalized expression levels in non-neuronal cells of different GABAergic and glutamatergic transporters.
Figure 8.
Figure 8.. Highly enriched gene ontology categories in neuronal cell populations at different time points of infections.
(A) Dot-plot depicting the number of neuronal cell populations significantly enriched gene ontology categories. Only cell clusters with at least 10 significantly differently expressed genes (logFC <= –1 or logFC ≥ 1, FDR≤ 1) in all three analysed time points were included in the here presented plot. Neuronal cell clusters included are (GABA_2, 4, 6, 8, 10,12; Glut_1, 3, 4, 6, 9, 11, 13, 15, 17). Only significantly enriched (Pelim ≤ 0.05) gene ontology terms were chosen and for each cluster per time point the 10 most enriched GO terms were included. (B) Bar plot depicting the amount of captured nuclei in the individual animals at the different time points for known hypothalamic neuron populations. (C) Differential expressed genes in selected neuron populations. Dark green dots show significantly differential expressed genes (FDR ≤ 0.05). (D) Heatmap showing the five highest and lowest DEGs (FDR ≤ 0.05) in each neuronal population.
Figure 8—figure supplement 1.
Figure 8—figure supplement 1.. Reactome pathway enrichment of differentially expressed genes in neurons.
Dotplot shows significantly enriched Reachtome pathways in neuronal cell popluations across different timepoints. Gradients of purple depict reflect the time points of analysis. 3 dpi (dark purple) to 23dpi (light purple).
Figure 8—figure supplement 2.
Figure 8—figure supplement 2.. Identification of an Agrp+/Npy +neuron cluster.
Agrp+/Npy +neurons were identified as a subcluster of the GABA_1 neuron population. Depicted are the normalized expression levels of marker genes Agrp, Npy and Lepr, showing their distinct expression in a cell cluster within the GABA_1 cluster. An additional cluster analysis of the GABA_1 cluster, identified them in the subcluster 3 (lower left).
Figure 9.
Figure 9.. Overview of molecular processes occurring in different cell types within the hypothalamus during a peripheral H1N1 IAV infection.
Schematic overview of the main molecular mechanisms of oligodendrocytes, astrocytes, microglia and neurons during acute to late immune responses of a peripheral IAV infection with the H1N1 pdm09 Influenza A virus.

Update of

  • doi: 10.1101/2023.03.06.530999
  • doi: 10.7554/eLife.87515.1
  • doi: 10.7554/eLife.87515.2

Similar articles

Cited by

References

    1. Ahmed SS, Schur PH, MacDonald NE, Steinman L. Narcolepsy, 2009 A(H1N1) pandemic influenza, and pandemic influenza vaccinations: what is known and unknown about the neurological disorder, the role for autoimmunity, and vaccine adjuvants. Journal of Autoimmunity. 2014;50:1–11. doi: 10.1016/j.jaut.2014.01.033. - DOI - PubMed
    1. Alexa A. Enrichment analysis for gene Ontology. R package version 2.48.0topGO 2022
    1. Avey D, Sankararaman S, Yim AKY, Barve R, Milbrandt J, Mitra RD. Single-Cell RNA-Seq Uncovers a Robust Transcriptional Response to Morphine by Glia. Cell Reports. 2018;24:3619–3629. doi: 10.1016/j.celrep.2018.08.080. - DOI - PMC - PubMed
    1. Balzani E, Lassi G, Maggi S, Sethi S, Parsons MJ, Simon M, Nolan PM, Tucci V. The Zfhx3-Mediated Axis Regulates Sleep and Interval Timing in Mice. Cell Reports. 2016;16:615–621. doi: 10.1016/j.celrep.2016.06.017. - DOI - PMC - PubMed
    1. Berthoud HR, Münzberg H. The lateral hypothalamus as integrator of metabolic and environmental needs: from electrical self-stimulation to opto-genetics. Physiology & Behavior. 2011;104:29–39. doi: 10.1016/j.physbeh.2011.04.051. - DOI - PMC - PubMed

Publication types

Associated data