

Clinical Correlates of Venetoclax-Based Combination Sensitivities to Augment Acute Myeloid Leukemia Therapy
- PMID: 37698624
- PMCID: PMC10618724
- DOI: 10.1158/2643-3230.BCD-23-0014
Clinical Correlates of Venetoclax-Based Combination Sensitivities to Augment Acute Myeloid Leukemia Therapy
Abstract
The BCL2 inhibitor venetoclax combined with the hypomethylating agent azacytidine shows significant clinical benefit in a subset of patients with acute myeloid leukemia (AML); however, resistance limits response and durability. We prospectively profiled the ex vivo activity of 25 venetoclax-inclusive combinations on primary AML patient samples to identify those with improved potency and synergy compared with venetoclax + azacytidine (Ven + azacytidine). Combination sensitivities correlated with tumor cell state to discern three patterns: primitive selectivity resembling Ven + azacytidine, monocytic selectivity, and broad efficacy independent of cell state. Incorporation of immunophenotype, mutation, and cytogenetic features further stratified combination sensitivity for distinct patient subtypes. We dissect the biology underlying the broad, cell state-independent efficacy for the combination of venetoclax plus the JAK1/2 inhibitor ruxolitinib. Together, these findings support opportunities for expanding the impact of venetoclax-based drug combinations in AML by leveraging clinical and molecular biomarkers associated with ex vivo responses.
Significance: By mapping drug sensitivity data to clinical features and tumor cell state, we identify novel venetoclax combinations targeting patient subtypes who lack sensitivity to Ven + azacytidine. This provides a framework for a taxonomy of AML informed by readily available sets of clinical and genetic features obtained as part of standard care. See related commentary by Becker, p. 437 . This article is featured in Selected Articles from This Issue, p. 419.
©2023 American Association for Cancer Research.
Figures
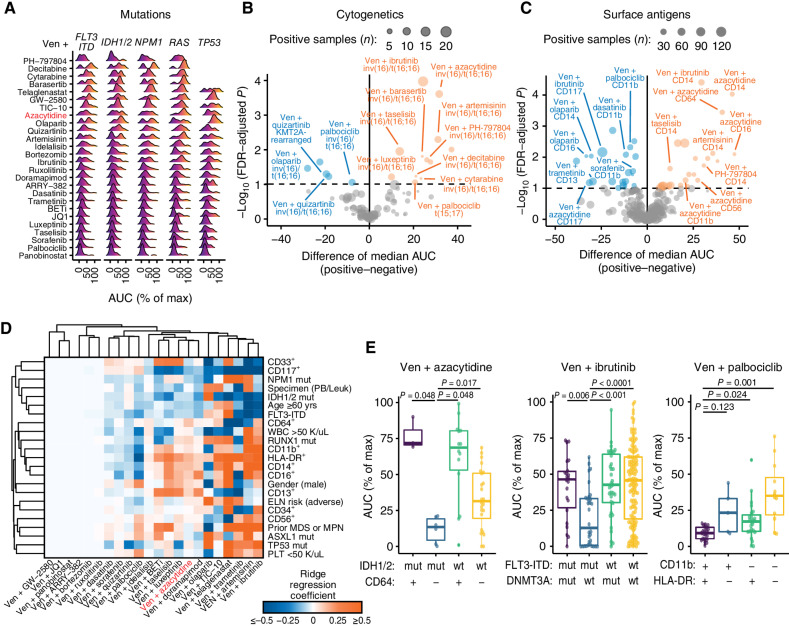
![Figure 2. Novel partners with venetoclax augment the sensitivity of Ven + azacytidine. A, Comparisons of overall ex vivo potency (as measured by median AUC) and enhanced efficacy [median AUC combination ratio (CR)] for venetoclax (Ven) combined with azacytidine and 30 novel drug partners among primary AML patient specimens. Numbers of evaluable samples and fractions exhibiting the highest single-agent (HSA) synergy for each combination are shown as point size and color, respectively. Note that absolute numbers of samples tested with a particular combination vary as they were added to drug panels over time. Ven + azacytidine is highlighted in red for reference comparison purposes. B, Heat map of matched ex vivo sensitivity data [AUC % of maximum (max)] for 95 AML patient samples tested with Ven + azacytidine, a subset of novel Ven combinations, and their respective single agents. C–E, Comparisons of Ven combination sensitivities with respect to AML type (C), ELN 2017 risk (D), and peripheral blood (PB) monocyte percentage from differential blood counts obtained at the time of sample collection (E). For categorical variables (de novo/secondary diagnosis and ELN 2017 risk) are compared by Mann–Whitney test; points indicate the difference of median AUC and bars indicate the 95% confidence interval around this estimate. Negative and positive differences in median values reflect greater sensitivity and resistance, respectively, in patient samples with secondary AML or adverse risk. Percent monocytes are correlated with combination AUC by Spearman rank test, where negative and positive Spearman r values denote correlation with sensitivity and resistance, respectively. Blue and orange coloring represent statistically significant associations with sensitivity and resistance, respectively; gray color indicates the comparison was not statistically significant. Secondary AML denotes instances in which a patient's AML transformed from one of multiple disease states.](https://cdn.ncbi.nlm.nih.gov/pmc/blobs/88fd/10618724/0ea50934f976/452fig2.jpg)
![Figure 3. Varying venetoclax partner drugs alters associations of sensitivity with AML tumor cell state. A, Concordance of drug-sensitivity cell state Pearson correlations for training and test sample cohorts. Colors indicate significant P values [after adjustment for family-wise error rate (FWER)] for both cohorts (purple), training set only (green), and test set only (orange). B, Clustered heat map of Pearson correlation r values for venetoclax (Ven) combination sensitivities (left) and respective single-agent sensitivities (not clustered, right) with respect to tumor cell state gene-expression signatures. Negative (blue) and positive (orange) correlation values correspond to sensitivity and resistance, respectively. C, Sensitivity of Ven + azacytidine and selected Ven combinations with respect to individual patient sample cell state. Dots represent individual patient specimens across the cell state spectrum defined by monocyte-like versus progenitor-like expression scores. Ex vivo drug sensitivity (AUC) is denoted in the color scale hue of each dot. Max, maximum.](https://cdn.ncbi.nlm.nih.gov/pmc/blobs/88fd/10618724/276d2b283597/452fig3.jpg)
Comment in
-
Potent Personalized Venetoclax Partners for Acute Myeloid Leukemia Identified by Ex Vivo Drug Screening.Blood Cancer Discov. 2023 Nov 1;4(6):437-439. doi: 10.1158/2643-3230.BCD-23-0180. Blood Cancer Discov. 2023. PMID: 37824763 Free PMC article.
References
-
- Siegel RL, Miller KD, Jemal A. Cancer statistics, 2020. CA Cancer J Clin 2020;70:7–30. - PubMed
-
- Fenaux P, Mufti GJ, Hellström-Lindberg E, Santini V, Gattermann N, Sanz G, et al. . Azacitidine prolongs overall survival and reduces infections and hospitalizations in patients with WHO-defined acute myeloid leukaemia compared with conventional care regimens: an update. Ecancermedicalscience 2008;2:121. - PMC - PubMed
Publication types
MeSH terms
Substances
Grants and funding
LinkOut - more resources
Full Text Sources
Medical
Molecular Biology Databases
Research Materials
Miscellaneous
