

On thresholds for controlling negative particle (PM2.5) readings in air quality reporting
- PMID: 37698727
- PMCID: PMC10497433
- DOI: 10.1007/s10661-023-11750-4
On thresholds for controlling negative particle (PM2.5) readings in air quality reporting
Abstract
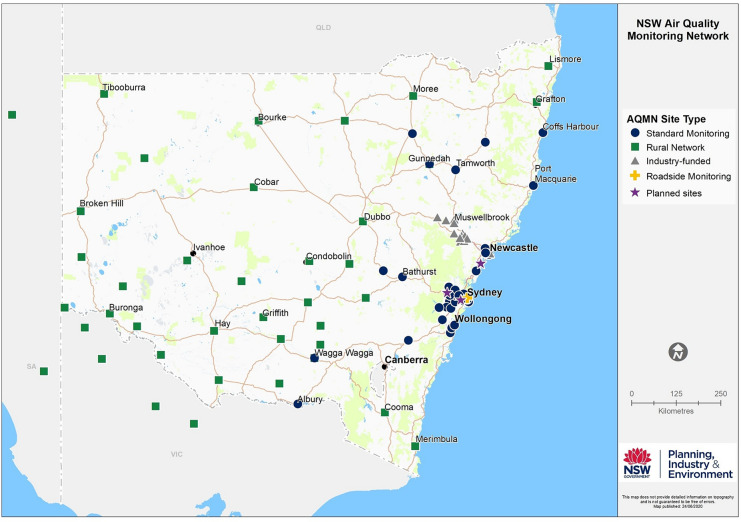
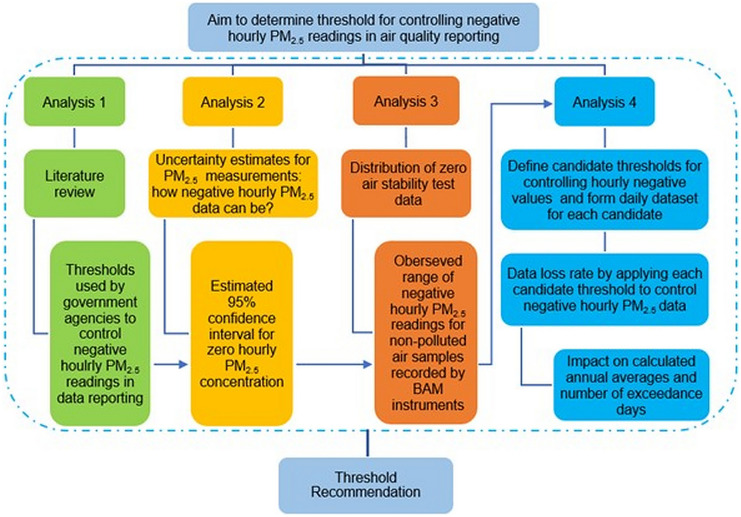
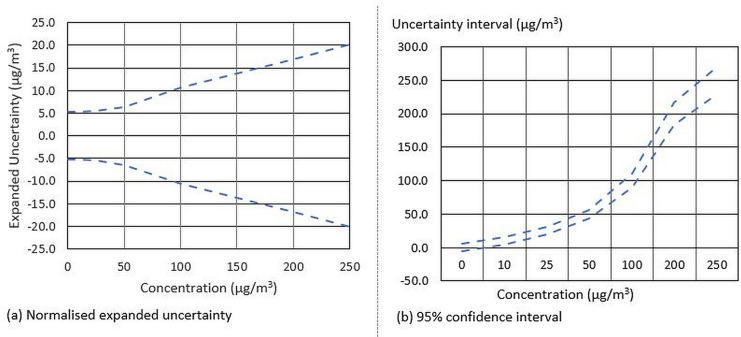
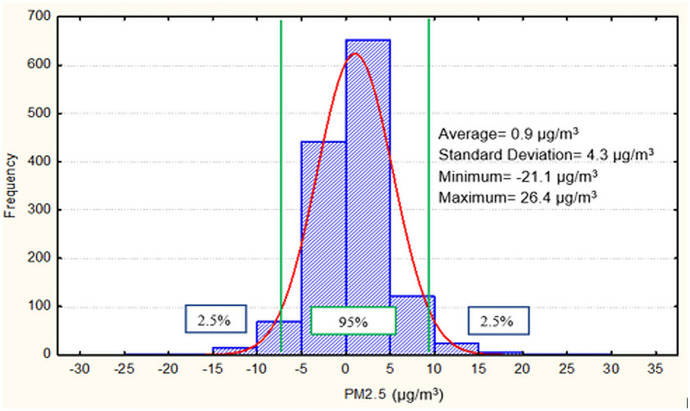
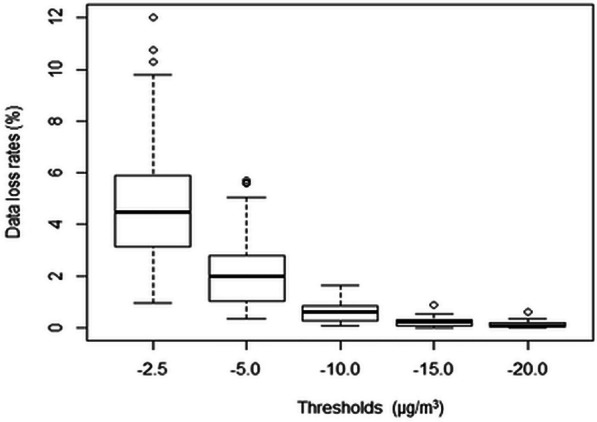
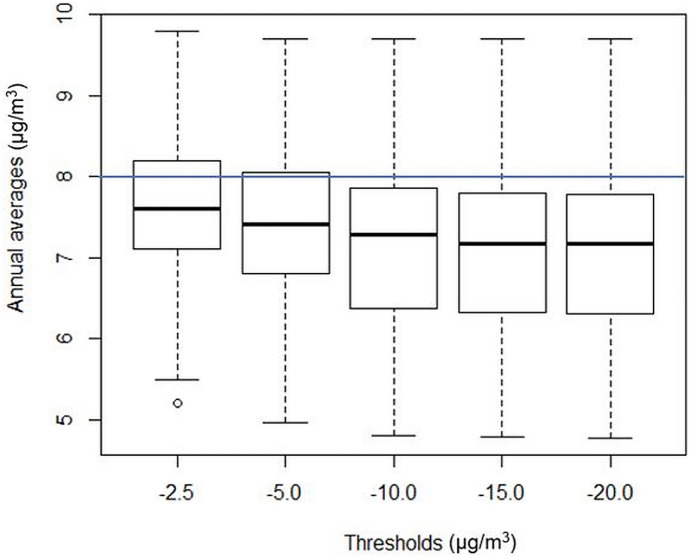
Ambient PM2.5 (particles less than 2.5 μm in diameter) is monitored in many countries including Australia. Occasionally PM2.5 instruments may report negative measurements, although in realty the ambient air can never contain negative amounts of particles. Some negative readings are caused by instrument faults or procedural errors, thus can be simply invalidated from air quality reporting. There are occasions, however, when negative readings occur due to other factors including technological or procedural limitations. Treatment of such negative data requires consideration of factors such as measurement uncertainty, instrument noise and risk for significant bias in air quality reporting. There is very limited documentation on handling negative PM2.5 data in the literature. This paper demonstrates how a threshold is determined for controlling negative hourly PM2.5 readings in the New South Wales (NSW) air quality data system. The investigation involved a review of thresholds used in different data systems and an assessment of instrument measurement uncertainties, zero air test data and impacts on key reporting statistics when applying different thresholds to historical datasets. The results show that a threshold of -10.0 μg/m3 appears optimal for controlling negative PM2.5 data in public reporting. This choice is consistent with the measurement uncertainty estimates and the zero air test data statistics calculated for the NSW Air Quality Monitoring Network, and is expected not to have significant impacts on key compliance reporting statistics such as data availability and annual average pollution levels. The analysis can be useful for air quality monitoring in other Australian jurisdictions or wider context.
Keywords: Beta Attenuation Monitor (BAM); Compliance reporting; Data validation; Fine particle (PM2.5) monitoring; Negative reading.
© 2023. The Author(s).
Conflict of interest statement
The authors declare no competing interests.
Figures
Similar articles
-
Mortality and Morbidity Effects of Long-Term Exposure to Low-Level PM2.5, BC, NO2, and O3: An Analysis of European Cohorts in the ELAPSE Project.Res Rep Health Eff Inst. 2021 Sep;2021(208):1-127. Res Rep Health Eff Inst. 2021. PMID: 36106702 Free PMC article.
-
Mortality-Air Pollution Associations in Low Exposure Environments (MAPLE): Phase 2.Res Rep Health Eff Inst. 2022 Jul;2022(212):1-91. Res Rep Health Eff Inst. 2022. PMID: 36224709 Free PMC article.
-
Assessment and statistical modeling of the relationship between remotely sensed aerosol optical depth and PM2.5 in the eastern United States.Res Rep Health Eff Inst. 2012 May;(167):5-83; discussion 85-91. Res Rep Health Eff Inst. 2012. PMID: 22838153
-
Trends in Excess Morbidity and Mortality Associated with Air Pollution above American Thoracic Society-Recommended Standards, 2008-2017.Ann Am Thorac Soc. 2019 Jul;16(7):836-845. doi: 10.1513/AnnalsATS.201812-914OC. Ann Am Thorac Soc. 2019. PMID: 31112414 Review.
-
The health benefits of reducing air pollution in Sydney, Australia.Environ Res. 2015 Nov;143(Pt A):19-25. doi: 10.1016/j.envres.2015.09.007. Epub 2015 Sep 27. Environ Res. 2015. PMID: 26414085 Review.
References
-
- Cope M, Keywood M, Emmerson K, et al. Sydney particles study – Stage II. Commonwealth Scientific and Industrial Research Organisation and New South Wales Office of Environment and Heritage; 2014.
-
- Coulson G, Somervell E, Olivares G. An investigation of the performance of different PM monitors in Reefton, prepared for the West Coast Regional Council. National Institute of Water & Atmospheric Research Ltd; 2021.
Publication types
MeSH terms
Substances
LinkOut - more resources
Full Text Sources
Medical
Miscellaneous
