

Calorie restriction outperforms bariatric surgery in a murine model of obesity and triple-negative breast cancer
- PMID: 37698918
- PMCID: PMC10629811
- DOI: 10.1172/jci.insight.172868
Calorie restriction outperforms bariatric surgery in a murine model of obesity and triple-negative breast cancer
Abstract
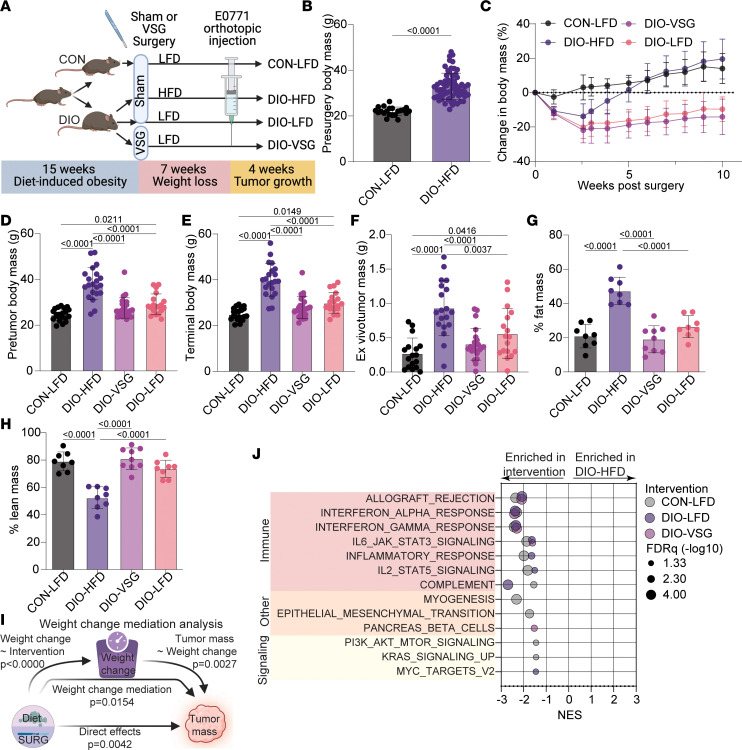
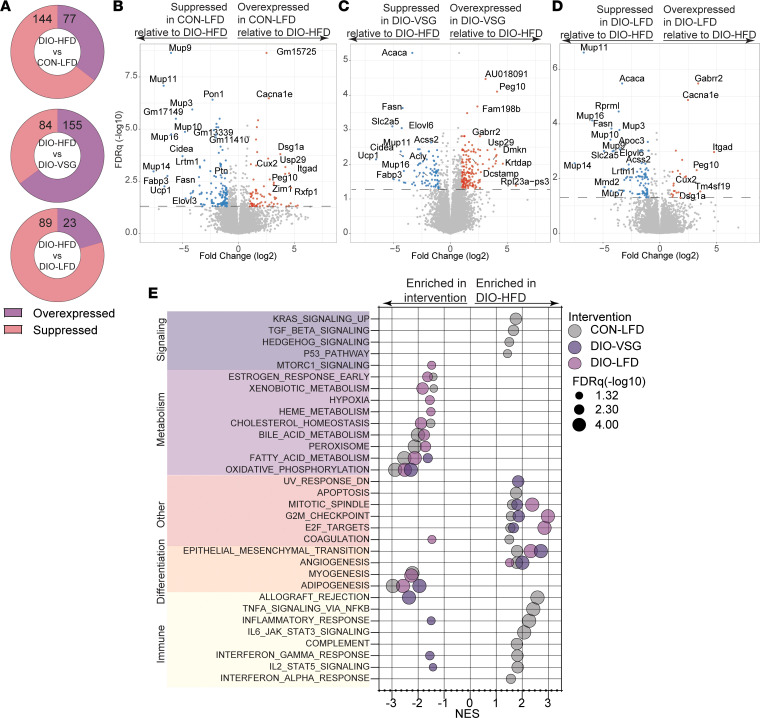
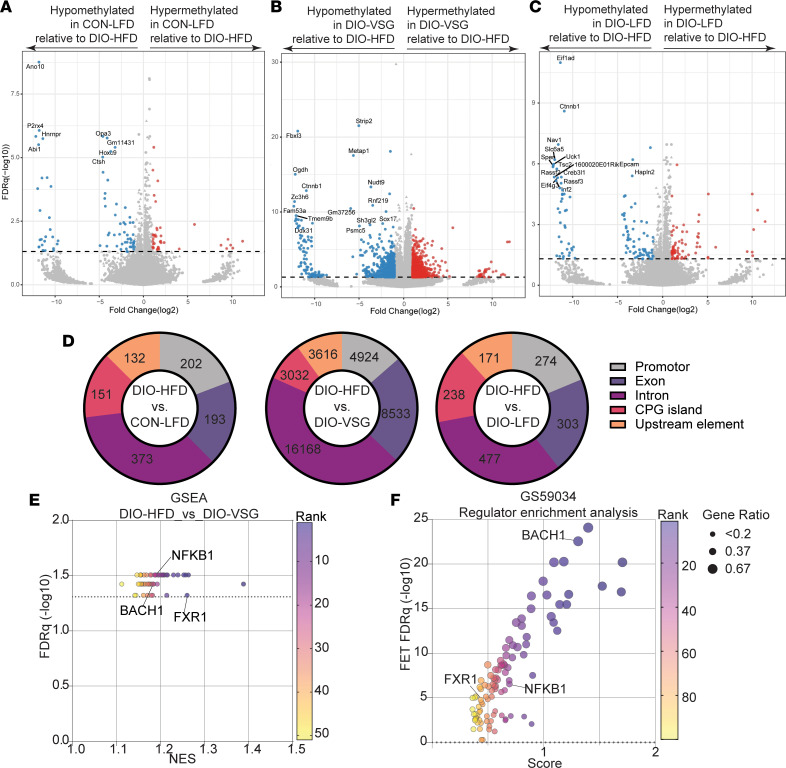
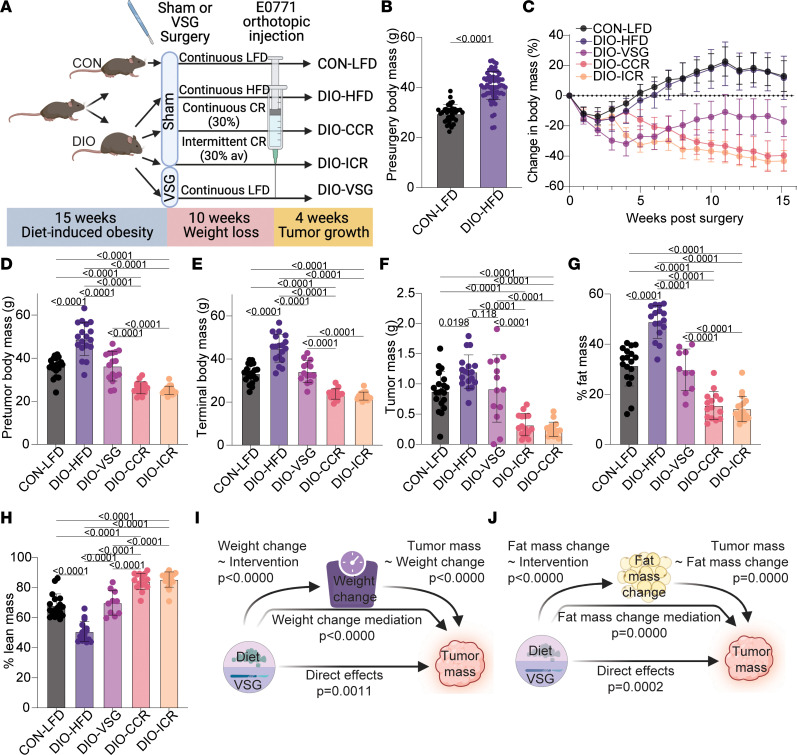
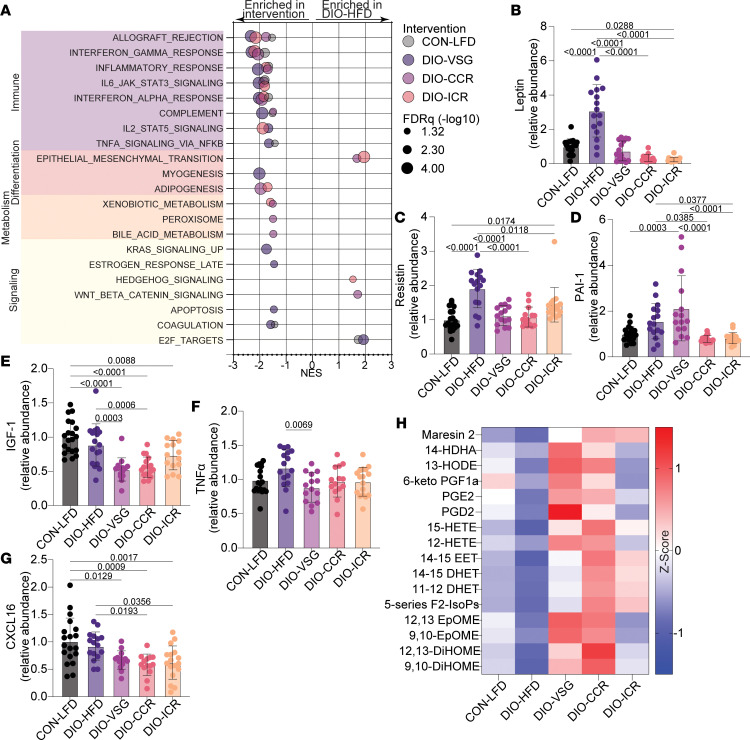
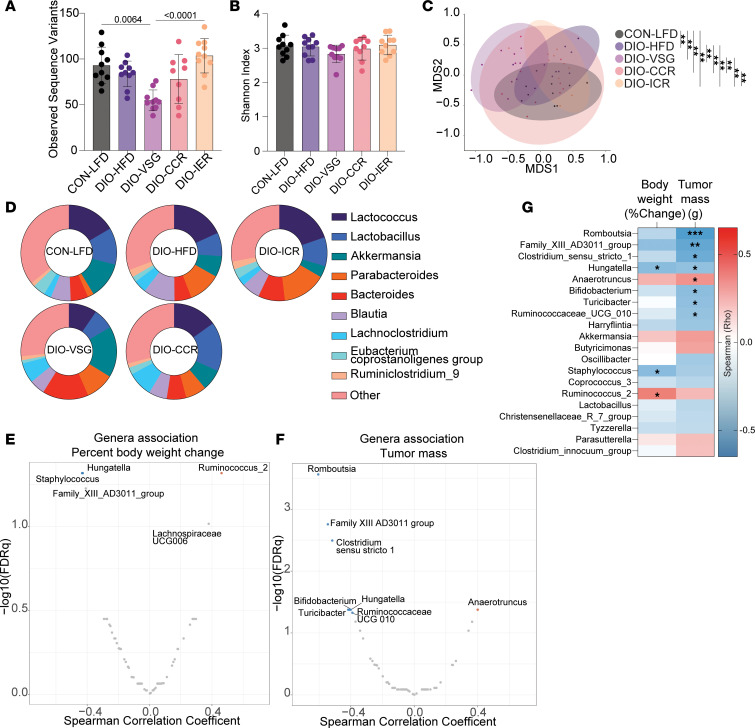
Obesity promotes triple-negative breast cancer (TNBC), and effective interventions are urgently needed to break the obesity-TNBC link. Epidemiologic studies indicate that bariatric surgery reduces TNBC risk, while evidence is limited or conflicted for weight loss via low-fat diet (LFD) or calorie restriction (CR). Using a murine model of obesity-driven TNBC, we compared the antitumor effects of vertical sleeve gastrectomy (VSG) with LFD, chronic CR, and intermittent CR. Each intervention generated weight and fat loss and suppressed tumor growth relative to obese mice (greatest suppression with CR). VSG and CR regimens exerted both similar and unique effects, as assessed using multiomics approaches, in reversing obesity-associated transcript, epigenetics, secretome, and microbiota changes and restoring antitumor immunity. Thus, in a murine model of TNBC, bariatric surgery and CR each reverse obesity-driven tumor growth via shared and distinct antitumor mechanisms, and CR is superior to VSG in reversing obesity's procancer effects.
Keywords: Breast cancer; Metabolism; Obesity; Oncology.
Figures
Similar articles
-
Weight Loss Reverses the Effects of Aging and Obesity on Mammary Tumor Immunosuppression and Progression.Cancer Prev Res (Phila). 2025 Aug 1;18(8):453-463. doi: 10.1158/1940-6207.CAPR-24-0514. Cancer Prev Res (Phila). 2025. PMID: 40231562
-
Reversing the Genomic, Epigenetic, and Triple-Negative Breast Cancer-Enhancing Effects of Obesity.Cancer Prev Res (Phila). 2022 Sep 1;15(9):581-594. doi: 10.1158/1940-6207.CAPR-22-0113. Cancer Prev Res (Phila). 2022. PMID: 35696725 Free PMC article. Clinical Trial.
-
The clinical effectiveness and cost-effectiveness of bariatric (weight loss) surgery for obesity: a systematic review and economic evaluation.Health Technol Assess. 2009 Sep;13(41):1-190, 215-357, iii-iv. doi: 10.3310/hta13410. Health Technol Assess. 2009. PMID: 19726018
-
Weight Loss and/or Sulindac Mitigate Obesity-associated Transcriptome, Microbiome, and Protumor Effects in a Murine Model of Colon Cancer.Cancer Prev Res (Phila). 2022 Aug 1;15(8):481-495. doi: 10.1158/1940-6207.CAPR-21-0531. Cancer Prev Res (Phila). 2022. PMID: 35653548 Free PMC article.
-
Weight loss interventions for chronic asthma.Cochrane Database Syst Rev. 2012 Jul 11;2012(7):CD009339. doi: 10.1002/14651858.CD009339.pub2. Cochrane Database Syst Rev. 2012. PMID: 22786526 Free PMC article.
Cited by
-
Intermittent energy restriction inhibits tumor growth and enhances paclitaxel response in a transgenic mouse model of endometrial cancer.Gynecol Oncol. 2024 Jul;186:126-136. doi: 10.1016/j.ygyno.2024.04.012. Epub 2024 Apr 25. Gynecol Oncol. 2024. PMID: 38669767 Free PMC article.
-
Fasting as an Adjuvant Therapy for Cancer: Mechanism of Action and Clinical Practice.Biomolecules. 2024 Nov 12;14(11):1437. doi: 10.3390/biom14111437. Biomolecules. 2024. PMID: 39595613 Free PMC article. Review.
-
Weight Loss Reverses the Effects of Aging and Obesity on Mammary Tumor Immunosuppression and Progression.Cancer Prev Res (Phila). 2025 Aug 1;18(8):453-463. doi: 10.1158/1940-6207.CAPR-24-0514. Cancer Prev Res (Phila). 2025. PMID: 40231562
-
The gut microbiome enhances breast cancer immunotherapy following bariatric surgery.JCI Insight. 2025 Apr 24;10(11):e187683. doi: 10.1172/jci.insight.187683. eCollection 2025 Jun 9. JCI Insight. 2025. PMID: 40272913 Free PMC article.
-
Tirzepatide attenuates mammary tumor progression in diet-induced obese mice.bioRxiv [Preprint]. 2024 Jan 23:2024.01.20.576484. doi: 10.1101/2024.01.20.576484. bioRxiv. 2024. PMID: 38328151 Free PMC article. Preprint.
References
-
- World Cancer Research Fund/American Institute for Cancer Research. Diet, Nutrition, Physical Activity and Cancer: a Global Perspective. https://www.wcrf.org/wp-content/uploads/2021/02/Summary-of-Third-Expert-... Published 2018. Accessed September 1, 2023.
-
- Hales CM, et al. Prevalence of obesity and severe obesity among adults: United States, 2017-2018. NCHS Data Brief. 2020(360):1–8. - PubMed
Publication types
MeSH terms
Grants and funding
LinkOut - more resources
Full Text Sources
Medical
Molecular Biology Databases
