Case Reports
. 2023 Nov 1;133(21):e171097.
doi: 10.1172/JCI171097.

Proviral location affects cognate peptide-induced virus production and immune recognition of HIV-1-infected T cell clones

Affiliations
Case Reports

Proviral location affects cognate peptide-induced virus production and immune recognition of HIV-1-infected T cell clones

Filippo Dragoni et al. J Clin Invest. .

Abstract

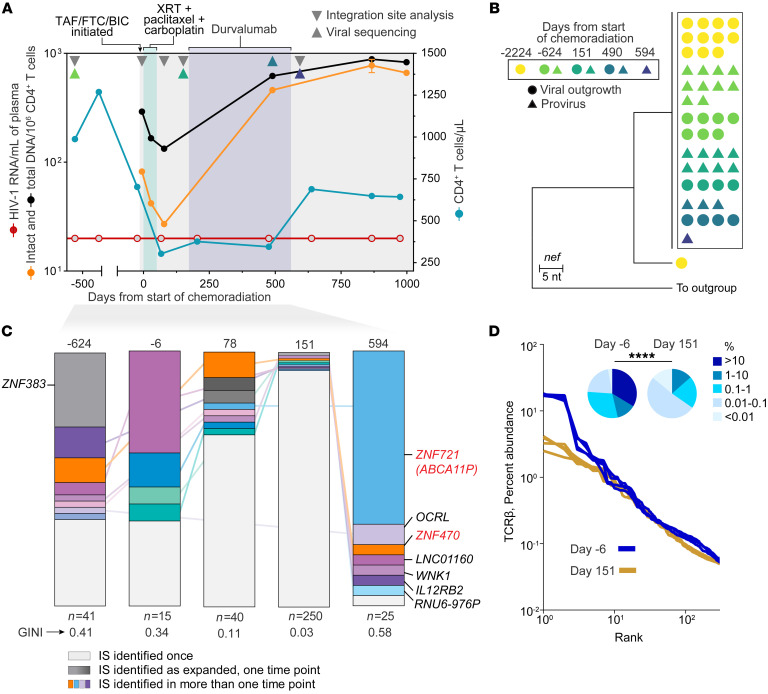
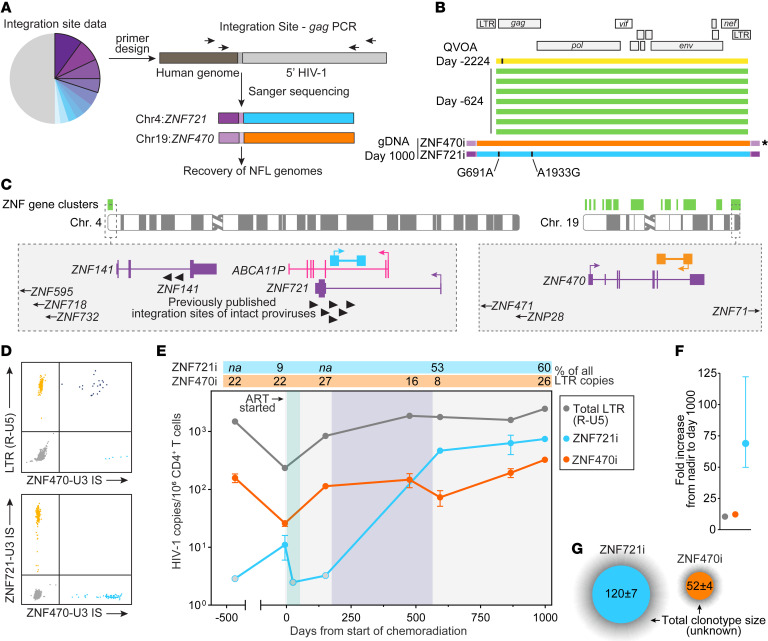
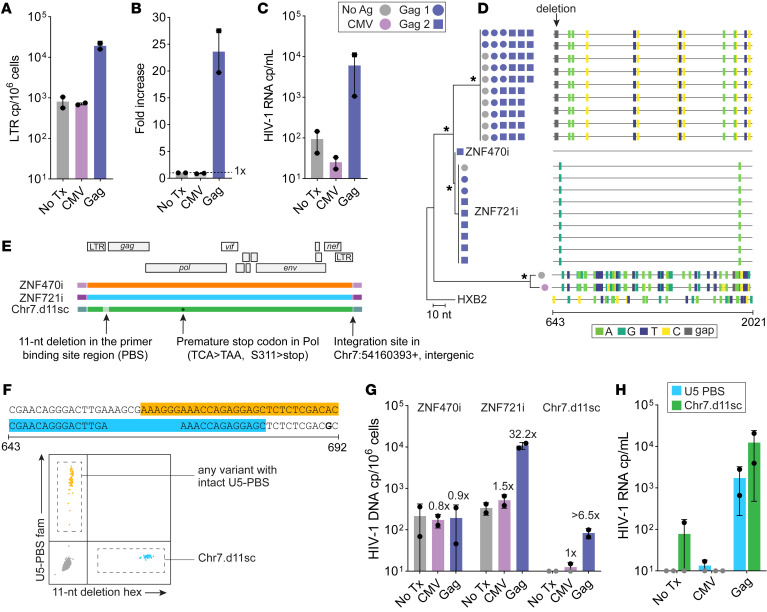
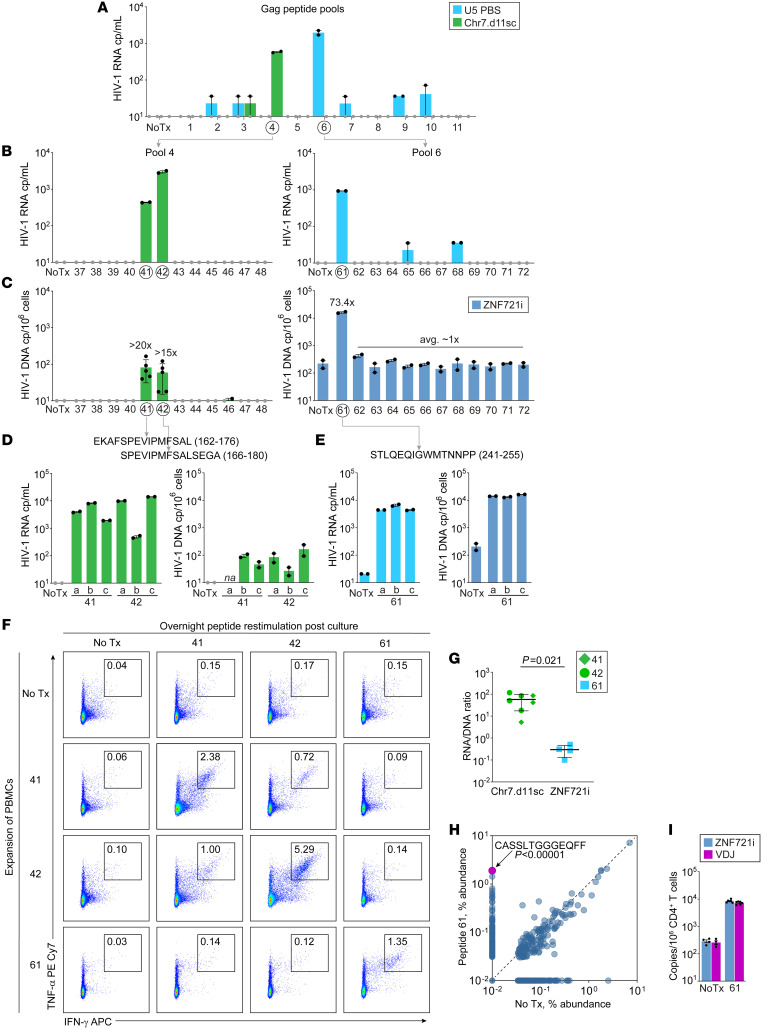
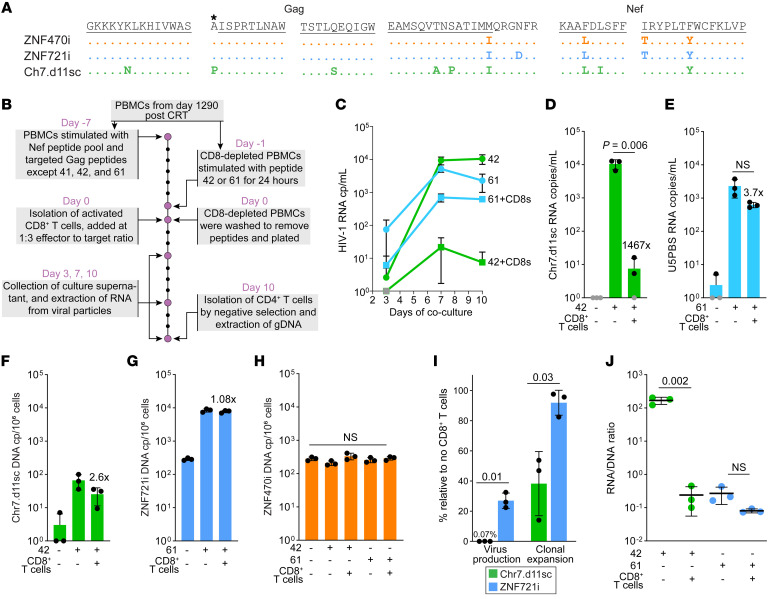
BACKGROUNDHIV-1-infected CD4+ T cells contribute to latent reservoir persistence by proliferating while avoiding immune recognition. Integration features of intact proviruses in elite controllers (ECs) and people on long-term therapy suggest that proviruses in specific chromosomal locations can evade immune surveillance. However, direct evidence of this mechanism is missing.METHODSIn this case report, we characterized integration sites and full genome sequences of expanded T cell clones in an EC before and after chemoradiation. We identified the cognate peptide of infected clones to investigate cell proliferation and virus production induced by T cell activation, and susceptibility to autologous CD8+ T cells.RESULTSThe proviral landscape was dominated by 2 large clones with replication-competent proviruses integrated into zinc finger (ZNF) genes (ZNF470 and ZNF721) in locations previously associated with deeper latency. A third nearly intact provirus, with a stop codon in Pol, was integrated into an intergenic site. Upon stimulation with cognate Gag peptides, infected clones proliferated extensively and produced virus, but the provirus in ZNF721 was 200-fold less inducible. While autologous CD8+ T cells decreased the proliferation of cells carrying the intergenic provirus, they had no effect on cells with the provirus in the ZNF721 gene.CONCLUSIONSWe provide direct evidence that upon activation of infected clones by cognate antigen, the lower inducibility of intact proviruses in ZNF genes can result in immune evasion and persistence.FUNDINGOffice of the NIH Director and National Institute of Dental & Craniofacial Research; NIAID, NIH; Johns Hopkins University Center for AIDS Research.

Keywords: AIDS/HIV; Cellular immune response.


Figures

Figure 1
Figure 1. Chemoradiation and immunotherapy transiently affect the HIV-1 reservoir cell frequency and composition.
(A) Clinical history of study participant ES24 before, during, and after treatment of metastatic lung cancer; values below the limit of detection are indicated with open symbols; intact and total proviruses in total CD4+ T cells were quantified by IPDA (orange and black, respectively). TAF, tenofovir alafenamide; FTC, emtricitabine; BIC, bictegravir; CRT, chemoradiation therapy. (B) Maximum likelihood tree of nef sequences recovered over time from viral outgrowth assays or limiting dilution PCR from CD4+ T cell–derived genomic DNA; identical sequences are indicated by the black box; HXB2 was used as outgroup. (C) Longitudinal integration site analysis shows contraction and reconstitution of proviruses in expanded clones; total integration sites recovered in each sample are indicated below stacked bars; integrations in ZNF genes relevant in subsequent analyses are highlighted in red. IS, integration site. (D) Chemoradiation perturbs the CD4+ T cell repertoire, especially causing loss of most expanded clones; rank-abundance curves indicate distribution of clonality among the top 250 TCRβ sequences; pie charts indicate distribution of clonotypes based of relative abundance. Significance of differences between the 2 time points was assessed by χ2 test. ****P < 0.0001.
Figure 2
Figure 2. Persistence and expansion of 2 clones carrying intact proviruses integrated in ZNF genes.
(A) Experimental approach used to match integration site and proviral sequences of interest. (B) Nearly full-length (NFL) genome sequences from viral outgrowth isolates and intact proviruses integrated into ZNF721 and ZNF470 genes; black ticks show nucleotide differences from ZNF470i, indicated by the asterisk symbol; mutations in ZNF721i relative to ZNF470i are indicated with their positions relative to HXB2. (C) Genomic location and relative orientation of intact proviruses of interest; purple tracks indicate protein-coding genes, with the psudogene ABCA11P indicated in pink; black arrow heads indicate previously published integration sites; genes located outside the gray box are highlighted with arrows. (D) Representative 2D dPCR plots showing duplex amplification of total LTR R-U5 copies and proviruses of interest by integration site–specific assays. IS, integration site. (E) Longitudinal quantification of ZNF721i and ZNF470i proviruses before, during, and after treatment; the gray, green, and purple shaded areas indicate ART, chemoradiation, and immunotherapy, respectively, as in Figure 1A; open circles indicate values below the limit of detection; error bars indicate SEM; values above the graph area represent the percentage of proviruses of interest among all LTR R-U5 copies. (F) Fold increase of total LTR and proviruses of interest from day –6 to day 1000 from the start of chemoradiation. (G) Estimates of total-body clone size, expressed as million cells; the shaded gray area represents the uninfected fraction of each clonotype.
Figure 3
Figure 3. PBMC stimulation with HIV-1 Gag peptides induces proliferation of infected cells and virus production.
(A) CD8-depleted PBMCs collected on day 926 after CRT were cultured for 9 days in the presence of CMV lysate, a Gag peptide pool, or left untreated (No Tx); total LTR (R-U5) copies were quantified from genomic DNA on day 9. The same Gag peptide pool was used in 2 independent experiments from the same time point. (B) Stimulation with Gag peptides led to a marked increase in LTR copies, which was paralleled by virus production detected in the culture supernatant (C). (D) Maximum likelihood phylogeny analysis of HIV-1 RNA U5-gag single genome sequences; star symbols indicate node with bootstrap >75; black arrow indicates 11-nt deletion; highlighter plot on the right shows nucleotide mutations relative to ZNF470i. (E) Characterization of paired full genome sequence and integration site analysis of a new near-intact variant with a premature stop codon in Pol (indicated by asterisk). (F) Design of 2 competition probes used to distinguish intact U5-PBS from the Chr7.d11sc variant; the panel at the bottom shows a dPCR 2D plot of a sample containing both targets. (G) HIV-1 DNA copies per million cells from day 9 of culture by measuring ZNF470i, ZNF721i, or the 11-nt deletion from Chr7.d11sc; numbers above bar charts indicate fold-change from No Tx. (H) HIV-1 RNA copies per mL of supernatant at day 9 of culture; symbols represent 2 independent stimulations; error bars indicate SD.
Figure 4
Figure 4. PBMC stimulation with HIV-1 Gag peptides induces proliferation of infected cells and virus production.
(A) CD8-depleted PBMCs from day 1111 after CRT were stimulated with 11 minipools, each containing 12 Gag peptides; No Tx indicates no treatment negative control; black dots indicate technical replicates of day 9 HIV-1 RNA measurement in supernatant. (B) Virus production at the end of culture of CD8-depleted PBMCs from day 1142 after CRT with individual epitopes from minipools showing virus production in A. (C) Frequency of proviruses of interest by day 9 of culture; fold increase compared to no treatment is indicated above each bar; peptides with increased virus production and cell proliferation are indicated below the graph. (D and E) Validation experiments with individual peptides in triplicate; the statistical significance between peptides 41 and 42 was investigated by 2-tailed parametric t test. (F) Intracellular cytokine staining of CD4+ T cells restimulated with Gag peptides of interest after PBMC expansion; numbers within gates indicate the percentage of cells positive for both TNF-α and IFN-γ. (G) Differential inducibility between proviruses of interest upon stimulation with cognate Gag peptides; inducibility is expressed as the ratio between HIV-1 RNA copies in the supernatant and proviral copies in cells at the end of culture. (H) Analysis of differential abundance (%) of the top 1000 productive TCRs between no treatment and stimulation with peptide 61; the differential abundance of the clonotype carrying the ZNF721i provirus (CASSLTGGGEQFF) was evaluated by χ2 test. (I) Frequency of both provirus and VDJ rearrangement belonging to the CASSLTGGGEQFF clonotype in CD4+ T cells at the end of culture.
Figure 5
Figure 5. Differential impact of autologous CD8+ T cells on virus production and cell proliferation.
(A) Analysis of escape mutations in Gag and Nef in the proviruses of interest; black lines indicate sequences recognized by CD8+ T cells in the context of HLA-B*57; asterisk marks an amino acid residue involved in epitope processing that, if mutated, contributes to escape. Full-length protein sequences are shown in Supplemental Figures 8 and 9. (B) Experimental design to test the impact of CD8+ T cells on virus production and proliferation of infected cells; aliquots of PBMCs from day 1290 after CRT were used to generate activated CD8+ T cells and, separately, stimulated CD8-depleted PBMCs with peptide 42 or 61. (C) HIV-1 RNA from culture supernatant on days 3, 7, and 10; symbols indicate the average of 3 replicate wells, error bars indicate SD; fold reduction between conditions without and with CD8+ T cells is indicated. (D and E) HIV-1 RNA on day 10 across different conditions; black symbols represent replicate wells; values below the limit of detection are indicated in gray; bars show average and SD. (FH) Quantification of proviruses of interest measured by dPCR targeting either the 11-nt deletion (Chr7.d11sc) or integration sites (ZNF721i and ZNF470i) expressed as copies per million CD4+ T cells. (I) Impact of immune recognition on virus production and proliferation of infected cells, expressed as percentage relative to wells without CD8+ T cells. (J) RNA-to-DNA ratios of Chr7.d11sc and ZNF721i upon stimulation with cognate peptides with or without CD8+ T cells. The statistical differences between conditions were evaluated by 2-tailed parametric t test.

Similar articles

Cited by

References

    1. Whitney JB, et al. Rapid seeding of the viral reservoir prior to SIV viraemia in rhesus monkeys. Nature. 2014;512(7512):74–77. doi: 10.1038/nature13594. - DOI - PMC - PubMed
    1. Colby DJ, et al. Rapid HIV RNA rebound after antiretroviral treatment interruption in persons durably suppressed in Fiebig I acute HIV infection. Nat Med. 2018;24(7):923–926. doi: 10.1038/s41591-018-0026-6. - DOI - PMC - PubMed
    1. Chun TW, et al. In vivo fate of HIV-1-infected T cells: quantitative analysis of the transition to stable latency. Nat Med. 1995;1(12):1284–1290. doi: 10.1038/nm1295-1284. - DOI - PubMed
    1. Finzi D, et al. Identification of a reservoir for HIV-1 in patients on highly active antiretroviral therapy. Science. 1997;278(5341):1295–1300. doi: 10.1126/science.278.5341.1295. - DOI - PubMed
    1. Siliciano JD, et al. Long-term follow-up studies confirm the stability of the latent reservoir for HIV-1 in resting CD4+ T cells. Nat Med. 2003;9(6):727–728. doi: 10.1038/nm880. - DOI - PubMed

Publication types