. 2023 Oct 23;8(20):e166470.
doi: 10.1172/jci.insight.166470.

Severe kidney dysfunction in sialidosis mice reveals an essential role for neuraminidase 1 in reabsorption

Affiliations

Severe kidney dysfunction in sialidosis mice reveals an essential role for neuraminidase 1 in reabsorption

Ikhui Kho et al. JCI Insight. .

Abstract

Sialidosis is an ultra-rare multisystemic lysosomal disease caused by mutations in the neuraminidase 1 (NEU1) gene. The severe type II form of the disease manifests with a prenatal/infantile or juvenile onset, bone abnormalities, severe neuropathology, and visceromegaly. A subset of these patients present with nephrosialidosis, characterized by abrupt onset of fulminant glomerular nephropathy. We studied the pathophysiological mechanism of the disease in 2 NEU1-deficient mouse models, a constitutive Neu1-knockout, Neu1ΔEx3, and a conditional phagocyte-specific knockout, Neu1Cx3cr1ΔEx3. Mice of both strains exhibited terminal urinary retention and severe kidney damage with elevated urinary albumin levels, loss of nephrons, renal fibrosis, presence of storage vacuoles, and dysmorphic mitochondria in the intraglomerular and tubular cells. Glycoprotein sialylation in glomeruli, proximal distal tubules, and distal tubules was drastically increased, including that of an endocytic reabsorption receptor megalin. The pool of megalin bearing O-linked glycans with terminal galactose residues, essential for protein targeting and activity, was reduced to below detection levels. Megalin levels were severely reduced, and the protein was directed to lysosomes instead of the apical membrane. Together, our results demonstrated that desialylation by NEU1 plays a crucial role in processing and cellular trafficking of megalin and that NEU1 deficiency in sialidosis impairs megalin-mediated protein reabsorption.

Keywords: Chronic kidney disease; Genetics; Glycobiology; Lysosomes; Nephrology.


Conflict of interest statement

Conflict of interest: The authors have declared that no conflict of interest exists.

Figures

Figure 1
Figure 1. Pathophysiological phenotypes of Neu1ΔEx3 and Neu1Cx3cr1ΔEx3 mice.
(A) Male and female Neu1ΔEx3 mice have a significantly reduced body mass compared with WT mice of the same age. Body mass was measured weekly, from 4 to 17 weeks of age. P values were calculated using 2-way ANOVA with a Bonferroni post hoc test. *P < 0.05, **P < 0.01, ***P < 0.001, ****P < 0.0001. (B) Representative images of 4-month-old Neu1ΔEx3 mice and their sex-matched WT littermates. (C) Kaplan-Meier plots showing the survival of Neu1ΔEx3 and Neu1Cx3cr1ΔEx3 mice and their WT counterparts. (D) Neu1ΔEx3 mice present with visceromegaly of the kidney, liver, and spleen in both males and females. Neu1Cx3cr1ΔEx3 mice present a similar trend with significant differences from WT littermates, observed for spleens of males and kidneys of females. P values were calculated using 1-way ANOVA with a Dunnett post hoc test. (EG) Bone abnormalities in 4-month-old Neu1ΔEx3 mice. (E) Micro-CT scan of tibia showed increased mineral density of the trabecular bone and reduced mineral content and density in the cortical diaphysis bone in Neu1ΔEx3 compared with the WT mice. P values were calculated with 2-tailed t test. (F) A reconstructed 3D image of the spine showed thick and flattened spinous process (white arrow) of the cervical vertebra and short transverse process of the thoracic vertebra (white arrowhead). (G) Histology analysis reveals increased primary spongiosa (squares and vertical lines) and trabecular bone (arrows) in the Neu1ΔEx3 mice.
Figure 2
Figure 2. Neu1ΔEx3 and Neu1Cx3cr1ΔEx3 homozygous mice show deficiency of NEU1 activity and increased lysosomal biogenesis in kidney tissues.
(A) Total neuraminidase and NEU1 enzyme activity were measured in the tissue homogenates of 4-month-old WT, Neu1ΔEx3, and Neu1Cx3cr1ΔEx3 homozygous male and female mice, using fluorogenic substrate, 4-MU NANA, in the absence and in the presence of the NEU3/NEU4 inhibitor, C9-4BPT-DANA. Residual NEU1 activity was reduced to below detection levels in all studied tissues, except for the brain, where the NEU1 activity was reduced in Neu1ΔEx3 but not in Neu1Cx3cr1ΔEx3 mice. P values were calculated using 1-way ANOVA with Dunnett’s post hoc test. (B) mRNA levels of Neu1, Neu2, Neu3, and Neu4 were measured in the kidneys of 3 mice per genotype using quantitative reverse transcription PCR (RT-PCR). (C and D) Elevated levels of lysosomal β-galactosidase and β-hexosaminidase activities, characteristic of increased lysosomal biogenesis, were found in all studied tissues of Neu1ΔEx3 mice as well as in the kidney, spleen, lungs, and brain of female Neu1Cx3cr1ΔEx3 mice and showed a trend toward an increase in the tissues of males. P values were calculated using 1-way ANOVA with Tukey’s post hoc test. All graphs show individual data, means, and SD of experiments performed using tissues from 5 mice per genotype. (E) Increased levels of lysosomal proteins in kidney of Neu1ΔEx3 mice. Bar graph shows exclusive unique peptide counts for 15 most abundant lysosomal proteins. Proteomic analyses were performed using kidney protein extracts from 3 mice per sex per genotype. P values for the exclusive unique peptide counts were calculated using 2-way ANOVA with Holm-Šídák post hoc test. (F) Immunohistochemical analysis shows increased TFEB levels (shown in green) in the nuclei of endothelial cells in proximal tubules of Neu1ΔEx3 mice. DAPI (blue) was used as nuclear counterstain. Bar graph shows quantification (individual data, means, and SD, n = 3) of TFEB/DAPI-labeled areas by ImageJ software (NIH). P values were calculated by unpaired 2-tailed t test.
Figure 3
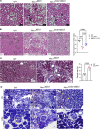
Figure 3. Light microscopy images of cortical and medullary regions of kidney from WT, Neu1ΔEx3, and Neu1Cx3cr1ΔEx3 mice stained with H&E, Masson’s trichrome, and toluidine blue.
(A) Normal glomeruli (G) and renal tubular structures are observed in the kidneys of WT mice. In Neu1ΔEx3 kidney, severe accumulation of storage materials is present in the glomerular cells, and in surrounding tubules (black arrowheads), leading to morphological changes. Deformed tubules with vacuolized epithelial cells are also present in the kidney of Neu1Cx3cr1ΔEx3 mice. Scale bar: 20 μm. (B) A significant loss of nephrons was observed in the kidney cortex of 4-month-old Neu1ΔEx3 mice. Panels show representative images with nephrons circled, and the graph shows individual values (number of nephrons/regions of interest selected at the same positions from the cortex and multiplied by the kidney weight to account for kidney enlargement occurring in NEU1-deficient mice due to lysosomal storage), means, and SD obtained from 3 WT, 3 Neu1ΔEx3, and 4 Neu1Cx3cr1ΔEx3 male and female mice. P values were calculated using 1-way ANOVA with Tukey’s post hoc test. Scale bar: 50 μm. (C) Masson’s trichrome staining reveals collagen deposits (blue) in the tubulointerstitial areas and parietal epithelium of the Bowman’s capsule in Neu1ΔEx3 mouse characteristic of renal fibrosis. Scale bar: 100 μm. (D) WT mouse kidney have normal morphology and do not present buildup of lysosomal vacuoles in intraglomerular cells (G), proximal tubular cells (PT), distal tubular cells (DT), and cells of collecting ducts (CD). Conversely, the kidney of Neu1ΔEx3 mice show a prominent accumulation of vacuoles in intraglomerular cells (G), and, presumably, podocytes (yellow arrow). The epithelial cells of DCT and CD exhibit a prominent accumulation of vacuoles. In Neu1Cx3cr1ΔEx33 mice, both the cortex and medulla were mildly affected. In the cortex, both intraglomerular cells and DT show a moderate accumulation of lysosomal vacuoles. In the medulla, the descending portions of the loop of Henle are normal. PCT, proximal convoluted tubule; DCT, distal convoluted tubule.
Figure 4
Figure 4. Pathological changes in glomerular and tubular cells in Neu1ΔEx3 and Neu1Cx3cr1ΔEx3 mice.
(A) Kidneys of Neu1ΔEx3 mice contain numerous enlarged electron-lucent lysosomes (L) filled with multilamellar structures (black arrowhead) in the proximal convoluted tubule (PCT) and multivesicular bodies (yellow arrowheads) in the lysosomal compartments of the distal convoluted tubules (DCT). Small irregularly shaped mitochondria with fragmented cristae (M) are found throughout the PCT and DCT of Neu1ΔEx3 and Neu1Cx3cr1ΔEx3 mice. In the DCT of Neu1Cx3cr1ΔEx3 mice, mitochondria are dissociated from the distorted basolateral plasma membrane (white arrows). (B) In the glomeruli of Neu1ΔEx3 mice, the podocytes (P) and mesangial cells (M) are severely vacuolated. Higher magnification of podocytes shows multivesicular structures and osmiophilic deposits (yellow arrowhead). The podocyte foot processes (F), which form a discontinuous lining for the inner aspect of the WT glomerular basement membrane, are widely effaced in both Neu1ΔEx3 and Neu1Cx3cr1ΔEx3 mice (black arrows). All transmission electron microscopy panels show representative images taken for 3 WT, 3 Neu1ΔEx3, and 2 Neu1Cx3cr1ΔEx3 mice. Scale bars equal 1 μm (A), 2 μm in glomeruli and 0.2 μm in high-magnification images of podocytes (B). C, capillaries; U, urinary space; E, endothelium. (C) Endothelial cells of the proximal convoluted renal tubules in Neu1ΔEx3 mice reveal accumulation of P62+ and LC3+ puncta, consistent with impaired autophagy and increased phosphorylation (Ser240/244) of S6 ribosomal protein substrate of mTOR complex 1 (mTORC1). Scale bars: 10 μm (left and middle), 1 μm (right). Graph shows relative areas stained with antibodies against P62, LC3, and Ser240/244 S6 quantified with ImageJ. Individual values, means, and SD are shown (n = 3). P values were calculated with multiple unpaired 2-tailed t tests. (D) Immunoblotting of kidney proteins verifies increase in P62, LC3, and Ser240/244 levels. Graph shows bands intensities, quantified with ImageJ software and normalized to the intensities of tubulin immunoreactive bands. Individual values, means, and SD are shown (n = 3). P values were calculated with multiple unpaired 2-tailed t tests.
Figure 5
Figure 5. Abnormal protein glycosylation in Neu1ΔEx3 kidney tissues.
(A) Kidney cortex sections of Neu1ΔEx3 mice show elevated labeling with SNA (purple) and MAL-II (green) lectins and reduced labeling with RCA-1 (red) lectin. PNA labeling (white) shows a nonsignificant trend toward a decrease. (B) SNA (purple) and MAL-II (green) labeling is drastically increased in the proximal convoluted renal tubules of Neu1ΔEx3 mice, RCA-1 labeling (red) shows a decrease and PNA labeling (white) a nonsignificant trend toward a decrease. (C) Treatment of kidney tissues with exogenous pan-specific bacterial Arthrobacter ureafaciens sialidase increases PNA and RCA-1 labeling and reduces MAL-II and SNA labeling in the proximal convoluted renal tubules of both Neu1ΔEx3 and WT mice, confirming specificity of the assay. Images were taken with Leica confocal microscope SP8-DLS. Scale bars equal 100 μm (A) and 10 μm (B and C). Graphs show lectin-positive areas (individual values, means, and SD, n = 3). Quantifications were performed by ImageJ software, and P values were calculated using multiple 2-tailed t tests. (D) Lectin blotting of kidney proteins shows changes in glycosylation of proteins in tissues of Neu1ΔEx3 mice compared with WT mice. Panels show images of representative lectin blots. Red arrows mark protein bands with decreased affinity for PNA and increased affinity for SNA. Graphs show combined intensities (individual values, means, and SD) of protein bands stained with lectins and normalized by combined intensities of Ponceau staining. Quantifications were performed by ImageJ software, and P values were calculated using a 2-tailed t test.
Figure 6
Figure 6. MALDI-TOF MS analysis of mouse kidney proteins shows changes in the profile of N-glycans.
MALDI-TOF profiles (mass range between m/z 900 and 5,500) of permethylated N-glycans from kidney tissue glycoproteins representative for samples from WT (A) and Neu1ΔEx3 (B) female mice showing increased amounts of sialylated structures (underlined m/z values). Structures of the glycan species were corroborated by MS/MS analyses. Species were detected as [M+Na]+ molecular ions (monoisotopic masses). Graphical representation of glycans is based on the third edition of the Essentials of Glycobiology (74): GlcNAc, blue square; mannose, green circle; galactose, yellow circle; Neu5Ac, purple diamond; Neu5Gc, light blue diamond; fucose, red triangle.
Figure 7
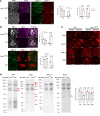
Figure 7. Aberrant glycosylation of megalin affects its abundance and trafficking in the kidney of Neu1ΔEx3 mice.
(A) Immunoblot shows reduction of megalin in Neu1ΔEx3 mouse kidney. Lectin blots show that megalin affinity to SNA substantially increases, suggestive of protein hypersialylation. A total of 100 or 25 μg of kidney protein extract from Neu1ΔEx3 and WT mice was analyzed. Arrows mark megalin position. (B) In the WT kidney, megalin shows equal intensity of PNA staining, before and after PNGaseF treatment, suggesting that the protein contains mainly O-linked glycans with terminal galactose residues. In Neu1ΔEx3 kidney, the PNGaseF-treated protein does not show affinity to PNA, suggesting the absence of glycans with terminal galactose. (C) Megalin in WT kidney is recognized by RCA-1 specific for N-linked glycans with terminal galactose residues. In Neu1ΔEx3 kidney, megalin is recognized by RCA-1 only after treatment with bacterial sialidase, consistent with oversialylation masking galactose residues. (D) In proximal renal tubules of Neu1ΔEx3 kidney, megalin (green) colocalizes with SNA (magenta), suggesting its hypersialylation. 3D images were acquired using SP8-DLS high-resolution confocal microscope. Colocalization of megalin and SNA was analyzed by LasX software (Supplemental Videos 1 and 2). (E) RCA-1 colocalizes with megalin in WT but not in Neu1ΔEx3 kidney. RCA-1 and PNA staining is increased after sialidase treatment. (F) In proximal tubules of WT kidney, megalin (green) is found on the apical membrane; in Neu1ΔEx3 kidney, it is found inside enlarged LAMP2+ lysosomes (white arrows and Supplemental Videos 3 and 4). (G) Megalin, β2-microglobulin (β2-MG), vitamin D–binding protein (DBP), and 25-OH vitamin D are detected in urine of Neu1ΔEx3 mice. (H) Cubilin (CUBN) and solute carrier SGLT2 show a trend toward reduction on the apical surface of the proximal tubules of Neu1ΔEx3 kidney. (I) Immunoblotting verifies reduction of SGLT2 protein in Neu1ΔEx3 kidney homogenates. Fluorescence and band intensities were quantified with ImageJ software. Microphotographs in D and F were taken at 630× original magnification with 5× zoom. Individual data, means, and SD (n = 3) are shown. P values were calculated using unpaired multiple t test.

Similar articles

Cited by

References

    1. Reily C, et al. Glycosylation in health and disease. Nat Rev Nephrol. 2019;15(6):346–366. doi: 10.1038/s41581-019-0129-4. - DOI - PMC - PubMed
    1. Varki A. Sialic acids in human health and disease. Trends Mol Med. 2008;14(8):351–360. doi: 10.1016/j.molmed.2008.06.002. - DOI - PMC - PubMed
    1. Mohos SC, Skoza L. Glomerular sialoprotein. Science. 1969;164(3887):1519–1521. doi: 10.1126/science.164.3887.1519. - DOI - PubMed
    1. Charest PM, Roth J. Localization of sialic acid in kidney glomeruli: regionalization in the podocyte plasma membrane and loss in experimental nephrosis. Proc Natl Acad Sci U S A. 1985;82(24):8508–8512. doi: 10.1073/pnas.82.24.8508. - DOI - PMC - PubMed
    1. Klein PJ, et al. Thomsen-Friedenreich antigen in haemolytic-uraemic syndrome. Lancet. 1977;2(8046):1024–1025. doi: 10.1016/S0140-6736(77)92915-4. - DOI - PubMed

Publication types

Substances

Grants and funding