. 2023 Sep 12;8(19):e172658.
doi: 10.1172/jci.insight.172658.

Mild/asymptomatic COVID-19 in unvaccinated pregnant mothers impairs neonatal immune responses

Affiliations

Mild/asymptomatic COVID-19 in unvaccinated pregnant mothers impairs neonatal immune responses

Brianna M Doratt et al. JCI Insight. .

Abstract

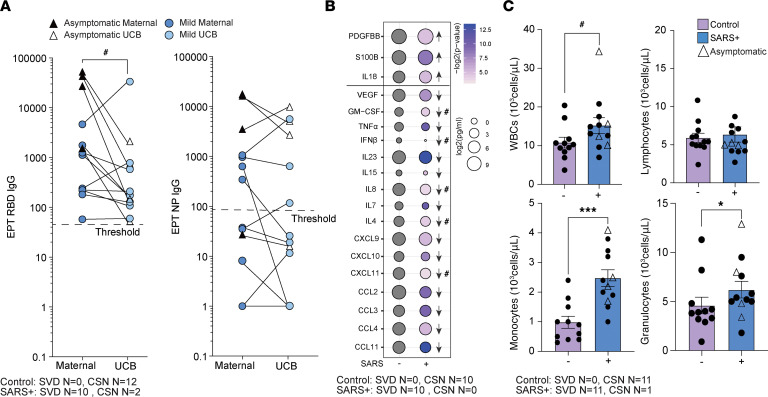
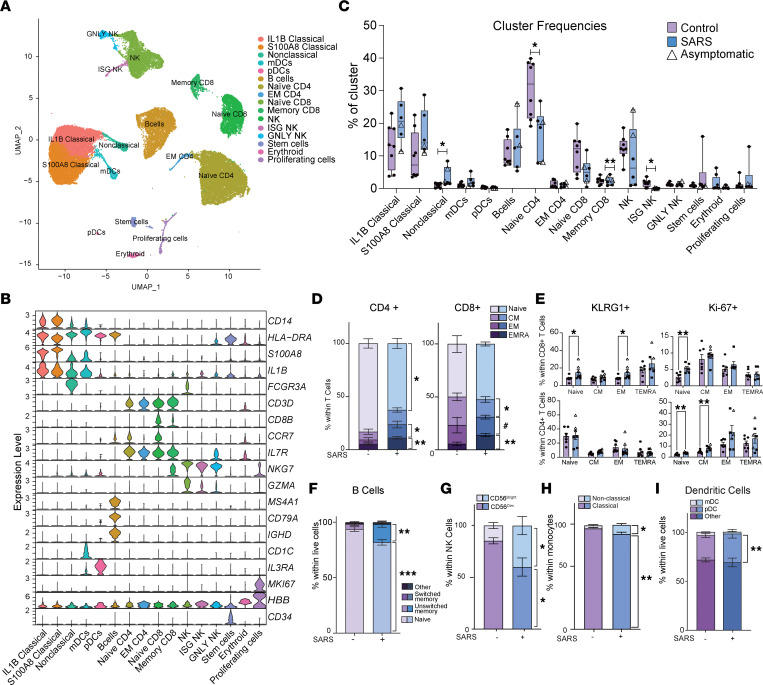
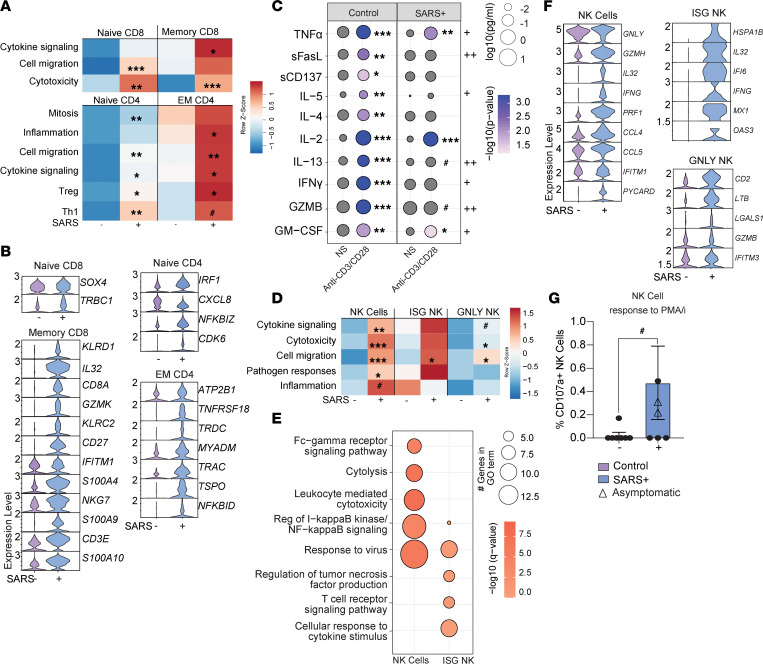
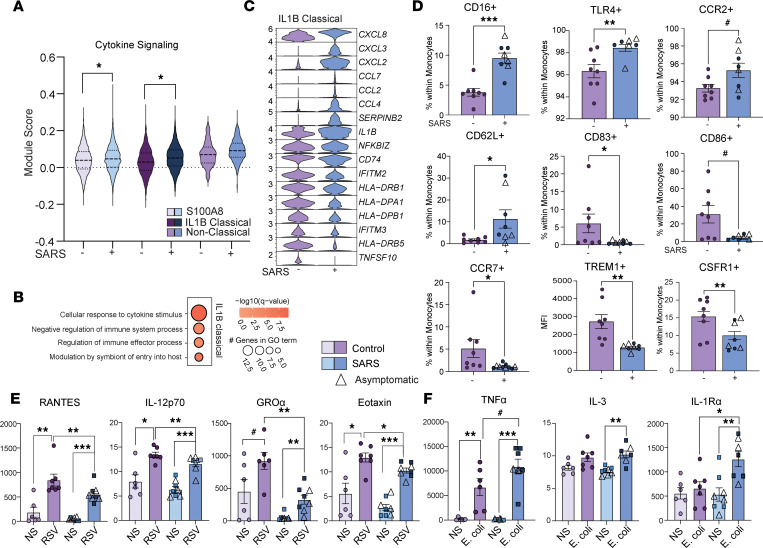
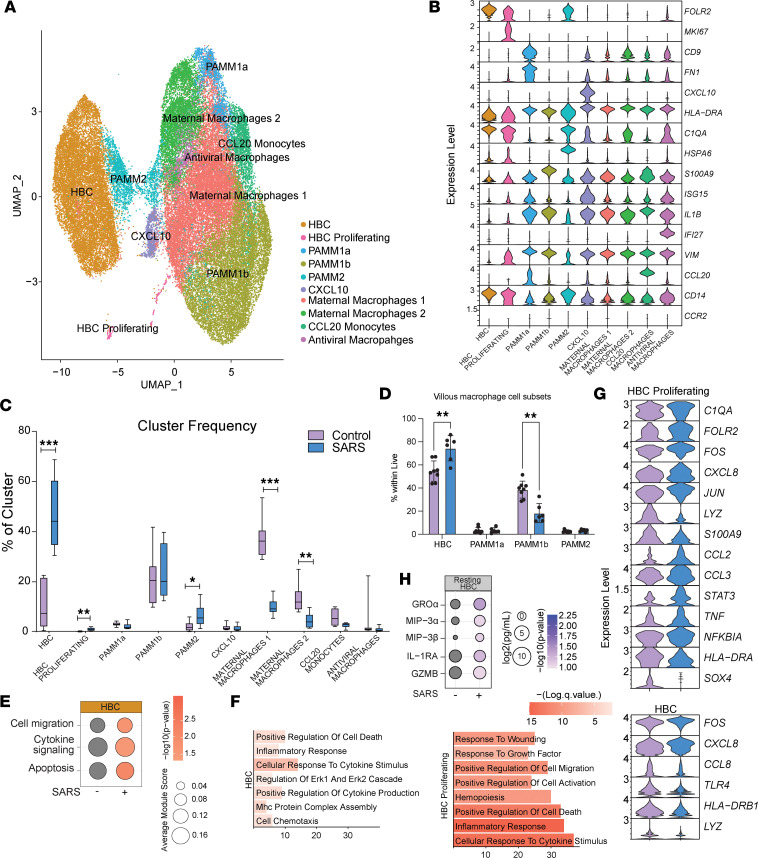
Maternal SARS-CoV-2 infection triggers placental inflammation and alters cord blood immune cell composition. However, most studies focus on outcomes of severe maternal infection. Therefore, we analyzed cord blood and chorionic villi from newborns of unvaccinated mothers who experienced mild/asymptomatic SARS-CoV-2 infection during pregnancy. We investigated immune cell rewiring using flow cytometry, single-cell RNA sequencing, and functional readouts using ex vivo stimulation with TLR agonists and pathogens. Maternal infection was associated with increased frequency of memory T and B cells and nonclassical monocytes in cord blood. Ex vivo T and B cell responses to stimulation were attenuated, suggesting a tolerogenic state. Maladaptive responses were also observed in cord blood monocytes, where antiviral responses were dampened but responses to bacterial TLRs were increased. Maternal infection was also associated with expansion and activation of placental Hofbauer cells, secreting elevated levels of myeloid cell-recruiting chemokines. Moreover, we reported increased activation of maternally derived monocytes/macrophages in the fetal placenta that were transcriptionally primed for antiviral responses. Our data indicate that even in the absence of vertical transmission or symptoms in the neonate, mild/asymptomatic maternal COVID-19 altered the transcriptional and functional state in fetal immune cells in circulation and in the placenta.

Keywords: COVID-19; Cellular immune response; Immunology; Innate immunity; Monocytes.


Figures

Figure 1
Figure 1. Maternal SARS infection alters frequency of immune cells and immune mediators.
(A) Maternal and UCB anti-RBD (left) and anti-NP (right) EPTs. N = 12/group. (B) Bubble plot comparing UCB plasma immune mediators from control and maternal SARS+ group. Size represents analyte concentration (pg/mL), whereas color represents statistical significance. N = 10/group. (C) UCB complete blood cell counts, including white blood cell (top left), lymphocyte (top right), monocyte (bottom left), and granulocyte (bottom right) proportions from control and maternal SARS+ groups. N = 11 for controls and N = 12 for the SARS+ group. Group differences between data sets normally distributed were tested using an unpaired t test (for data sets with equal variances) or an unpaired t test with Welch’s correction (for cases with unequal variances). Data sets not normally distributed were subjected to nonparametric Mann-Whitney test. Error bars represent the data mean ± SEM. (#P < 0.1, *P < 0.05, ***P < 0.0001.) SVD, standard vaginal delivery; CSN, cesarean section.
Figure 2
Figure 2. Impact of maternal mild/asymptomatic SARS-CoV-2 infection on phenotype and frequencies of cord blood immune cells.
(A) Uniform manifold approximation and projection (UMAP) of 42,486 live immune cells from UCBMCs of control and maternal SARS+ groups (N = 4/group) showing 16 clusters. (B) Violin plots of marker genes used for cluster identification. EM, effector memory; GNLY, high expression of GNLY gene; mDC, myeloid dendritic cell. (C) Box-and-whisker plot comparing cluster frequencies in control and maternal SARS+ groups. Triangles indicate asymptomatic maternal infection. Box plots show the interquartile range (box), median (line), and minimum and maximum (whiskers). (D) Stacked bar graphs of UCB CD4+ and CD8+ T cell subset frequencies in control and maternal SARS+ groups by flow cytometry. (E) Bar graphs comparing KLRG1 and Ki-67 expression within CD4+ and CD8+ T cells between control and maternal SARS+ groups. Triangles indicate asymptomatic maternal infection. (FI) Stacked bar graphs comparing (F) B cell, (G) CD56bright/dim NK cell, (H) nonclassical and classical monocyte, and (I) dendritic cell subsets between control and maternal SARS+ group. For DI N = 7/group. Group differences between data sets normally distributed were tested using an unpaired t test (for data sets with equal variances) or an unpaired t test with Welch’s correction (for cases with unequal variances). Data sets not normally distributed were subjected to nonparametric Mann-Whitney test. Error bars represent the data mean ± SEM. (#P < 0.1, *P < 0.05, **P < 0.01, ***P < 0.001.) CM, central memory.
Figure 3
Figure 3. The impact of maternal SARS-CoV-2 infection on fetal lymphocytes and NK cells.
(A) Heatmap of module scores within T cell clusters for the terms indicated. (B) Violin plot comparing normalized transcript counts of select DEGs within the indicated T cell cluster. (C) Bubble plot comparing secreted levels of immune mediators in cell culture supernatants following stimulation of UCBMCs from control and maternal SARS+ groups with anti-CD3/CD28. Size represents the analyte concentration (pg/mL), and color represents the level of P value compared with nonstimulated cells. Plus signs indicate P value between stimulated control and maternal SARS+ groups (+P < 0.05, ++P < 0.01). N = 10/group. NS, no stimulation. (D) Heatmap of module scores within NK cell clusters for indicated terms. (E) Bubble plot comparing functional enrichment of DEGs relative to controls within ISG NK cell and NK cell clusters. Size indicates number of genes and color represents P value. (F) Violin plot of select DEGs within the shown NK cell clusters. (G) Bar graph of total NK cell responses to PMA/ionomycin stimulation. N = 7/controls, N = 6/SARS+ group. Group differences between data sets normally distributed were tested using an unpaired t test (for data sets with equal variances) or an unpaired t test with Welch’s correction (for cases with unequal variances). Data sets not normally distributed were subjected to nonparametric Mann-Whitney test. Error bars represent the data mean ± SEM. (#P < 0.1, *P < 0.05, **P < 0.01, ***P < 0.001.)
Figure 4
Figure 4. The impact of maternal SARS-CoV-2 infection on fetal myeloid cells.
(A) Violin plot of module scores within monocyte subsets for cytokine signaling. (B) Bubble plot of functional enrichment of DEGs within the IL-1B classical monocyte cluster. Size indicates number of genes and color represents P value. (C) Violin plots of select DEGs within IL-1B classical monocytes. (D) Bar graphs of activation phenotypes by maternal infection status. (E and F) Scatterplot comparing immune mediators (pg/mL) in culture supernatants of UCBMCs stimulated overnight with (E) RSV or (F) E. coli in control and maternal SARS+ groups. N = 8/group. Group differences between data sets normally distributed were tested using an unpaired t test (for data sets with equal variances) or an unpaired t test with Welch’s correction (for cases with unequal variances). Data sets not normally distributed were subjected to nonparametric Mann-Whitney test. Error bars represent the data mean ± SEM. (#P < 0.1, *P < 0.05, **P < 0.01, ***P < 0.001.)
Figure 5
Figure 5. Impact of maternal SARS-CoV-2 infection on immune cells in the villous compartment.
(A) UMAP of 48,553 immune cells within the villous compartment showing 10 clusters. (B) Violin plots of marker genes used for cluster annotation. PAMM, placenta-associated maternal macrophage and monocyte. (C) Box-and-whisker plots comparing relative cluster frequencies by infection status. Box plots show the interquartile range (box), median (line), and minimum and maximum (whiskers). (D) Bar graph comparing villous monocyte/macrophage subsets identified by flow cytometry. (E) Bubble plot comparing module scores within HBC cluster for the terms indicated. Size indicates number of genes and color represents P value. (F) Bar plot of GO terms for DEGs between controls and maternal SARS+ groups from the indicated clusters. Length of the bar indicates the number of genes and color intensity represents P value. (G) Violin plots of select DEGs within the indicated clusters. (H) Bubble plot comparing levels of immune factors secreted by resting HBCs. Size indicates number of genes and color represents P value. Group differences between data sets normally distributed were tested using an unpaired t test (for data sets with equal variances) or an unpaired t test with Welch’s correction (for cases with unequal variances). Data sets not normally distributed were subjected to nonparametric Mann-Whitney test. Error bars represent the data mean ± SEM. (*P < 0.05, **P < 0.01, ***P < 0.001.)

Similar articles

Cited by

References

    1. CDC. Covid Data Tracker. Pregnancy Data. https://covid.cdc.gov/covid-data-tracker/#pregnancy-data. Accessed September 5, 2023.
    1. Regan AK, et al. SARS-CoV-2 infection during pregnancy and associated perinatal health outcomes: a national US cohort study. J Infect Dis. 2022;225(5):759–767. doi: 10.1093/infdis/jiab626. - DOI - PMC - PubMed
    1. Doyle TJ, et al. Maternal and perinatal outcomes associated with severe acute respiratory syndrome coronavirus 2 (SARS-CoV-2) infection during pregnancy, Florida, 2020-2021: a retrospective cohort study. Clin Infect Dis. 2022;75(suppl 2):S308–S316. doi: 10.1093/cid/ciac441. - DOI - PMC - PubMed
    1. Pulinx B, et al. Vertical transmission of SARS-CoV-2 infection and preterm birth. Eur J Clin Microbiol Infect Dis. 2020;39(12):2441–2445. doi: 10.1007/s10096-020-03964-y. - DOI - PMC - PubMed
    1. Hecht JL, et al. SARS-CoV-2 can infect the placenta and is not associated with specific placental histopathology: a series of 19 placentas from COVID-19-positive mothers. Mod Pathol. 2020;33(11):2092–2103. doi: 10.1038/s41379-020-0639-4. - DOI - PMC - PubMed

Publication types

Substances