. 2023 Nov 1;133(21):e162129.
doi: 10.1172/JCI162129.

PLK1 inhibition dampens NLRP3 inflammasome-elicited response in inflammatory disease models

Affiliations

PLK1 inhibition dampens NLRP3 inflammasome-elicited response in inflammatory disease models

Marta Baldrighi et al. J Clin Invest. .

Abstract

Unabated activation of the NLR family pyrin domain-containing 3 (NLRP3) inflammasome is linked with the pathogenesis of various inflammatory disorders. Polo-like kinase 1 (PLK1) has been widely studied for its role in mitosis. Here, using both pharmacological and genetic approaches, we demonstrate that PLK1 promoted NLRP3 inflammasome activation at cell interphase. Using an unbiased proximity-dependent biotin identification (Bio-ID) screen for the PLK1 interactome in macrophages, we show an enhanced proximal association of NLRP3 with PLK1 upon NLRP3 inflammasome activation. We further confirmed the interaction between PLK1 and NLRP3 and identified the interacting domains. Mechanistically, we show that PLK1 orchestrated the microtubule-organizing center (MTOC) structure and NLRP3 subcellular positioning upon inflammasome activation. Treatment with a selective PLK1 kinase inhibitor suppressed IL-1β production in in vivo inflammatory models, including LPS-induced endotoxemia and monosodium urate-induced peritonitis in mice. Our results uncover a role of PLK1 in regulating NLRP3 inflammasome activation during interphase and identify pharmacological inhibition of PLK1 as a potential therapeutic strategy for inflammatory diseases with excessive NLRP3 inflammasome activation.

Keywords: Cell Biology; Cellular immune response; Cytoskeleton; Immunology.


Figures
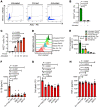
Figure 1
Figure 1. PLK1 inhibition reduces IL-1β output upon NLRP3 inflammasome activation during interphase.
(AC) After 7 days of differentiation, murine BMDMs were primed (100 ng/mL LPS, 5 hours) and activated (5 μM nigericin, for up to 2 hours). Phosphohistone H3 (PHH3) was used as a mitotic marker (A and B), and cells with high ASC fluorescence (ASChi) were identified as an activated speck-forming subpopulation (A and C). n = 3/group. PE, phycoerythrin. (D and E) Geometric (geom) MFI of PLK1 was measured in mitotic cells (dark green) and in nonmitotic cells under the untreated condition (green) and in nonmitotic cells under the primed condition (orange). An isotype antibody control (Isotype Ab. Ctrl) and a secondary antibody control (Sec. Ab. Ctrl) were used. n = 3/group. (FH) Primed (100 ng/mL LPS, 5 hours) BMDMs were activated (5 mM ATP, 30 minutes), with or without selective PLK1 inhibitors (3 μM cyclapolin 9 [C9]; 10 nM SBE13; 50 nM Ro3280; 0.8 nM BI6727) at the activation stage. The supernatants were collected to measure the IL-1β concentration (F), cell death (G), and the TNF-α concentration (H). The caspase 1 inhibitor Ac-YVAD-FMK or no inhibitor (n.i.) treatment was used as a control. Results are representative of 4 (AE) or 3 (FH) independent experiments. n = 9, 7, 5, 5, 5, and 5 (in order from the left to the right bars in F and H). n = 4/group (G). One-way ANOVA with Tukey’s post hoc test was used for statistical analysis. All data are the mean ± SEM.
Figure 2
Figure 2. PLK1 inhibition reduces pro–caspase 1 and pro–IL-1β cleavage and ASC speck formation in response to various NLRP3 inflammasome stimuli.
(AC) Primed (100 ng/mL LPS, 5 hours) WT or NLRP3-KO BMDMs, treated with NLRP3 inflammasome–activating stimuli as indicated (5 μM nigericin for 2 hours; 250 μg/mL MSU for 3 hours; 250 μg/mL cholesterol crystals [CC] for 3 hours; 250 μg/mL Alum crystals for 6 hours; 1 μg/mL flagellin for 3 hours; 1 μg/mL poly(dA:dT) for 3 hours), were subjected to PLK1 inhibition by cyclapolin 9 (3 μM) at the activation stage. Supernatants were collected for IL-1β quantification by ELISA. n = 6/group (A and B); n = 3–4/group (C). (D) Cell lysates and supernatants from WT BMDMs treated as in AC as indicated were analyzed by Western blotting. (E) Peritoneal macrophages were elicited upon i.p. treatment with 1 mL 3% thioglycolate for 4 days and then isolated. Isolated macrophages were primed (100 ng/mL LPS, 5 hours) and activated (5 mM ATP, 30 minutes). Supernatants were collected for IL-1β quantification by ELISA. Control: LysMCre/WT Plk1WT/WT (n = 3); deletion: LysMCre/WT Plk1fl/fl (n = 4). (FI) RosaCreErt2/WT Plk1fl/fl BMDMs were treated with 4-OH tamoxifen (0.002 mg/mL 4-OH Tam, 24 hours) before and during priming (100 ng/mL LPS, 5 hours) to deplete PLK1, and then cells were activated (5 mM ATP, 30 minutes). (F) Supernatants were collected for IL-1β quantification by ELISA (n = 8). (G) Cell lysates and supernatants were analyzed by Western blotting. Cells stained for ASC were used to quantify the percentage of speck-containing BMDMs across treatments. Scale bars: 20 μm (H) and quantification (No Tam, n = 10; 4-OH Tam, n = 12) (I). Results are representative of 3 (A and C) or 2 (DG) independent experiments. Two-way ANOVA with Šidák’s post hoc test was used for statistical analysis (AC). An unpaired t test was used for statistical analysis (E, F, and I). All data are the mean ± SEM. CASP1, caspase 1; MW, molecular weight.
Figure 3
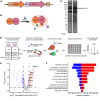
Figure 3. An unbiased Bio-ID screen of PLK1 interactome upon NLRP3 inflammasome activation reveals a proximal association of PLK1 with NLRP3.
(A) Schematic representation of the bioengineered plasmid expressing the biotin ligase BASU connected to murine PLK1 with a (GGGS)3 linker. (B) Schematic representation of the biotinylated proteins associated with PLK1 and BASU in this assay. (C) Transduced iBMDMs were treated with biotin (50 μM, 2 hours), and cell lysates were run on a Western blot to show biotinylated proteins stained by streptavidin-HRP. The size of the fusion protein BASU-PLK1 is marked by an arrow. (D) iBMDMs transduced with BASU-GS3-PLK1 were treated for inflammasome activation and biotin labeling as indicated. Cells were lysed, and biotinylated proteins were purified using magnetic beads. Trypsinization was followed by peptide quantification, and 5 μg peptides per sample were submitted for TMT labeling and mass spectrometric analysis. (E) Volcano plot for the interactome with PLK1 after NLRP3 inflammasome activation compared with the interactome with PLK1 under the primed condition. Red dots represent the enhanced protein interaction in the activated group, blue dots represent the enhanced protein interaction in the primed group, and gray dots are nonsignificant relative to the selected cutoff threshold (the cutoff threshold for the log2 fold change [FC] is 0.4, equal to a complete 1.3-fold change; the significance-adjusted P value is less than 0.05, by Benjamini-Hochberg correction). (F) GO analysis shows the upregulated (red) and downregulated (blue) proteins interacting with PLK1 after NLRP3 inflammasome activation in protein subgroups with corresponding numbers.
Figure 4
Figure 4. PLK1 interacts with NLRP3.
(AC) Reconstituted HEK 293T cells were used to perform co-IPs to determine the association between PLK1 and NLRP3 using full-length proteins (A), NLRP3 domains (PYD, pyrin domain; ΔPYD, pyrin domain deletion; LRR, leucine-rich repeat; ΔLRR, LRR deletion) with full-length PLK1 (B), or PLK1 domains (ΔKD, KD deletion; ΔPBD2, PBD2 deletion) with full-length NLRP3 (C). Domain structures of NLRP3 and PLK1 are shown in B and C. Whole-cell lysates were analyzed as an indication of transfection. (D) Bio-Layer interferometric analysis with immobilized, purified NLRP3 protein as the ligand and purified PLK1 protein as the analyte of different concentrations. (E and F) BMDMs were primed (100 ng/mL LPS, 5 hours) and then activated (5 mM ATP, 30 minutes). PLK1 inhibition with 3 μM cyclapolin 9 was used at the activation stage. Interaction between PLK1 and NLRP3 was detected by PLA. Scale bars: 10 μm (E), and quantification of PLA signals per cells (n = 185, 38, 150, and 88, in order from the left bar to the right bar) (F). Two-way ANOVA with Šidák’s post hoc test was used for statistical analysis. All data are the mean ± SEM.
Figure 5
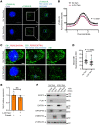
Figure 5. PLK1 regulates microtubule nucleation and affects NLRP3 inflammasome positioning.
(A and B) RosaCreErt2/WT Plk1fl/fl BMDMs were treated with 4-OH Tamoxifen (0.002 mg/mL 4-OH Tam, 24 hours) before and during priming (100 ng/mL LPS, 5 hours) and were then activated (5 mM ATP, 30 minutes). γ-Tubulin fluorescence was quantified within a 3 × 3 μm ROI centered around the main γ-tubulin focus. Scale bars: 10 μm (lower magnification) and 3 μm (enlarged insets) (A). Quantification by fluorescence intensity (n = 20) (B). (C and D) RosaCreErt2/WT Plk1fl/fl BMDMs were treated as in A. EB1 fluorescence was quantified in a circular ROI of 3 μM diameter. Scale bars: 3 μm (C). Quantification by mean EB1 fluorescence (No Tam, n = 54; 4-OH Tam, n = 77) (D). (E) RosaCreErt2/WT Plk1fl/fl BMDMs were treated with 4-OH tamoxifen (0.002 mg/mL 4-OH Tam, 24 hours) before and during priming (100 ng/mL LPS, 5 hours). Nlrp3 relative expression was quantified by qPCR. n = 3/group. (F) RosaCreErt2/WT Plk1fl/fl BMDMs were treated as in A and processed for fractionation Western blotting. cytop, cytoplasmic; memb, membrane; ins, insoluble fractions. GAPDH, GRASP65, and vimentin, respectively, were used as markers for each fraction. (F) Results are representative of 2 independent experiments. (AF) Treatments without 4-OH tamoxifen were used as controls. Two-way ANOVA with Šidák’s post hoc test (B) and an unpaired t test (D and E) were used for statistical analysis. All data are the mean ± SEM.
Figure 6
Figure 6. PLK1 inhibition suppresses the inflammatory response in a LPS-induced endotoxemia model.
C57BL/6 WT and NLRP3-KO mice were treated with BI6727 (5 mg/kg, i.p.) or control (Ctrl) vehicle, followed by LPS administration (20 mg/kg, i.p.). (A) Experimental scheme. Samples for cytokine measurement and tissue assessment were collected at the indicated time points. (B and C) IL-1β levels were measured in peritoneal fluids (B) (WT: Ctrl vehicle, n = 8; WT: BI6727, n = 8; NLRP3-KO: Ctrl vehicle, n = 7; NLRP3-KO: BI6727, n = 8), and in serum (C). WT: Ctrl vehicle, n = 13; WT: BI6727, n = 11; NLRP3-KO: Ctrl vehicle, n = 5; NLRP3-KO: BI6727, n = 7. (D and E) Representative histopathological images from lung tissues and quantification of lung parenchymal area (D), and representative immunofluorescence images of Gr1+ cell staining in lung tissue and quantification (E). WT: Ctrl vehicle, n = 7; WT: BI6727, n = 7; NLRP3-KO: Ctrl vehicle, n = 5; NLRP3-KO: BI6727 group, n = 5. (F and G) Representative histopathological images of the liver and quantitative results of immune cell infiltration (F), and representative immunofluorescence images of Gr1+ cells in liver and quantitative results (G). WT: Ctrl vehicle, n = 7; WT: BI6727, n = 7; NLRP3-KO: Ctrl vehicle, n = 5; KO: BI6727, n = 5. Scale bars: 50 μm. Two-way ANOVA with Šidák’s post hoc test was used for statistical analysis. All data are the mean ± SEM.
Figure 7
Figure 7. PLK1 kinase inhibition suppresses the inflammatory response in a MSU-induced peritonitis model.
C57BL/6 WT mice and NLRP3-KO mice were treated with BI6727 (1 mg/kg, i.v.) or control vehicle, followed by MSU (0.5 mg/mouse, i.p.). (A) Experimental scheme. Samples for cytokine measurement and flow cytometry were collected at the indicated time points. (B and C) IL-1β (B) and TNF-α (C) levels in peritoneal fluids. n = 6/group. (DH) Cells collected from the peritoneal cavity were analyzed by flow cytometry. Quantification of total number of immune cells (D), neutrophil cells (E), macrophages (F), B cells (G), and T cells (H). WT: Ctrl vehicle, n = 6; WT: BI6727, n = 6; NLRP3-KO: Ctrl vehicle, n = 5; NLRP3 KO: BI6727, n = 4. Statistical analysis was done by nonparametric test (B), unpaired t test (C), and 2-way ANOVA with Šidák’s post hoc test (DH). All data are the mean ± SEM.

References

    1. Martinon F, et al. Gout-associated uric acid crystals activate the NALP3 inflammasome. Nature. 2006;440(7081):237–241. doi: 10.1038/nature04516. - DOI - PubMed
    1. Strowig T, et al. Inflammasomes in health and disease. Nature. 2012;481(7381):278–286. doi: 10.1038/nature10759. - DOI - PubMed
    1. Duewell P, et al. NLRP3 inflammasomes are required for atherogenesis and activated by cholesterol crystals. Nature. 2010;464(7293):1357–1361. doi: 10.1038/nature08938. - DOI - PMC - PubMed
    1. Heneka MT, et al. NLRP3 is activated in Alzheimer’s disease and contributes to pathology in APP/PS1 mice. Nature. 2013;493(7434):674–678. doi: 10.1038/nature11729. - DOI - PMC - PubMed
    1. Jourdan T, et al. Activation of the Nlrp3 inflammasome in infiltrating macrophages by endocannabinoids mediates beta cell loss in type 2 diabetes. Nat Med. 2013;19(9):1132–1140. doi: 10.1038/nm.3265. - DOI - PMC - PubMed

Publication types

MeSH terms

Substances