. 2023 Dec 12;13(12):2532-2547.
doi: 10.1158/2159-8290.CD-23-0313.

Ultrasensitive Detection of Circulating LINE-1 ORF1p as a Specific Multicancer Biomarker

Affiliations

Ultrasensitive Detection of Circulating LINE-1 ORF1p as a Specific Multicancer Biomarker

Martin S Taylor et al. Cancer Discov. .

Erratum in

Abstract

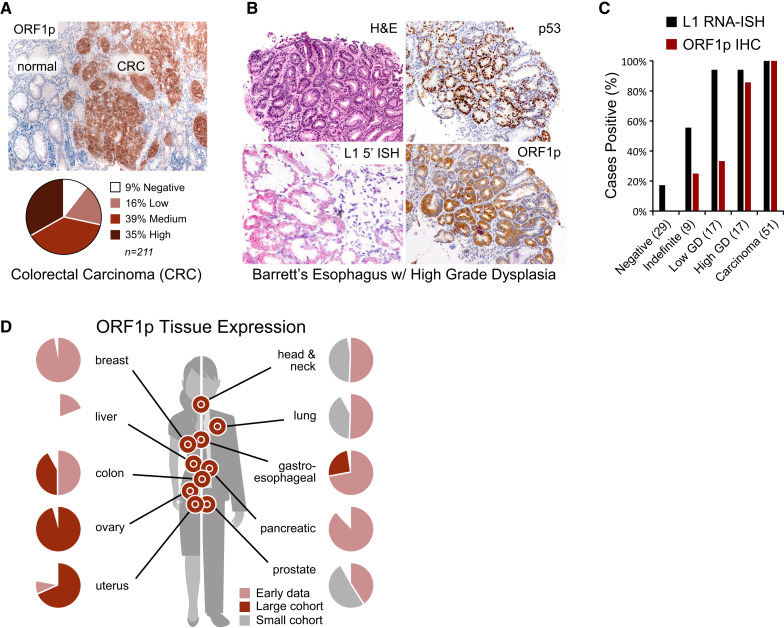
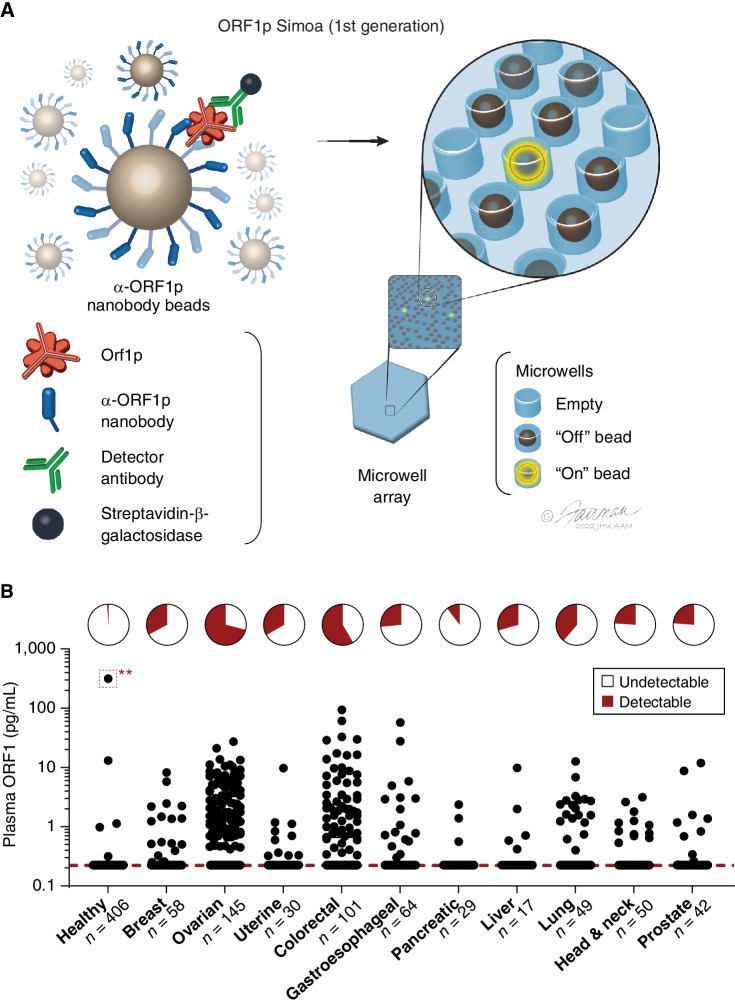
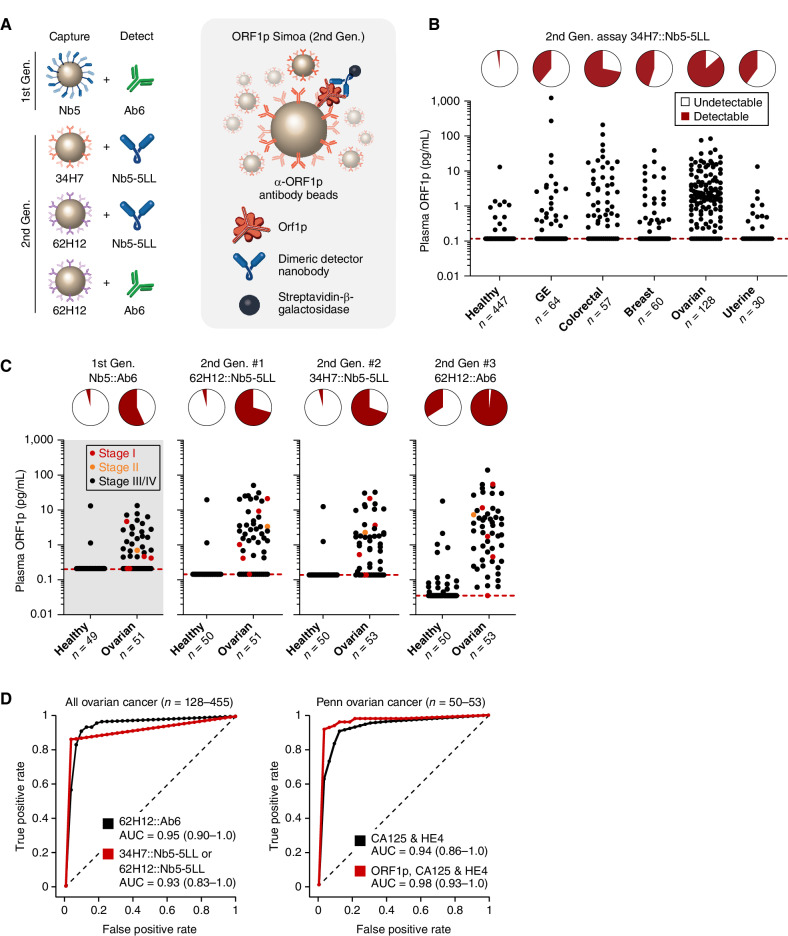
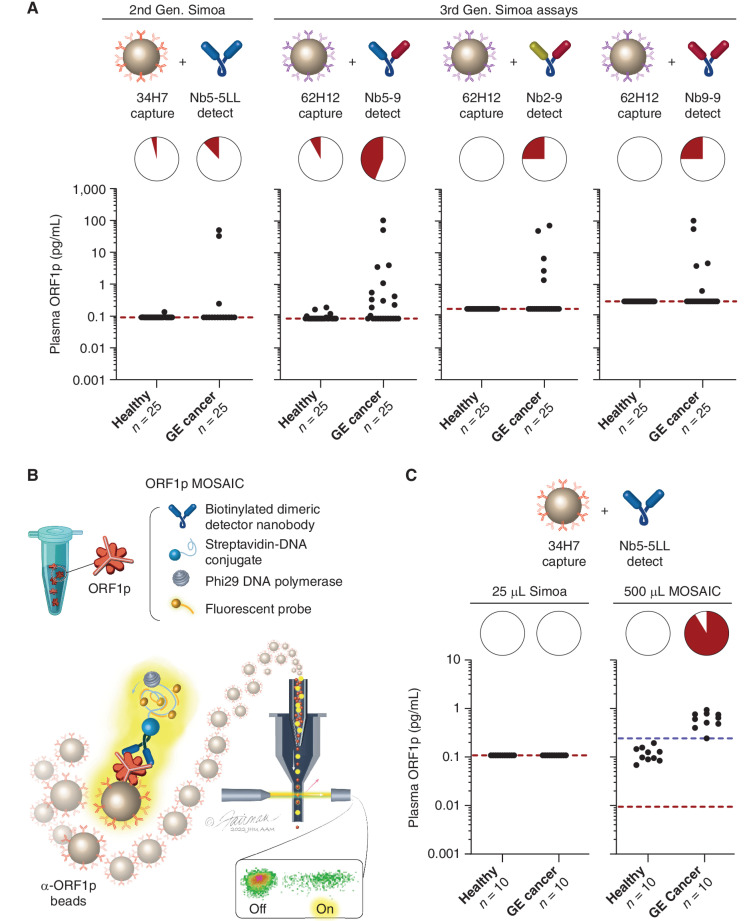
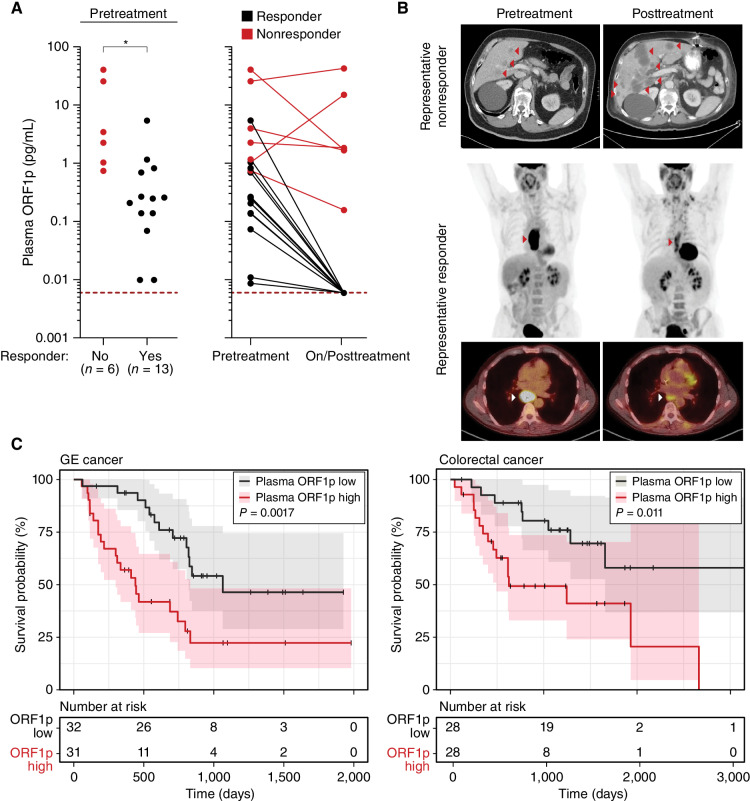
Improved biomarkers are needed for early cancer detection, risk stratification, treatment selection, and monitoring treatment response. Although proteins can be useful blood-based biomarkers, many have limited sensitivity or specificity for these applications. Long INterspersed Element-1 (LINE-1) open reading frame 1 protein (ORF1p) is a transposable element protein overexpressed in carcinomas and high-risk precursors during carcinogenesis with negligible expression in normal tissues, suggesting ORF1p could be a highly specific cancer biomarker. To explore ORF1p as a blood-based biomarker, we engineered ultrasensitive digital immunoassays that detect mid-attomolar (10-17 mol/L) ORF1p concentrations in plasma across multiple cancers with high specificity. Plasma ORF1p shows promise for early detection of ovarian cancer, improves diagnostic performance in a multianalyte panel, provides early therapeutic response monitoring in gastroesophageal cancers, and is prognostic for overall survival in gastroesophageal and colorectal cancers. Together, these observations nominate ORF1p as a multicancer biomarker with potential utility for disease detection and monitoring.

Significance: The LINE-1 ORF1p transposon protein is pervasively expressed in many cancers and is a highly specific biomarker of multiple common, lethal carcinomas and their high-risk precursors in tissue and blood. Ultrasensitive ORF1p assays from as little as 25 μL plasma are novel, rapid, cost-effective tools in cancer detection and monitoring. See related commentary by Doucet and Cristofari, p. 2502. This article is featured in Selected Articles from This Issue, p. 2489.


Figures

Figure 1. ORF1p expression is early and pervasive in carcinomas. A, ORF1p immunostaining in a cohort of 211 colorectal cancers (CRC). B, Representative BE case: lesional cells overexpress p53, the L1 RNA, and ORF1p. H&E, hematoxylin and eosin; ISH, in situ hybridization. C, L1 RNA and ORF1p overexpression across a cohort of 72 consensus BE cases and 51 carcinomas. GD, grade dysplasia. D, Summary overview of current data on ORF1p tissue expression in carcinomas (by IHC); early data are from Rodić et al. (8), large cohort colon and gastroesophageal and small cohorts (n < 30) are from this study, and large cohort ovarian and uterine are from Pisanic et al. (15) and Xia et al. (24). Large and small cohort ovarian data both showed >90% expression of ORF1p.
Figure 1.
ORF1p expression is early and pervasive in carcinomas. A, ORF1p immunostaining in a cohort of 211 colorectal cancers (CRC). B, Representative BE case: lesional cells overexpress p53, the L1 RNA, and ORF1p. H&E, hematoxylin and eosin; ISH, in situ hybridization. C, L1 RNA and ORF1p overexpression across a cohort of 72 consensus BE cases and 51 carcinomas. GD, grade dysplasia. D, Summary overview of current data on ORF1p tissue expression in carcinomas (by IHC); early data are from Rodić et al. (8), large cohort colon and gastroesophageal and small cohorts (n < 30) are from this study, and large cohort ovarian and uterine are from Pisanic et al. (15) and Xia et al. (24). Large and small cohort ovarian data both showed >90% expression of ORF1p.
Figure 2. Highly specific detection of carcinomas with the first-generation ORF1p Simoa assay. A, Schematic of single-molecule protein detection by Simoa; a first-generation assay is shown. Antibody/nanobody-coated magnetic beads, present in excess relative to target, capture single target ORF1p molecules; in the first-generation assay, beads are conjugated with α-ORF1p capture nanobody 5 (Nb5). Enzyme-labeled α-ORF1p detection reagent (here, an antibody, Ab6) is added, forming an “immunosandwich,” beads are loaded into microwells that each can hold at most one bead, and ORF1p molecules are then digitally detected using a fluorogenic substrate by counting “on” wells. Illustration: Jennifer E. Fairman, CMI, FAMI. © 2023 Johns Hopkins University, AAM. B, First-generation ORF1p Simoa detects plasma ORF1p with high specificity across major carcinomas. Pie charts indicate the percentage of samples with detectable levels; dashed red line, limit of detection. **, This patient was thought to be “healthy” at the time of blood donation but was six months later found to have prostate cancer and 19 months later found to have lymphoma. (Illustration: Jennifer E. Fairman, CMI, FAMI, © 2023 JHU AAM Department of Art as Applied to Medicine, The Johns Hopkins University School of Medicine).
Figure 2.
Highly specific detection of carcinomas with the first-generation ORF1p Simoa assay. A, Schematic of single-molecule protein detection by Simoa; a first-generation assay is shown. Antibody/nanobody-coated magnetic beads, present in excess relative to target, capture single target ORF1p molecules; in the first-generation assay, beads are conjugated with α-ORF1p capture nanobody 5 (Nb5). Enzyme-labeled α-ORF1p detection reagent (here, an antibody, Ab6) is added, forming an “immunosandwich,” beads are loaded into microwells that each can hold at most one bead, and ORF1p molecules are then digitally detected using a fluorogenic substrate by counting “on” wells. Illustration: Jennifer E. Fairman, CMI, FAMI. © 2023 Johns Hopkins University, AAM. B, First-generation ORF1p Simoa detects plasma ORF1p with high specificity across major carcinomas. Pie charts indicate the percentage of samples with detectable levels; dashed red line, limit of detection. **, This patient was thought to be “healthy” at the time of blood donation but was six months later found to have prostate cancer and 19 months later found to have lymphoma. (Illustration: Jennifer E. Fairman, CMI, FAMI, © 2023 JHU AAM Department of Art as Applied to Medicine, The Johns Hopkins University School of Medicine).
Figure 3. Improved detection of ORF1p with second-generation (Gen.) assays. A, Schematic of affinity reagents used. 34H7 and 62H2 are custom mAbs; Nb5-5LL is an engineered homodimeric nanobody. B, 34H7::Nb5-5LL second-generation assay measurements across a multicancer cohort. GE, gastroesophageal. C, Ovarian cancer patients with age- and gender-matched controls in first- and second-generation assays; patients are a subset of those in 3b; red dots, stage I disease; orange dots, stage II disease. D, ROC curves with single-marker ORF1p across all healthy and ovarian cancer patients (top, n = 128–132 cancer, 447–455 healthy), and multivariate models for ovarian (bottom, n = 51–53 cancer, 50 healthy).
Figure 3.
Improved detection of ORF1p with second-generation (Gen.) assays. A, Schematic of affinity reagents used. 34H7 and 62H2 are custom mAbs; Nb5-5LL is an engineered homodimeric nanobody. B, 34H7::Nb5-5LL second-generation assay measurements across a multicancer cohort. GE, gastroesophageal. C, Ovarian cancer patients with age- and gender-matched controls in first- and second-generation assays; patients are a subset of those in 3b; red dots, stage I disease; orange dots, stage II disease. D, ROC curves with single-marker ORF1p across all healthy and ovarian cancer patients (top, n = 128–132 cancer, 447–455 healthy), and multivariate models for ovarian (bottom, n = 51–53 cancer, 50 healthy).
Figure 4. Targeted proteomics measurements of plasma ORF1p from large sample volumes. A, ORF1p measured from two gastric cancer patients using two quantotypic peptides (LSFISEGEIK and NLEECIR, red traces) with internal isotopically labeled standards (blue traces); a high-ORF1p cancer patient [1,231 pg/mL by Simoa, 3.5 mL plasma used for immunoprecipitation (IP)] and high-ORF1p healthy patient (3.0 pg/mL by Simoa, 5 mL plasma used for IP) are shown with 900 amol standard injected. B, Correlation between measured ORF1p by Simoa and targeted proteomics assays; r = 0.97 (Simoa vs. LSFISEGEIK) and r = 0.99 (Simoa vs. NLEECIR, t test), P < 0.0001 for both.
Figure 4.
Targeted proteomics measurements of plasma ORF1p from large sample volumes. A, ORF1p measured from two gastric cancer patients using two quantotypic peptides (LSFISEGEIK and NLEECIR, red traces) with internal isotopically labeled standards (blue traces); a high-ORF1p cancer patient [1,231 pg/mL by Simoa, 3.5 mL plasma used for immunoprecipitation (IP)] and high-ORF1p healthy patient (3.0 pg/mL by Simoa, 5 mL plasma used for IP) are shown with 900 amol standard injected. B, Correlation between measured ORF1p by Simoa and targeted proteomics assays; r = 0.97 (Simoa vs. LSFISEGEIK) and r = 0.99 (Simoa vs. NLEECIR, t test), P < 0.0001 for both.
Figure 5. Improved detection of ORF1p with third-generation Simoa assays and with MOSAIC assays. A, Comparison of second- and third-generation Simoa assays (25 μL) in 25 mostly undetectable GE cancer and healthy control patients. B, Schematic of MOSAIC assays. Captured single-molecule “immunosandwiches” are formed analogously to Simoa assays. DNA-conjugated streptavidin enables rolling circle amplification to be carried out, generating a strong local fluorescent signal on the bead surface, and then “on” and “off” beads are quantified by flow cytometry, allowing efficient sampling of larger numbers of capture beads. This results in improved sensitivity and multiplexing capabilities. Illustration: Jennifer E. Fairman, CMI, FAMI. © 2023 Johns Hopkins University, AAM. C, 37H7::Nb5-5LL MOSAIC and Simoa assays in 10 previously undetectable GE cancer and healthy control patients. Red dashed lines indicate the analytical limit of detection for recombinant ORF1p in the buffer. Blue dashed line in C indicates plasma-specific background in large-volume MOSAIC assays, which is used to determine positivity in the pie charts.
Figure 5.
Improved detection of ORF1p with third-generation Simoa assays and with MOSAIC assays. A, Comparison of second- and third-generation Simoa assays (25 μL) in 25 mostly undetectable GE cancer and healthy control patients. B, Schematic of MOSAIC assays. Captured single-molecule “immunosandwiches” are formed analogously to Simoa assays. DNA-conjugated streptavidin enables rolling circle amplification to be carried out, generating a strong local fluorescent signal on the bead surface, and then “on” and “off” beads are quantified by flow cytometry, allowing efficient sampling of larger numbers of capture beads. This results in improved sensitivity and multiplexing capabilities. Illustration: Jennifer E. Fairman, CMI, FAMI. © 2023 Johns Hopkins University, AAM. C, 37H7::Nb5-5LL MOSAIC and Simoa assays in 10 previously undetectable GE cancer and healthy control patients. Red dashed lines indicate the analytical limit of detection for recombinant ORF1p in the buffer. Blue dashed line in C indicates plasma-specific background in large-volume MOSAIC assays, which is used to determine positivity in the pie charts.
Figure 6. ORF1p is an early predictor of response in 19 GE patients undergoing chemo/chemoradiotherapy and is prognostic in GE and colorectal cancers (CRC). Responders and nonresponders were characterized retrospectively by medical oncologists blinded to the assay results by post-therapy and presurgery imaging. A, Plasma ORF1p as measured by all three second-generation Simoa assays before and during/posttreatment; left, nonresponders have higher pretreatment ORF1p than responders (P = 0.02, t test); right, ORF1p pretherapy and on/posttherapy classifies responders and nonresponders; P < 0.0001, Fisher exact test. B, Representative CT and PET-CT from patients in the cohort. The representative nonresponder has the second-highest plasma ORF1p pretreatment (25.8 pg/mL), which increased to 43.0 pg/mL at day 28 of FOLFOX therapy (47 days after diagnosis), concomitant with increased sizes and number of hepatic metastases seen on CT at day 61. The representative responder has the fourth-highest plasma ORF1p value in the cohort of responders (0.83 pg/mL), which decreased to undetectable at day 26 of CROSS therapy (48 days after diagnosis); the displayed PET-CT is 59 days after initiation of therapy, 31 days after the second ORF1p measurement. C, Kaplan–Meier survival analysis of patients categorized as plasma ORF1p-high and ORF1p-low based on the median plasma ORF1p assay value shows significantly longer survival for ORF1p-low patients with GE (stages III–IV, P = 0.0017, log-rank test) and colorectal cancer (all stage IV, P = 0.011, log-rank test). Shaded regions represent 95% confidence intervals.
Figure 6.
ORF1p is an early predictor of response in 19 GE patients undergoing chemo/chemoradiotherapy and is prognostic in GE and colorectal cancers (CRC). Responders and nonresponders were characterized retrospectively by medical oncologists blinded to the assay results by post-therapy and presurgery imaging. A, Plasma ORF1p as measured by all three second-generation Simoa assays before and during/posttreatment; left, nonresponders have higher pretreatment ORF1p than responders (P = 0.02, t test); right, ORF1p pretherapy and on/posttherapy classifies responders and nonresponders; P < 0.0001, Fisher exact test. B, Representative CT and PET-CT from patients in the cohort. The representative nonresponder has the second-highest plasma ORF1p pretreatment (25.8 pg/mL), which increased to 43.0 pg/mL at day 28 of FOLFOX therapy (47 days after diagnosis), concomitant with increased sizes and number of hepatic metastases seen on CT at day 61. The representative responder has the fourth-highest plasma ORF1p value in the cohort of responders (0.83 pg/mL), which decreased to undetectable at day 26 of CROSS therapy (48 days after diagnosis); the displayed PET-CT is 59 days after initiation of therapy, 31 days after the second ORF1p measurement. C, Kaplan–Meier survival analysis of patients categorized as plasma ORF1p-high and ORF1p-low based on the median plasma ORF1p assay value shows significantly longer survival for ORF1p-low patients with GE (stages III–IV, P = 0.0017, log-rank test) and colorectal cancer (all stage IV, P = 0.011, log-rank test). Shaded regions represent 95% confidence intervals.

Update of

  • Ultrasensitive detection of circulating LINE-1 ORF1p as a specific multi-cancer biomarker.
    Taylor MS, Connie W, Fridy PC, Zhang SJ, Senussi Y, Wolters JC, Cheng WC, Heaps J, Miller BD, Mori K, Cohen L, Jiang H, Molloy KR, Norden BL, Chait BT, Goggins M, Bhan I, Franses JW, Yang X, Taplin ME, Wang X, Christiani DC, Johnson BE, Meyerson M, Uppaluri R, Egloff AM, Denault EN, Spring LM, Wang TL, Shih IM, Jung E, Arora KS, Zukerberg LR, Yilmaz OH, Chi G, Matulonis UA, Song Y, Nieman L, Parikh AR, Strickland M, Corcoran RB, Mustelin T, Eng G, Yilmaz ÃH, Skates SJ, Rueda BR, Drapkin R, Klempner SJ, Deshpande V, Ting DT, Rout MP, LaCava J, Walt DR, Burns KH. Taylor MS, et al. bioRxiv [Preprint]. 2023 Mar 17:2023.01.25.525462. doi: 10.1101/2023.01.25.525462. bioRxiv. 2023. Update in: Cancer Discov. 2023 Dec 12;13(12):2532-2547. doi: 10.1158/2159-8290.CD-23-0313. PMID: 36747644 Free PMC article. Updated. Preprint.

References

    1. Siegel RL, Miller KD, Fuchs HE, Jemal A. Cancer statistics, 2022. CA Cancer J Clin 2022;72:7–33. - PubMed
    1. Sawyers CL. The cancer biomarker problem. Nature 2008;452:548–52. - PubMed
    1. Crosby D, Bhatia S, Brindle KM, Coussens LM, Dive C, Emberton M, et al. Early detection of cancer. Science 2022;375:eaay9040. - PubMed
    1. Ignjatovic V, Geyer PE, Palaniappan KK, Chaaban JE, Omenn GS, Baker MS, et al. Mass spectrometry-based plasma proteomics: considerations from sample collection to achieving translational data. J Proteome Res 2019;18:4085–97. - PMC - PubMed
    1. Jamshidi A, Liu MC, Klein EA, Venn O, Hubbell E, Beausang JF, et al. Evaluation of cell-free DNA approaches for multi-cancer early detection. Cancer Cell 2022;40:1537–49. - PubMed