. 2023 Sep 12;21(9):e3002275.
doi: 10.1371/journal.pbio.3002275. eCollection 2023 Sep.

Taxane chemotherapy induces stromal injury that leads to breast cancer dormancy escape

Affiliations

Taxane chemotherapy induces stromal injury that leads to breast cancer dormancy escape

Ramya Ganesan et al. PLoS Biol. .

Abstract

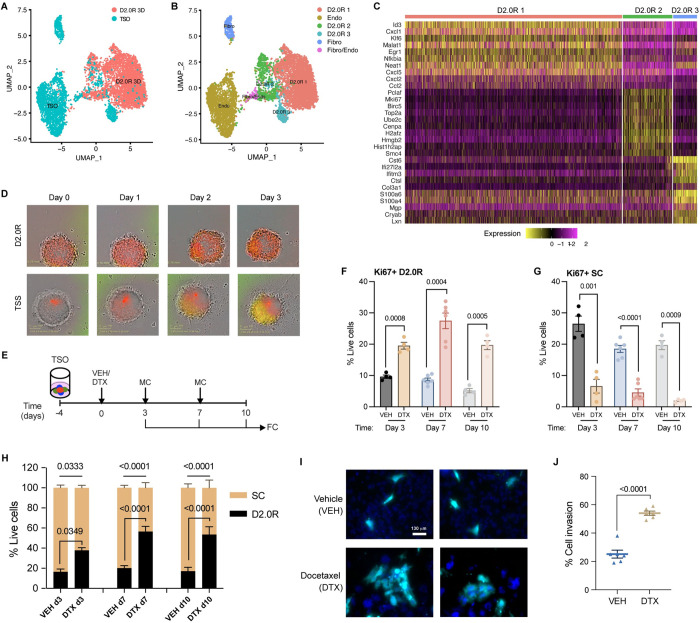
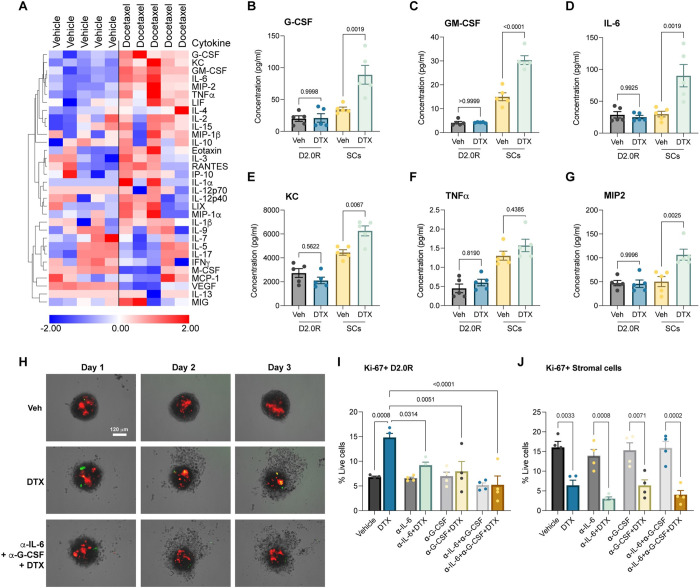
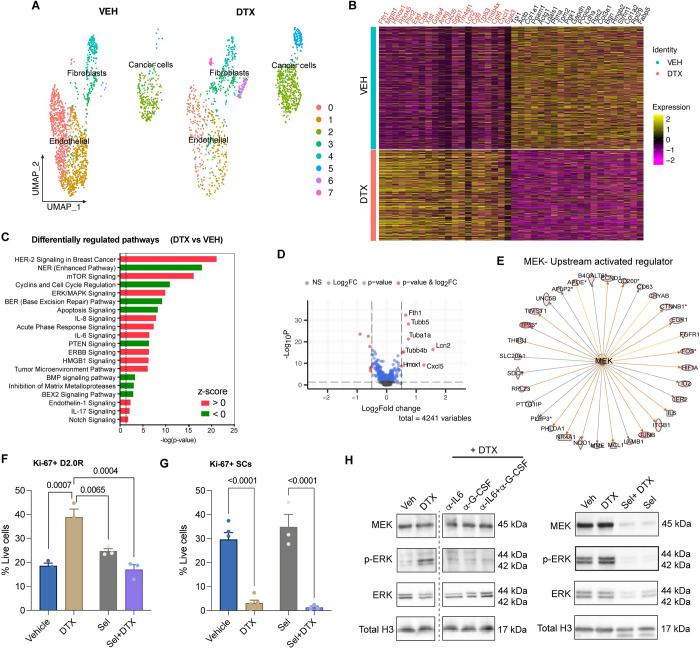
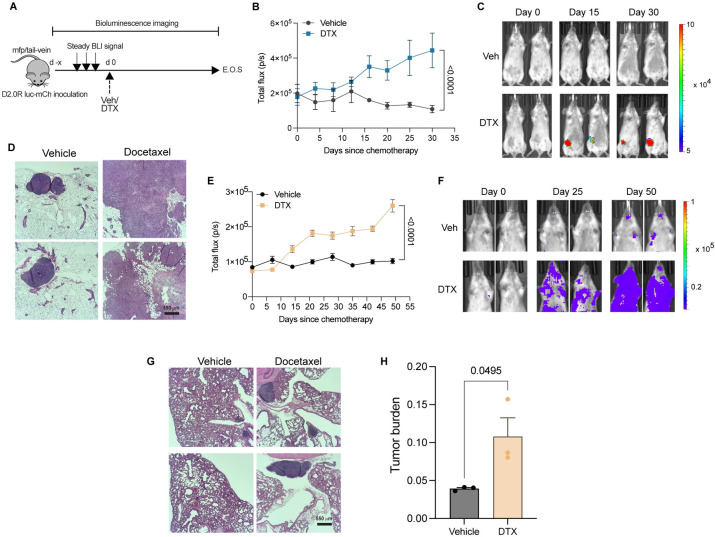
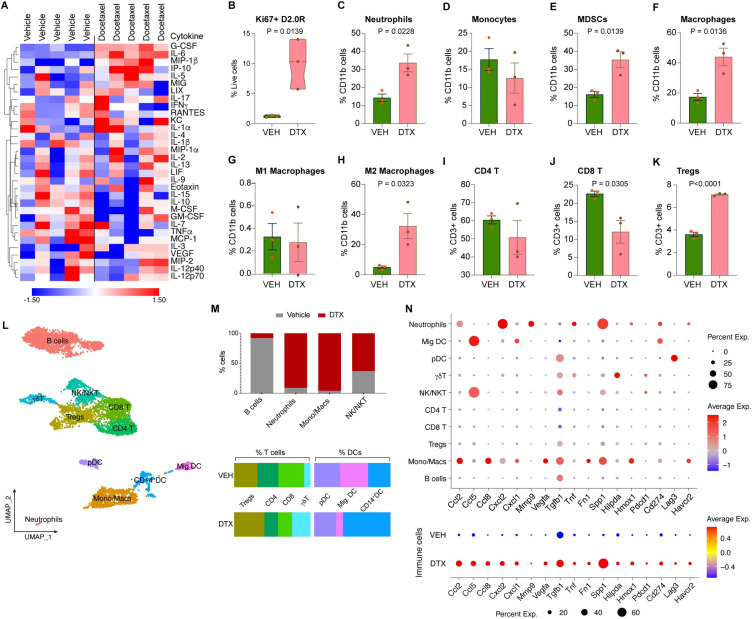
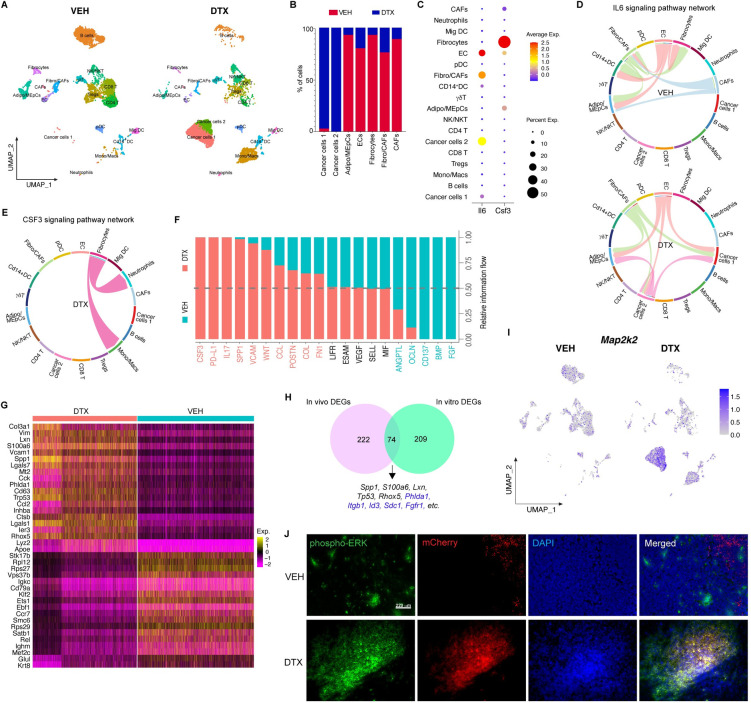
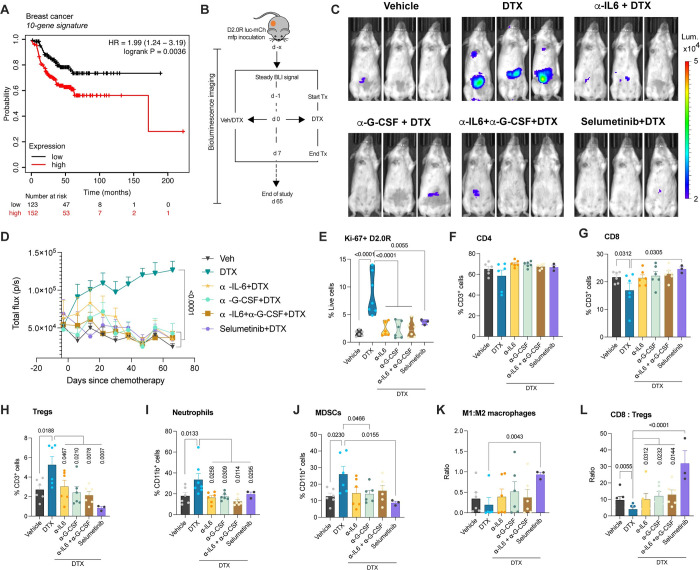
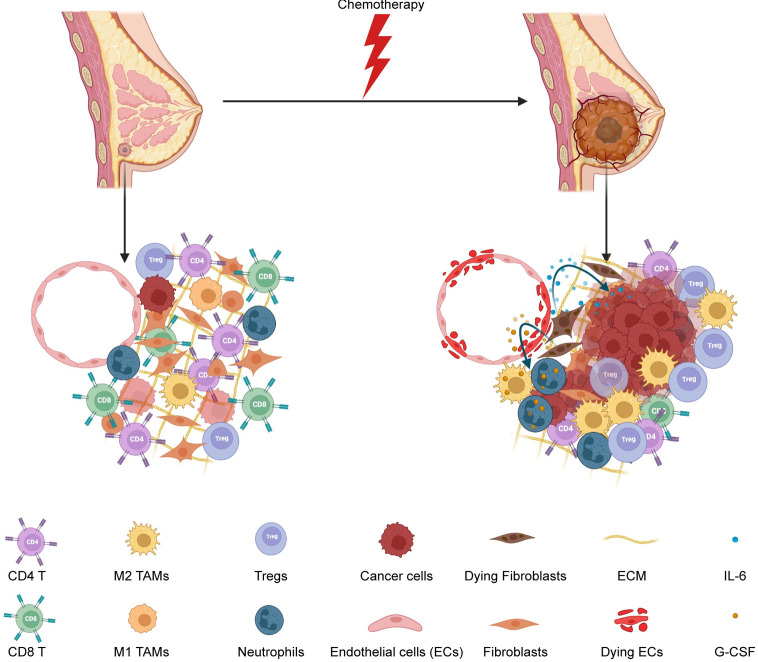
A major cause of cancer recurrence following chemotherapy is cancer dormancy escape. Taxane-based chemotherapy is standard of care in breast cancer treatment aimed at killing proliferating cancer cells. Here, we demonstrate that docetaxel injures stromal cells, which release protumor cytokines, IL-6 and granulocyte colony stimulating factor (G-CSF), that in turn invoke dormant cancer outgrowth both in vitro and in vivo. Single-cell transcriptomics shows a reprogramming of awakened cancer cells including several survival cues such as stemness, chemoresistance in a tumor stromal organoid (TSO) model, as well as an altered tumor microenvironment (TME) with augmented protumor immune signaling in a syngeneic mouse breast cancer model. IL-6 plays a role in cancer cell proliferation, whereas G-CSF mediates tumor immunosuppression. Pathways and differential expression analyses confirmed MEK as the key regulatory molecule in cancer cell outgrowth and survival. Antibody targeting of protumor cytokines (IL-6, G-CSF) or inhibition of cytokine signaling via MEK/ERK pathway using selumetinib prior to docetaxel treatment prevented cancer dormancy outgrowth suggesting a novel therapeutic strategy to prevent cancer recurrence.


Conflict of interest statement

I have read the journal’s policy and the authors of this manuscript have the following competing interests: VPS is on the SAB of BERG pharma and holds equity in Aggamin. MKB is in the SAB of Canomiks Inc and Anxomics LLC. SSB is a co-founder of Anxomics LLC. None of these companies are currently working in the cancer dormancy space.

Figures

Fig 1
Fig 1. Docetaxel invokes dormancy outbreak in TSO and promotes invasion.
(A) UMAP presentation of monotypic 3D culture (D2.0R 3D) (n = 24) and TSOs (n = 24) from scRNA-SEQ analysis. (B) UMAP presentation of major cell type clusters from scRNA-SEQ analysis in a merged dataset. (C) Heatmap showing the top 10 DEGs in each of the cancer cell clusters in a merged dataset. (D) Representative FUCCI reporter images of cancer spheroids (D2.0R) and TSSs (D2.0R-FUCCI: Endothelial cells (ECs): Fibroblasts (Fibro)) upon docetaxel treatment (n = 3); scale 360 μm2. (E) Experimental design used to test the effects of chemotherapy on TSOs; VEH—Vehicle, DTX—Docetaxel, MC—Media change, FC—Flow cytometry. (F, G) Expression (%) of Ki67 in (F) cancer cells (D2.0Rs) and (G) stromal cells (ECs and Fibroblasts) in TSO upon docetaxel (DTX) treatment compared with vehicle treated control on days 3 (n = 4), 7 (n = 6), and 10 (n = 4) from the start of treatment. Independent t test measurement shows statistical significance between treatment groups. (H) Stacked bar graph showing percentage of cancer cells and stromal cells out of total live cells in vehicle and docetaxel-treated TSO on days 3 (n = 4), 7 (n = 6), and 10 (n = 4). Independent t test measurement shows statistical significance between treatment groups. (I) Representative images of CellTracker Deep Red dye labeled cancer cells (cyan) that invaded through the Matrigel upon vehicle or docetaxel treatment with DAPI (blue) staining for nuclei. (J) Quantification of total number of cancer cells (cyan) invaded through the matrix relative to total cells added per well (%), n = 3 independent experiments in duplicates. Independent t test measurement shows statistical significance between treatment groups. Flow gating strategy for this figure can be found in S1 Fig and raw flow cytometry data is available on Flow repository (FR-FCM-Z6HQ). scRNA-seq source data is available on GEO (accession # GSE231350). Source data and source code can be found in S1 Data and S1 Code, respectively. DTX, docetaxel; FUCCI, fluorescence ubiquitination cell cycle indicator; scRNA-seq, single-cell RNA sequencing, TSO, tumor stromal organoid; TSS, tumor stromal spheroid; UMAP, Uniform Manifold Approximation and Projection.
Fig 2
Fig 2. Multiplex secretory protein analysis shows chemotherapy injures stromal cells releasing proinflammatory mediators that invoke cancer dormancy awakening.
(A) 32-plex cytokine analysis of TSO culture supernatant upon vehicle or docetaxel treatment (n = 5). (B–G) Concentrations of G-CSF (B), GM-CSF (C), IL-6 (D), KC (E), TNFα (F), MIP2 (G) in culture supernatants of cancer spheroids or stromal spheroids treated with vehicle or docetaxel (n = 5, each). One-way ANOVA measurement with post hoc Tukey’s multiple comparison test for flow cytometric analysis shows statistical significance between respective treatment groups. (H) Representative FUCCI reporter images of TSSs (D2.0R: ECs: Fibro) upon vehicle (Veh), docetaxel (DTX), or cytokine blockade with docetaxel treatment (anti-IL-6+anti-G-CSF+DTX) (n = 3); scale, 120 μm. (I, J) Expression (%) of Ki67 in (I) D2.0Rs and (J) stromal cells in TSO upon docetaxel treatment compared to vehicle treated control or cytokine blockade with or without docetaxel treatment (n = 4), with 6 replicated per experiment. One-way ANOVA measurement with post hoc Dunnett’s multiple comparison test for flow cytometric analysis shows statistical significance between respective treatment groups. Source data can be found in S1 Data. DTX, docetaxel; FUCCI, fluorescence ubiquitination cell cycle indicator; G-CSF, granulocyte colony stimulating factor; TSO, tumor stromal organoid; TSS, tumor stromal spheroid.
Fig 3
Fig 3. Single-cell transcriptomics revealed MEK signaling in docetaxel-mediated dormancy awakening.
(A) UMAP presentation of major cell type clusters from scRNA-SEQ analysis of vehicle (VEH) (n = 24) and docetaxel (DTX) (n = 36) treated TSOs. (B) Heatmap showing top 20 enriched genes in DTX and VEH datasets, respectively. (C) Pathways enrichment upon docetaxel treatment compared with vehicle controls based on 1,600 differentially expressed genes. Significance for enrichment is calculated based on Fisher’s exact test for each pathway are indicated on the x-axis (-log p-value). Color red or green indicates positive or negative z-score, respectively. (D) Volcano plot showing significantly differentially expressed protein-coding genes in cancer cells (D2.0R) based on RNA-seq of TSOs from docetaxel treated compared with vehicle-treated controls. Transcripts with absolute FC > 0.5 and adjusted P-value < 0.05 are highlighted in red. (E) Targets of MEK enriched in cancer cells. Colored lines indicate relationships between nodes, with orange lines showing enhancement and gold lines showing inhibition of a DEG by MEK. (F, G) Flow cytometric analysis of proliferating (Ki67+) cancer cells (G) and stromal cells (H) upon vehicle (n = 5), DTX (n = 5), selumetinib (n = 3) +/- docetaxel (n = 3) treatments. One-way ANOVA measurement with post hoc Dunnett’s multiple comparison test for flow cytometric analysis shows statistical significance between respective treatment groups. (H) Representative western blot images showing MEK, p-ERK, ERK, and Total H3 (loading control). Raw blot images can be found in S2 Raw Image. scRNA-seq source data is available on GEO (accession # GSE231350). Source data and source code can be found in S1 Data and S1 Code, respectively. DTX, docetaxel; scRNA-seq, single-cell RNA sequencing, TSO, tumor stromal organoid; UMAP, Uniform Manifold Approximation and Projection.
Fig 4
Fig 4. In vivo breast cancer dormancy and docetaxel-mediated dormancy outgrowth.
(A) Schematic showing mouse model of primary (breast) or metastatic (lung) dormancy by injection of D2.0R luc-mCherry cells in the fourth right inguinal mfp or tail-vein, respectively; days since chemotherapy (d), docetaxel 8 mg/kg (DTX), end of study (E.O.S.), and vehicle (Veh). (B, C) Bioluminescence flux kinetics (B) and representative BLI images (C) of D2.0R luc-mCherry tumor growth in the mfp of mice in docetaxel-treated group (n = 9) compared with vehicle-treated controls (n = 7). Two-way mixed ANOVA with post hoc Dunnett’s multiple comparisons test shows statistical significance between treatment groups. (D) Representative gross images of mfps (fourth right inguinal), HE staining are shown from vehicle and docetaxel-treated mice; scale bars, 550 μm. (E, F) Bioluminescence flux kinetics (E) and representative BLI images (F) of D2.0R luc-mCherry tumor growth in the lungs of mice in docetaxel-treated group (n = 5) compared with vehicle-treated controls (n = 4). Two-way mixed ANOVA with post hoc Dunnett’s multiple comparisons test shows statistical significance between treatment groups. (G, H) Representative gross images of mouse lungs (G), HE staining, and tumor burden quantification (H) are shown from vehicle and docetaxel-treated mice; scale bars, 550 μm. Independent t test measurement shows statistical significance between treatment groups. Source data can be found in S1 Data. DTX, docetaxel; HE, hematoxylin and eosin; mfp, mammary fat pad.
Fig 5
Fig 5. Chemotherapy induced systemic response and altered tumor immune landscape assessment using single-cell transcriptomics, secretory protein, and flow cytometry analyses.
(A) 32-plex cytokine analysis of plasma from mice subject to vehicle or docetaxel treatment (n = 5). (B) Expression (%) of Ki67 in D2.0Rs in the mammary tumor tissue of DTX compared to VEH-treated mice. (C–K) Flow cytometric analysis showing tumor immune infiltrates including (C) neutrophils, (D) monocytes, (E) MDSCs, (F) total macrophages, (G) M1 macrophages, (H) M2 macrophages, (I) CD4 T cells, (J) CD8 T cells, and (K) Tregs comparing DTX treatment with VEH control (n = 3, each). Independent t test measurement shows statistical significance between treatment groups. (L) UMAP showing immune cells in the tumor tissue of VEH and DTX datasets merged (n = 2, each). (M) Percentage of cells from VEH control and DTX-treated mice, per cluster for immune cells. (N) Dot plots of selected markers from merged samples (top) and grouped by treatment, VEH and DTX (bottom). Dot size indicates the proportion of cells in each cluster expressing a gene and color shading indicates the relative level of gene expression. Flow gating strategy for this figure can be found in S8 Fig and raw flow cytometry data is deposited on Flow repository (FR-FCM-Z6J8). scRNA-seq source data is available on GEO (accession # GSE231350). Source data and source code can be found in S1 Data and S1 Code, respectively. DTX, docetaxel; UMAP, Uniform Manifold Approximation and Projection.
Fig 6
Fig 6. Single-cell RNA sequencing analysis of mouse mammary tumors.
(A) Split UMAP presentation of major cell types and associated clusters in vehicle (VEH) and docetaxel (DTX)-treated murine mfp/tumor (n = 2, each treatment group). (B) Percentage of cells from vehicle control and docetaxel-treated mice, per cluster for cancer cells and non-immune stromal cells. (C) Dot plot showing cluster wise expression of Il6 (IL-6) and Csf3 (G-CSF) by clusters. (D) Chord connections between cell types shows Il6 signaling network in vehicle and docetaxel datasets, respectively. (E) Chord connections between cell types showing Csf3 signaling network in DTX dataset. (F) Quantitatively comparing the information flow of each signaling pathway between cells from VEH- and DTX-treated samples. The overall information flow of a signaling network is calculated by summarizing all the communication scores in that network. (G) Heatmap showing top 20 enriched genes between cells from DTX- and VEH-treated samples, respectively. (H) Venn showing cancer cluster DEGs in vivo (pink) and in vitro (turquoise) with overlapping genes at the intersection. (I) Split feature plot showing Map2k (MEK) expression in DTX- vs. VEH-treated samples. (J) Representative IF images of mfp tumor from VEH- and DTX-treated mice showing immunostaining of phospho-ERK (green), DR.0R-mCherry (red), and nuclei (DAPI); scale bar = 220 μm. scRNA-seq files are accessible on GEO with the accession number GSE231350. Source data and source code can be found in S1 Data and S1 Code, respectively. DTX, docetaxel; mfp, mammary fat pad; UMAP, Uniform Manifold Approximation and Projection.
Fig 7
Fig 7. Cytokine ablation and MEK inhibition prevent chemotherapy-induced breast cancer dormancy awakening in mice.
(A) Kaplan–Meier estimates of recurrence free survival based on a 10-gene signature in breast cancer patients who received chemotherapy. Relevant supporting data can be found in S7 Fig. (B) Schematic showing mouse model primary (mfp) dormancy by injection of D2.0R luc-mCherry, treatment groups and schedule; days since chemotherapy (d), docetaxel 8 mg/kg (DTX), neutralizing antibody or MEK inhibitor treatment (Tx) and vehicle (Veh). (C, D) Representative bioluminescence images (C) and BLI flux kinetics (D) of D2.0R luc-mCherry tumor growth in the mfp of mice in DTX (n = 6), α-IL-6+DTX (n = 5), α-G-CSF+DTX (n = 5), α-IL-6+ α-G-CSF+DTX (n = 6), selumetinib+DTX (n = 6) compared with vehicle-treated controls (n = 6). Two-way mixed ANOVA analysis with post hoc Dunnett’s multiple comparisons test shows statistical significance between treatment groups. (E) Expression (%) of Ki67 on D2.0R luc-mCherry cells in mfp of mice from various treatment groups. One-way ANOVA measurement with post hoc Dunnett’s multiple comparisons test shows statistical significance between treatment groups. (F–J) Flow cytometric analysis showing percentage of CD4 (F), CD8 (G), Tregs (H), neutrophils (I), MDSCs (J) in the mfps/tumors of mice. Independent t test or one-way ANOVA measurement analysis with post hoc Dunnett’s multiple comparisons test shows statistical significance between treatment groups. (K, L) Ratio of M1:M2 macrophages and CD8:Tregs in the mfps/tumors of mice. Independent t test measurement shows statistical significance between treatment groups. Flow gating strategy for this figure can be found in S8 Fig and raw flow cytometry data is deposited on Flow repository (FR-FCM-Z6J8). Source data can be found in S1 Data file. DTX, docetaxel; mfp, mammary fat pad.
Fig 8
Fig 8. Summary schematic of chemotherapy induced stromal injury and dormancy outgrowth.
This schematic shows a dormant tumor in the breast (on the left) with very few dormant cancer cells, healthy stromal cells, and an anti-tumor immune microenvironment. Chemotherapy injures stromal cells releasing IL-6 and G-CSF, which in turn awaken dormant cancer cells, recruit protumor neutrophils, and M2 macrophages. In addition, more protumor immune infiltrates such as Tregs and fewer anti-tumor CD8 T cells were seen after dormancy outgrowth, confirming an overall protumor microenvironment facilitating tumor growth. G-CSF, granulocyte colony stimulating factor.

Comment in

References

    1. Fisher B, Anderson S, Fisher ER, Redmond C, Wickerham DL, Wolmark N, et al.. Significance of ipsilateral breast tumour recurrence after lumpectomy. Lancet. 1991;338(8763):327–331. doi: 10.1016/0140-6736(91)90475-5 - DOI - PubMed
    1. Retsky MW, Demicheli R, Hrushesky WJ, Baum M, Gukas ID. Dormancy and surgery-driven escape from dormancy help explain some clinical features of breast cancer. APMIS. 2008;116(7–8):730–741. doi: 10.1111/j.1600-0463.2008.00990.x - DOI - PubMed
    1. Panigrahy D, Gartung A, Yang J, Yang H, Gilligan MM, Sulciner ML, et al.. Preoperative stimulation of resolution and inflammation blockade eradicates micrometastases. J Clin Invest. 2019;129(7):2964–2979. doi: 10.1172/JCI127282 - DOI - PMC - PubMed
    1. Krall JA, Reinhardt F, Mercury OA, Pattabiraman DR, Brooks MW, Dougan M, et al.. The systemic response to surgery triggers the outgrowth of distant immune-controlled tumors in mouse models of dormancy. Sci Transl Med. 2018;10(436). doi: 10.1126/scitranslmed.aan3464 - DOI - PMC - PubMed
    1. Albrengues J, Shields MA, Ng D, Park CG, Ambrico A, Poindexter ME, et al.. Neutrophil extracellular traps produced during inflammation awaken dormant cancer cells in mice. Science. 2018;361(6409). doi: 10.1126/science.aao4227 - DOI - PMC - PubMed

Publication types