. 2023 Nov:67:102871.
doi: 10.1016/j.redox.2023.102871. Epub 2023 Sep 7.

Mesenchymal stem cell attenuates spinal cord injury by inhibiting mitochondrial quality control-associated neuronal ferroptosis

Affiliations

Mesenchymal stem cell attenuates spinal cord injury by inhibiting mitochondrial quality control-associated neuronal ferroptosis

Senyu Yao et al. Redox Biol. 2023 Nov.

Abstract

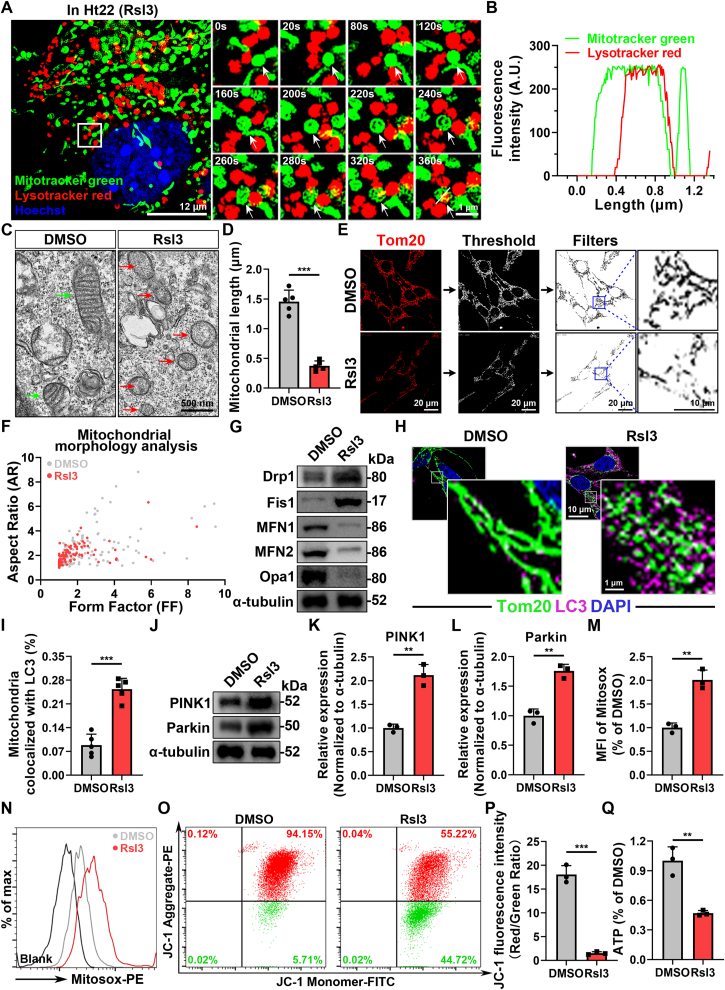
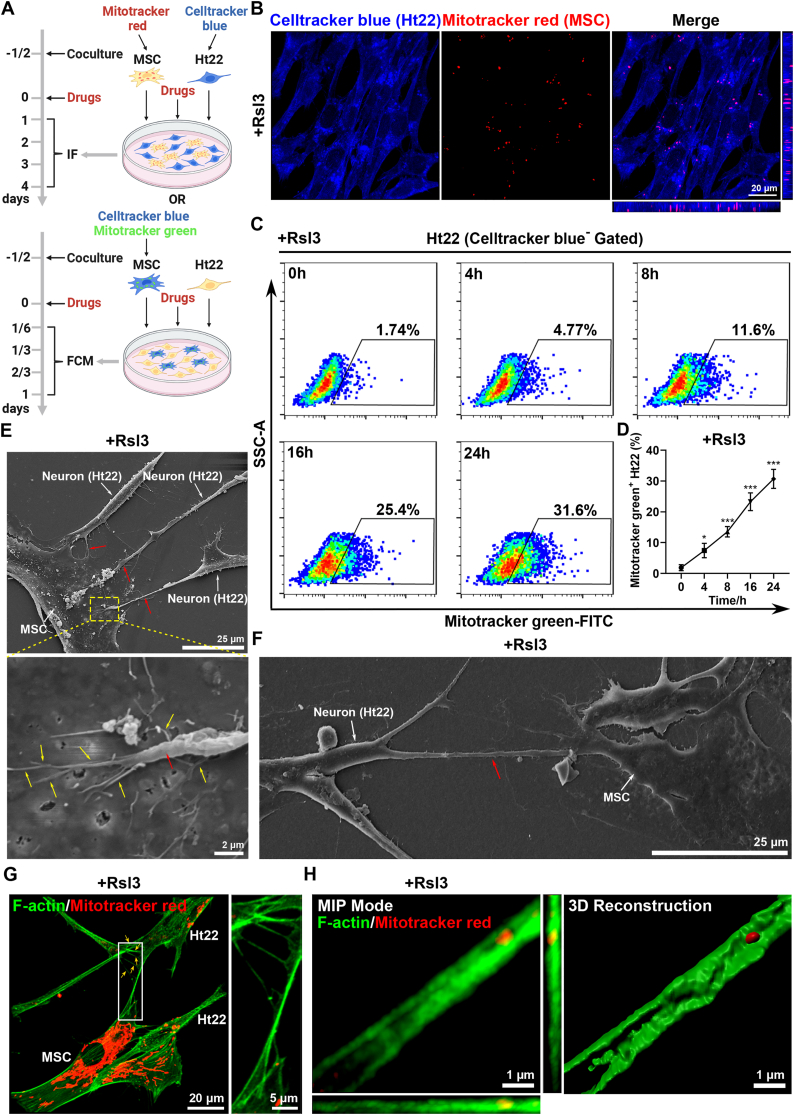
Ferroptosis is a newly discovered form of iron-dependent oxidative cell death and drives the loss of neurons in spinal cord injury (SCI). Mitochondrial damage is a critical contributor to neuronal death, while mitochondrial quality control (MQC) is an essential process for maintaining mitochondrial homeostasis to promote neuronal survival. However, the role of MQC in neuronal ferroptosis has not been clearly elucidated. Here, we further demonstrate that neurons primarily suffer from ferroptosis in SCI at the single-cell RNA sequencing level. Mechanistically, disordered MQC aggravates ferroptosis through excessive mitochondrial fission and mitophagy. Furthermore, mesenchymal stem cells (MSCs)-mediated mitochondrial transfer restores neuronal mitochondria pool and inhibits ferroptosis through mitochondrial fusion by intercellular tunneling nanotubes. Collectively, these results not only suggest that neuronal ferroptosis is regulated in an MQC-dependent manner, but also fulfill the molecular mechanism by which MSCs attenuate neuronal ferroptosis at the subcellular organelle level. More importantly, it provides a promising clinical translation strategy based on stem cell-mediated mitochondrial therapy for mitochondria-related central nervous system disorders.

Keywords: Intercellular mitochondrial transfer; Mesenchymal stem cells; Mitochondrial quality control; Neuronal ferroptosis; Spinal cord injury.


Conflict of interest statement

Declaration of competing interest The authors declare that they have no known competing financial interests or personal relationships that could have appeared to influence the work reported in this paper.

Figures

Image 1
Graphical abstract
Fig. 1
Fig. 1
Neurons exhibit ferroptosis after spinal cord injury. (A) Cell clusters of the sc-RNA-seq data from Li et al. in figshare with the identifier (https://doi.org/10.6084/m9.figshare.17702045). (B) UMAP plot of all cells of the scRNA-seq data in (A). (C) Quantitative analysis of the proportion of each cell in (B). (D) Representative Hematoxylin and eosin (H&E) and Nissl staining of spinal cord from mice induced by sham or crush injury surgery (1 day after SCI). Scale bar, 0.5 μm for original pictures and 100 μm for enlarged pictures. (E) Quantification for the numbers of Nissl per square milimeter (mm2) in (B). (n=6 biological repeats for each group; Unpaired t-test). (F) The GSEA of the hallmark gene sets in MSigDB database revealing the enrichment of response to oxidative stress, ferroptosis and regulation of lipid metabolic process GO terms in neurons. NES, normalized enrichment score. (G) The scatter plot of the ferroptosis-related genes in neurons. (H) The dot plot showing the differentially expressed genes in neurons between the uninjured and injured spinal cord. (I) Representative transmission electron microscope (TEM) images of neurons from mice induced by sham or crush injury surgery (1 day after SCI) in vivo. Red and green arrows indicate damaged and normal mitochondria respectively. Scale bar, 2 μm for original pictures and 0.5 μm for enlarged pictures. (J) Quantitative analysis of percentage of mitochondria with normal morphology in (I). (n = 8 biological repeats for Sham group and n=10 biological repeats for SCI group; Unpaired t-test). (K) Quantitative analysis of average value of mitochondrial length (micrometers, μm) in (D). (n = 8 biological repeats for Sham group and n=10 biological repeats for SCI group; Unpaired t-test). (L–M) Quantification of mean fluorescence intensity of ferroptosis-related markers in (N–O). (n = 6 biological repeats for each group; Unpaired t-test). (N–O) Representative confocal images of neurons, stained with ferroptosis-related markers, such as TFRC and 4-HNE, of spinal cord from mice induced by sham or crush injury surgery (1 day after SCI) in vivo. Neurons were marked by NeuN. Scale bar, 20 μm. Two-sided comparison; All data are mean ± SD; Error bars represent SDs; ***p < 0.001; See also Supplementary Figs. 1 and 2. (For interpretation of the references to colour in this figure legend, the reader is referred to the Web version of this article.)
Fig. 2
Fig. 2
Neurons exhibit disordered mitochondrial quality control during ferroptosis. (A) Representative super-resolution living cell tracing images of mitophagy in Ht22 cells after Rsl3 treatment for 12 h at different time points. Mitochondria were stained with Mitotracker green and Lysosome were stained with Lysotracker red. Corresponding video is provided as a Source Data file. Scale bar, 12 μm for original pictures and 1 μm for enlarged pictures. (B) Colocalization analysis of the fluorescence intensity of the white line area in (A). (C) Representative TEM images of the morphology of mitochondria in Ht22 cells after treated with DMSO or Rsl3 for 24 h. Red and green arrows indicate damaged and normal mitochondria respectively. Scale bar, 500 nm. (D) Quantitative analysis of average value of mitochondrial length (μm) in (C). (n=3 biological repeats for each group; N = 28–40 mitochondria; Unpaired t-test). (E) Representative immunostaining pictures of mitochondrial morphology of Ht22 cells after treated with DMSO or Rsl3 for 24 h. Mitochondrial outer membranes were marked by Tom20. Scale bar, 20 μm for original pictures and 10 μm for enlarged pictures. (F) A plot of Aspect Ratio (AR) against Form Factor (FF) shows that particles in (E). (G) Western Blot analysis of the proteins associated with mitochondrial fusion and fission in Ht22 cells after treated with DMSO or Rsl3 for 24 h. (H) Representative immunostaining pictures of mitophagy potential in Ht22 cells after treated with DMSO or Rsl3 for 24 h. Mitochondrial outer membranes were marked with Tom20 and autophagy was marked with LC3, respectively. Scale bar, 10 μm for original pictures and 1 μm for enlarged pictures. (I) Quantification of the average level of colocalization between mitochondria and LC3 in (H). (n=5 biological repeats for each group; Unpaired t-test). (J) Western Blot analysis of mitophagy related proteins, such as PINK1 and Parkin, in Ht22 cells after treated with DMSO or Rsl3 for 24 h. (K–L) Quantitative analysis of the expression of mitophagy related proteins, such as PINK1 and Parkin in (J). (n=3 biological repeats for each group; Unpaired t-test) (M−N) Flow cytometry and quantitative analysis of the mean fluorescence intensity of mitochondrial ROS level in Ht22 cells after treated with DMSO or Rsl3 for 24 h. Mitochondrial ROS was probed with Mitosox (PE channel), (n=3 biological repeats for each group; Unpaired t-test). (O) Flow cytometry analysis of mitochondrial membrane potential (MMP) probed with JC-1 in Ht22 cells after treated with DMSO or Rsl3 for 24 h. (P) Quantitative analysis of the ratio of JC-1 aggregates (referred to high MMP, PE channel) /JC-1 monomers (referred to low MMP, FITC channel) in (O). (n=3 biological repeats for each group; Unpaired t-test). (Q) Measurement of the intracellular ATP level in Ht22 cells after treated with DMSO or Rsl3 for 24 h (n=3 biological repeats for each group; Unpaired t-test) Two-sided comparison; All data are mean ± SD; Error bars represent SDs; **p < 0.01, ***p < 0.001; See also Supplementary Fig. 3. (For interpretation of the references to colour in this figure legend, the reader is referred to the Web version of this article.)
Fig. 3
Fig. 3
MSCs infuse functional mitochondria into ferroptotic neurons via TNT. (A) Schematic diagram of MSC-Ht22 coculture system. Flow cytometry (FCM) of Mitotracker green uptake by Ht22 cells cocultured with Celltracker blue-labeled MSCs after drugs were added for 0, 4, 8, 16 and 24h. Immunofluorescence (IF) of Celltracker blue-labeled Ht22 cells and Mitotracker red-labeled MSCs in a coculture system after drugs were added for 1, 2, 3 and 4 days. Drugs including Rsl3 (5 μM), 18-α-GA (50 μM), dynasore (50 μM) or cytochalasin D (200 nM) were used according to different experimental design. Created with BioRender.com. (B) Representative confocal microscopy images of MSC-derived mitochondria (Mitotracker red+) inside Ht22 cells (Celltracker blue+) at 1 day after treated with Rsl3. Scale bar, 20 μm. (C–D) Flow cytometry and quantitative analysis of percentage of Mitotracker green+ Ht22 cells (Celltracker blue Gated) from cocultured with Mitotracker green-labeled MSCs under Rsl3 stimulation for 0, 4, 8, 16 and 24h. (n=3 biological repeats for each group; Ordinary one-way ANOVA). (E–F) Representative scanning electron microscope (SEM) images of tunneling nanotubes (TNTs, red arrow) between neurons and MSCs. In (E), MSC interacts with multiple neurons through short TNTs. In (F), Left: MSC connects with a neuron through a long TNT. Right: magnified view shows the buds (yellow arrow) from the nanotube on the membrane of the MSC. Scale bar, 25 μm (E), 25 μm (F, Left) and 2 μm (F, Right). (G–H) Representative confocal images of TNTs between neurons and MSCs. In (G), a single TNT connects the MSC and the neuron with multiple branches (yellow arrow). Scale bar, 20 μm for original pictures and 5 μm for enlarged pictures. In (H), MIP mode and 3D reconstruction images of Mitotracker localization within F-actin filaments in the TNT. The mitochondria in MSCs were labeled with Mitotracker red. Rhodamine phalloidin 488 was used to label the F-actin filaments in all cells. Scale bar, 1 μm. Two-sided comparison; All data are mean ± SD; Error bars represent SDs; *p < 0.05, ***p < 0.001. See also Supplementary Fig. 4, 5 and 6. (For interpretation of the references to colour in this figure legend, the reader is referred to the Web version of this article.)
Fig. 4
Fig. 4
MSC-mediated mitochondrial transfer stabilizes mitochondrial quality control in ferroptotic neurons. (A) Flow cytometry analysis of mitochondrial activity in Ht22 cells from culture alone and coculture with MSCs, treated by DMSO or Rsl3 for 24 h. Mitochondria was stained with Mitotracker green (FITC channel). (B) Representative immunostaining pictures of fused mitochondria (yellow fluorescence) in Ht22 cells coculture with MSCs after Rsl3 stimulation for 24 h. MSCs were labeled with Mitotracker green and Ht22 cells were labeled with Mitotracker red. Scale bar, 5 μm for original pictures and 1 μm for enlarged pictures. (C) Representative transmission electron microscope (TEM) images of mitochondrial morphology in Ht22 cells from culture alone (Control) and coculture with MSCs (Coculture), treated by DMSO or Rsl3 for 24 h. Red and green arrows indicate damaged and normal mitochondria respectively. Scale bar, 500 nm. (D) Representative immunostaining pictures of mitophagy potential in Ht22 cells from culture alone and coculture with MSCs, treated by DMSO or Rsl3 for 24 h. Mitochondria are stained with Tom20 and autophagy is stained with LC3, respectively. Scale bar, 10 μm for original pictures and 1 μm for enlarged pictures. (E) Quantification of the average level of colocalization between mitochondria and LC3 in (D). (n=5 biological repeats for each group; n = 22, 24, 18 and 20 Ht22 cells for Control+DMSO, Coculture+DMSO, Control+Rsl3 and Coculture+Rsl3 group, respectively; Ordinary one-way ANOVA). (F) Western Blot analysis of mitophagy related proteins, such as PINK1 and Parkin, in Ht22 cells from culture alone and coculture with MSCs, treated by DMSO or Rsl3 for 24 h. (G) Flow cytometry analysis of mitochondrial membrane potential (MMP) probed with JC-1 in Ht22 cells from culture alone and coculture with MSCs, treated by DMSO or Rsl3 for 24 h. (H) Quantitative analysis of the ratio of JC-1 aggregates (referred to high MMP, PE channel) /JC-1 monomers (referred to low MMP, FITC channel) in (G). (n=3 biological repeats for each group; Ordinary one-way ANOVA). (I) Measurement of the intracellular ATP level in Ht22 cells from culture alone and coculture with MSCs, treated by DMSO or Rsl3 for 24 h (n=3 biological repeats for each group; Ordinary one-way ANOVA). (J) Flow cytometry analysis of mitochondrial ROS level in Ht22 cells from culture alone and coculture with MSCs, treated by DMSO or Rsl3 for 24 h. Mitochondrial ROS was probed with Mitosox (PE channel). (K) Quantitative analysis of the mean fluorescence intensity of Mitosox in (J). (n=3 biological repeats for each group; Ordinary one-way ANOVA). Two-sided comparison; All data are mean ± SD; Error bars represent SDs; *p < 0.05, **p < 0.01, ***p < 0.001; See also Supplementary Fig. 7. (For interpretation of the references to colour in this figure legend, the reader is referred to the Web version of this article.)
Fig. 5
Fig. 5
Inhibition of mitochondrial transfer impedes the recovery of mitochondrial quality control mediated by MSCs during neuronal ferroptosis. (A) Flow cytometry analysis of mitochondrial activity in Ht22 cells from culture alone, coculture with MSCs or MSC coculture combined with Cytochalasin D (Cyto D) treatment after Rsl3 stimulation for 24 h. Mitochondria was stained with Mitotracker green (FITC channel). (B) Quantitative analysis of the mean fluorescence intensity of MitoTracker green in (A). (n=3 biological repeats for each group; Ordinary one-way ANOVA). (C) Western Blot analysis of mitophagy related proteins, such as PINK1 and Parkin, in Ht22 cells from culture alone, coculture with MSCs or MSC coculture combined with Cyto D treatment after Rsl3 stimulation for 24 h. (D–E) Quantitative analysis of the expression of mitophagy related proteins in (C). (n=3 biological repeats for each group; Ordinary one-way ANOVA). (F) Representative immunostaining pictures of mitophagy potential in Ht22 cells from culture alone, coculture with MSCs or MSC coculture with Cytochalasin D (Cyto D) treatment after Rsl3 stimulation for 24 h. Mitochondria are stained with Mitotracker green and autophagy is stained with Lysotracker red, respectively. Scale bar, 10 μm for original pictures and 1 μm for enlarged pictures. (G) Quantification of the average level of colocalization between mitochondria and lysosomes in (F). (n=5 biological repeats for each group; Ordinary one-way ANOVA). (H) Flow cytometry analysis of mitochondrial membrane potential (MMP) probed with JC-1 in Ht22 cells from culture alone, coculture with MSCs or MSC coculture combined with Cyto D treatment after Rsl3 stimulation for 24 h. (I) Quantitative analysis of the ratio of JC-1 aggregates (referred to high MMP, PE channel) /JC-1 monomers (referred to low MMP, FITC channel) in (H). (n=3 biological repeats for each group; Ordinary one-way ANOVA). (J) Flow cytometry analysis of mitochondrial ROS level in Ht22 cells from culture alone, coculture with MSCs or MSC coculture combined with Cyto D treatment after Rsl3 stimulation for 24 h. Mitochondrial ROS was probed with Mitosox (PE channel). (K) Quantitative analysis of the mean fluorescence intensity of Mitosox in (J). (n=3 biological repeats for each group; Ordinary one-way ANOVA). (L) Measurement of the intracellular ATP level in Ht22 cells from culture alone, coculture with MSCs or MSC coculture combined with Cyto D treatment after Rsl3 stimulation for 24 h (n=3 biological repeats for each group; Ordinary one-way ANOVA). Two-sided comparison; All data are mean ± SD; Error bars represent SDs; *p < 0.05, **p < 0.01, ***p < 0.001; See also Supplementary Fig. 8. (For interpretation of the references to colour in this figure legend, the reader is referred to the Web version of this article.)
Fig. 6
Fig. 6
MSC coculture inhibits neuronal ferroptosis through mitochondrial transfer. (A) qPCR analysis of relative mRNA expression of ferroptosis-related genes, including Ptgs2, Acsl4, Gpx4, Fth1, Slc39a14 and Fpn1, in Ht22 cells from culture alone, coculture with MSCs or MSC coculture combined with Cyto D treatment after Rsl3 stimulation for 24 h (n=3 biological repeats for each group; Ordinary one-way ANOVA). (B) Western Blot analysis of the ferroptosis-related proteins in Ht22 cells from culture alone, coculture with MSCs or MSC coculture combined with Cyto D treatment after Rsl3 stimulation for 24 h (n=3 biological repeats for each group). (C–D) Flow cytometry and quantitative analysis of intracellular ROS level in Ht22 cells from culture alone, coculture with MSCs or MSC coculture combined with Cyto D treatment after Rsl3 stimulation for 24 h. Intracellular ROS was stained with DHE (PE channel). (n=3 biological repeats for each group; Ordinary one-way ANOVA). (E) Flow cytometry analysis of intracellular lipid ROS generation in Ht22 cells from culture alone, coculture with MSCs or MSC coculture combined with Cyto D treatment after Rsl3 stimulation for 24 h. Intracellular lipid ROS was probed with C11-BODIPY581/591 (oxidized, FITC channel). (F) Quantitative analysis of the percentage of oxidized C11-BODIPY581/591 in (E). (n=3 biological repeats for each group; Ordinary one-way ANOVA). (G) Quantitative analysis of the ratio of oxidized (FITC channel) to reduced (PE channel) C11-BODIPY581/591 mean fluorescence intensity (MFI) in (E). (n=3 biological repeats for each group; Ordinary one-way ANOVA). (H) Measurement of intracellular MDA level in Ht22 cells from culture alone, coculture with MSCs or MSC coculture combined with Cyto D treatment after Rsl3 stimulation for 24 h (n=3 biological repeats for each group; Ordinary one-way ANOVA). (I) Measurement of intracellular total iron level in Ht22 cells from culture alone, coculture with MSCs or MSC coculture combined with Cyto D treatment after Rsl3 stimulation for 24 h (n=3 biological repeats for each group; Ordinary one-way ANOVA). (J) Quantitative analysis of the increase in MFI of Calcein-AM (FITC channel, subtracted the MFI treated without Deferiprone from the MFI treated with Deferiprone), reflected the amount of intracellular labile iron pool (LIP) in (K). (n=3 biological repeats for each group; Ordinary one-way ANOVA). (K) Flow cytometry analysis of LIP in Ht22 cells from culture alone, coculture with MSCs or MSC coculture combined with Cyto D treatment after Rsl3 stimulation for 24 h. Cells were incubated by Calcein-AM (FITC channel) and treated with or without Deferiprone. Two-sided comparison; All data are mean ± SD; Error bars represent SDs; *p < 0.05, **p < 0.01, ***p < 0.001; See also Supplementary Fig. 9 and Fig. 10.
Fig. 7
Fig. 7
MSC transplantation alleviates neuronal ferroptosis and promotes functional recovery after SCI by delivery of mitochondria. (A) Schematic illustration of spinal crush injury model and MSC intramedullary injection post injury. Created with BioRender.com. (B) Representative confocal microscopy images show rostal part, injection center and caudal part of spinal cord tissues in 1 day after spinal cord injury. Mitochondriaderived from MSCs were labeled by Mitotracker and neurons were marked by NeuN. Scale bar, 150 μm for original pictures and 20 μm for enlarged pictures. (C) Representative TEM images show the morphology of neuronal mitochondria in the spinal cord tissue from SCI group, SCI+MSC group, SCI+MSC+Cyto D group in 1 day after spinal cord injury. Red and green arrows indicate damaged and normal mitochondria, respectively. Scale bar, 2 μm for original pictures and 0.5 μm for enlarged pictures. (D) Measurement of BMS scores on day 0, 1, 3, 7, 14, 21, 28, 35 and 42 post injury. (n=6 biological repeats for SCI group, SCI+MSC+Cyto D group and n=7 biological repeats for SCI+MSC group; Ordinary one-way ANOVA). (E) Representative images of footprint test in 42 days after spinal cord injury from SCI group, SCI+MSC group, SCI+MSC+Cyto D group. Scale bar, 5 cm. (F) Representative diagrams of motor evoked potential (MEP) detection in 42 days after spinal cord injury from SCI group, SCI+MSC group, SCI+MSC+Cyto D group. (G–H) Quantitative analysis of the amplitude of the first peak (mV) and the latency (ms) in (F). (n=6 biological repeats for SCI group, SCI+MSC+Cyto D group and n=7 biological repeats for SCI+MSC group; Ordinary one-way ANOVA). (I) Representative gross anatomical maps, H&E and Nissl staining images show the lesion core and neuronal region in 42 days after spinal cord injury from SCI group, SCI+MSC group, SCI+MSC+Cyto D group, respectively. Scale bar, 1 cm for gross anatomical maps and 1 mm for staining images. (J–K) Quantitative analysis of the lesion area and Nissl staining positive area (mm2) in (l). (n=6 biological repeats for SCI group, SCI+MSC+Cyto D group and n=7 biological repeats for SCI+MSC group; Ordinary one-way ANOVA). (L) Representative immunostaining pictures of the spinal cord in 42 days after spinal cord injury from SCI group, SCI+MSC group, SCI+MSC+Cyto D group, Neurons were marked by NeuN and astrocytes were marked by GFAP to indicate the lesion area. Scale bar, 400 μm. Two-sided comparison; All data are mean ± SD; Error bars represent SDs; *p < 0.05, **p < 0.01, ***p < 0.001, ns > 0.05; See also Supplementary Figs. 11 and 12. (For interpretation of the references to colour in this figure legend, the reader is referred to the Web version of this article.)
Fig. 8
Fig. 8
Schematic illustration of stem cell-based mitochondrial therapy for anti-neuronal ferroptosis during spinal cord injury. Injection of abundant functional mitochondria based on mesenchymal stem cell (MSC) in vivo stabilizes neuronal mitochondrial quality control system, alleviates neuronal ferroptosis and finally promotes functional recovery after spinal cord injury. Pharmacological intervention by cytochalasin D reduces by tunneling nanotube (TNT)-dependent mitochondrial transfer, increasing neuronal ferroptosis and decreasing the effect of stem cell-based mitochondrial therapy for spinal cord injury.

References

    1. McDonald J.W., Sadowsky C. Spinal-cord injury. Lancet. 2002;359:417–425. doi: 10.1016/S0140-6736(02)07603-1. - DOI - PubMed
    1. Guest J., Datta N., Jimsheleishvili G., Gater D.R., Jr. Pathophysiology, classification and comorbidities after traumatic spinal cord injury. J. Personalized Med. 2022;12 doi: 10.3390/jpm12071126. - DOI - PMC - PubMed
    1. Sofroniew M.V. Dissecting spinal cord regeneration. Nature. 2018;557:343–350. doi: 10.1038/s41586-018-0068-4. - DOI - PubMed
    1. Tran A.P., Warren P.M., Silver J. The biology of regeneration failure and success after spinal cord injury. Physiol. Rev. 2018;98:881–917. doi: 10.1152/physrev.00017.2017. - DOI - PMC - PubMed
    1. Alizadeh A., Dyck S.M., Karimi-Abdolrezaee S. Traumatic spinal cord injury: an overview of pathophysiology, models and acute injury mechanisms. Front. Neurol. 2019;10:282. doi: 10.3389/fneur.2019.00282. - DOI - PMC - PubMed

Publication types

Substances

LinkOut - more resources