. 2023 Oct 3;35(10):1814-1829.e6.
doi: 10.1016/j.cmet.2023.08.008. Epub 2023 Sep 11.

Death-seq identifies regulators of cell death and senolytic therapies

Affiliations

Death-seq identifies regulators of cell death and senolytic therapies

Alex Colville et al. Cell Metab. .

Abstract

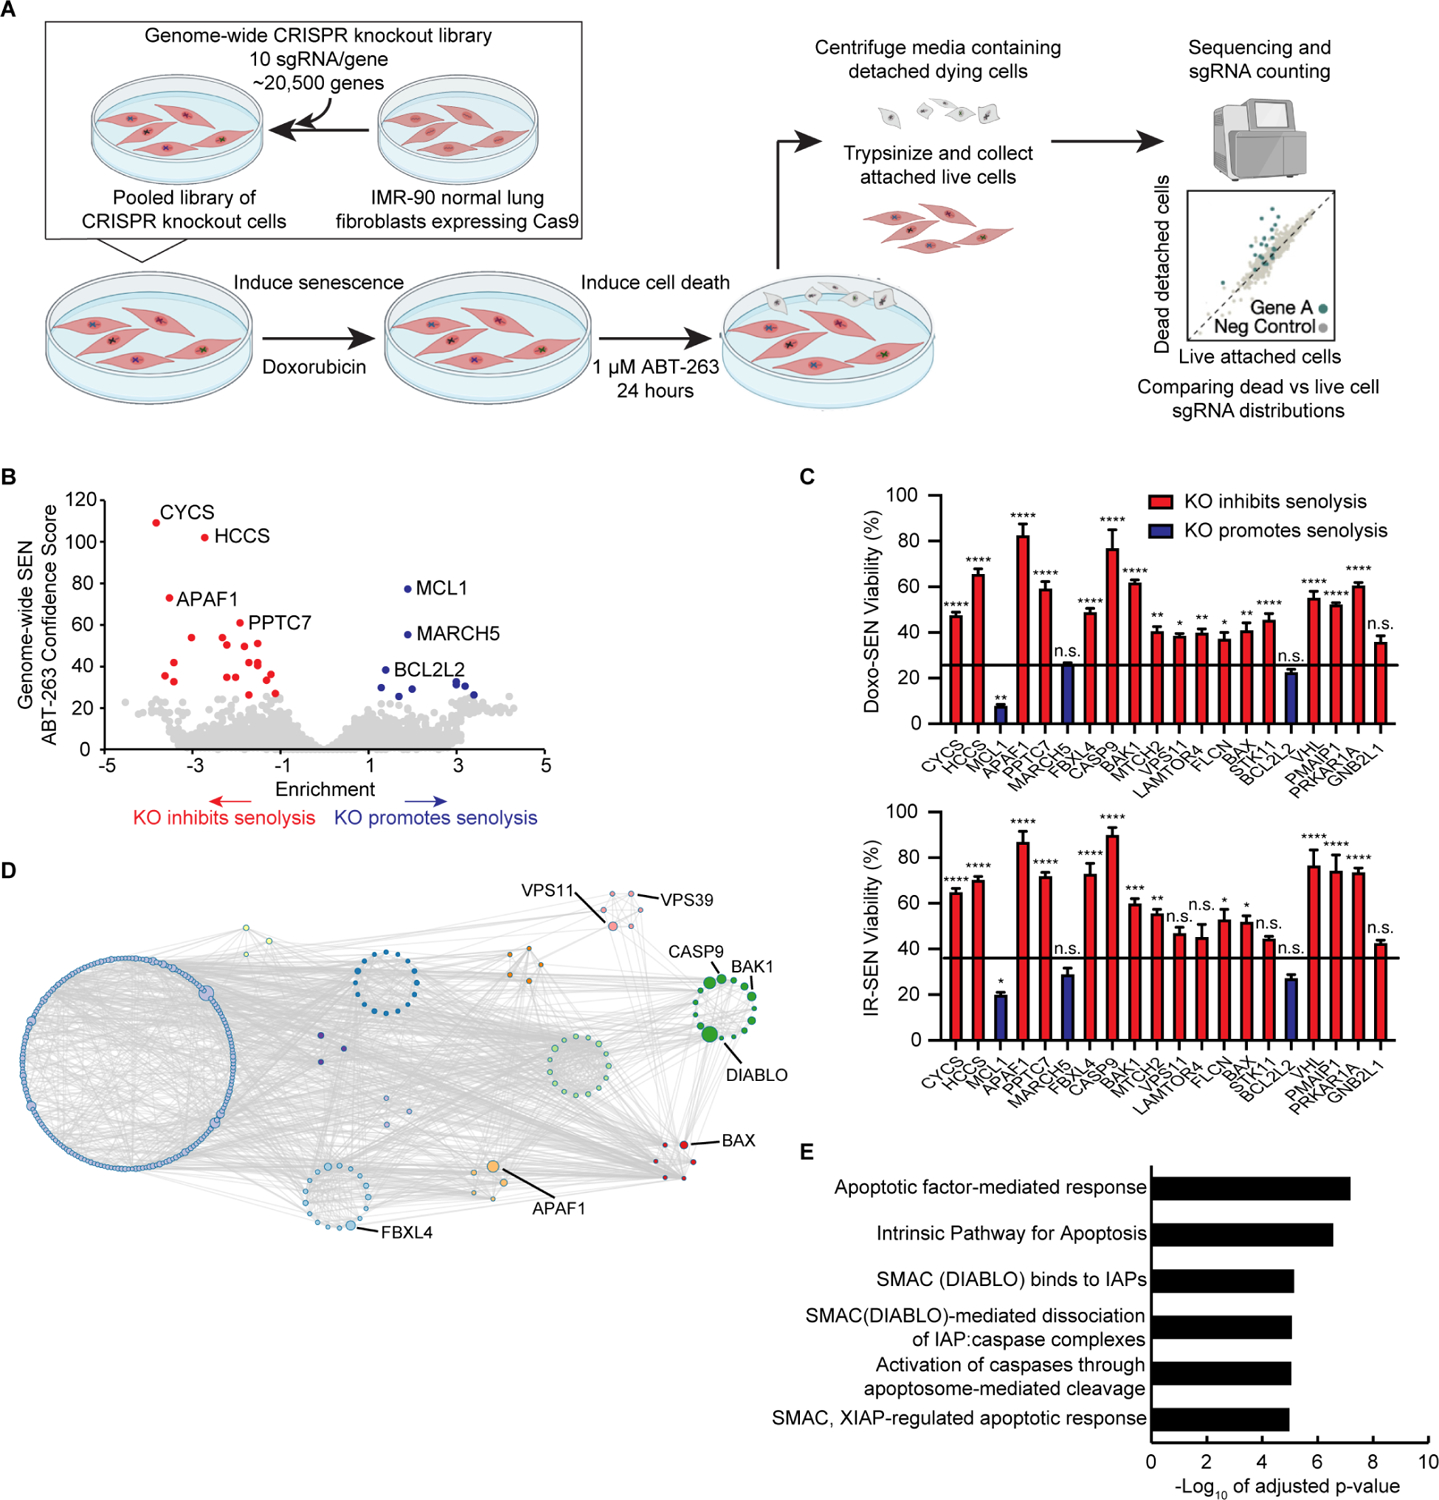
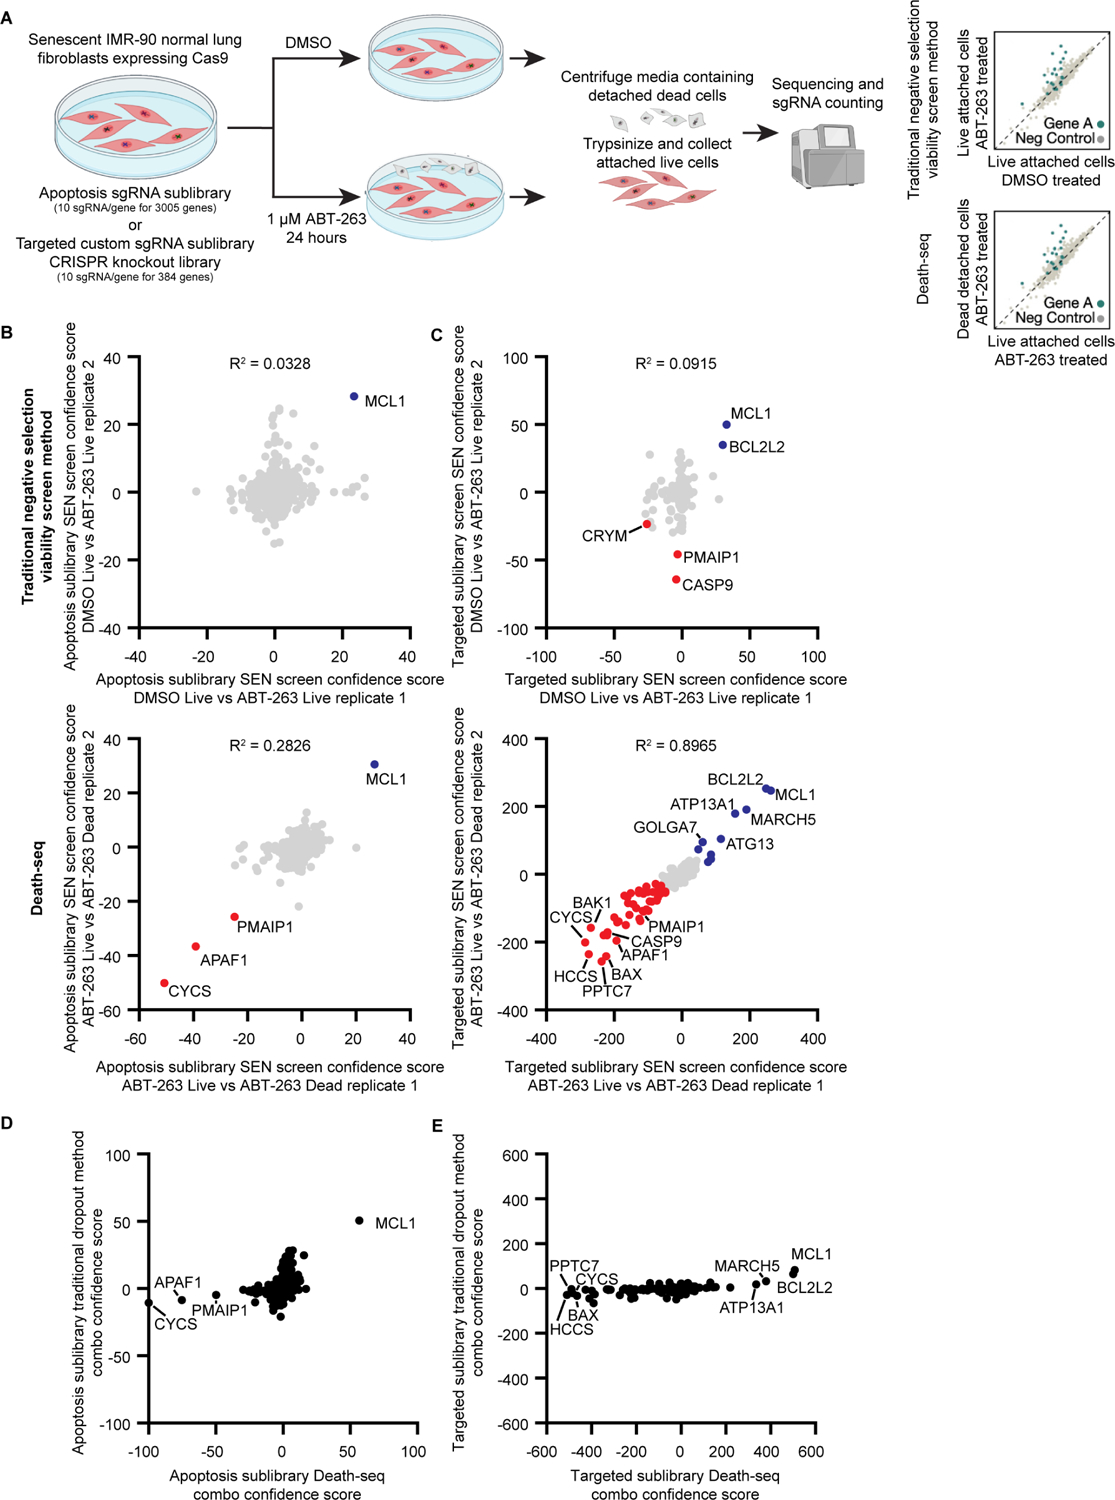
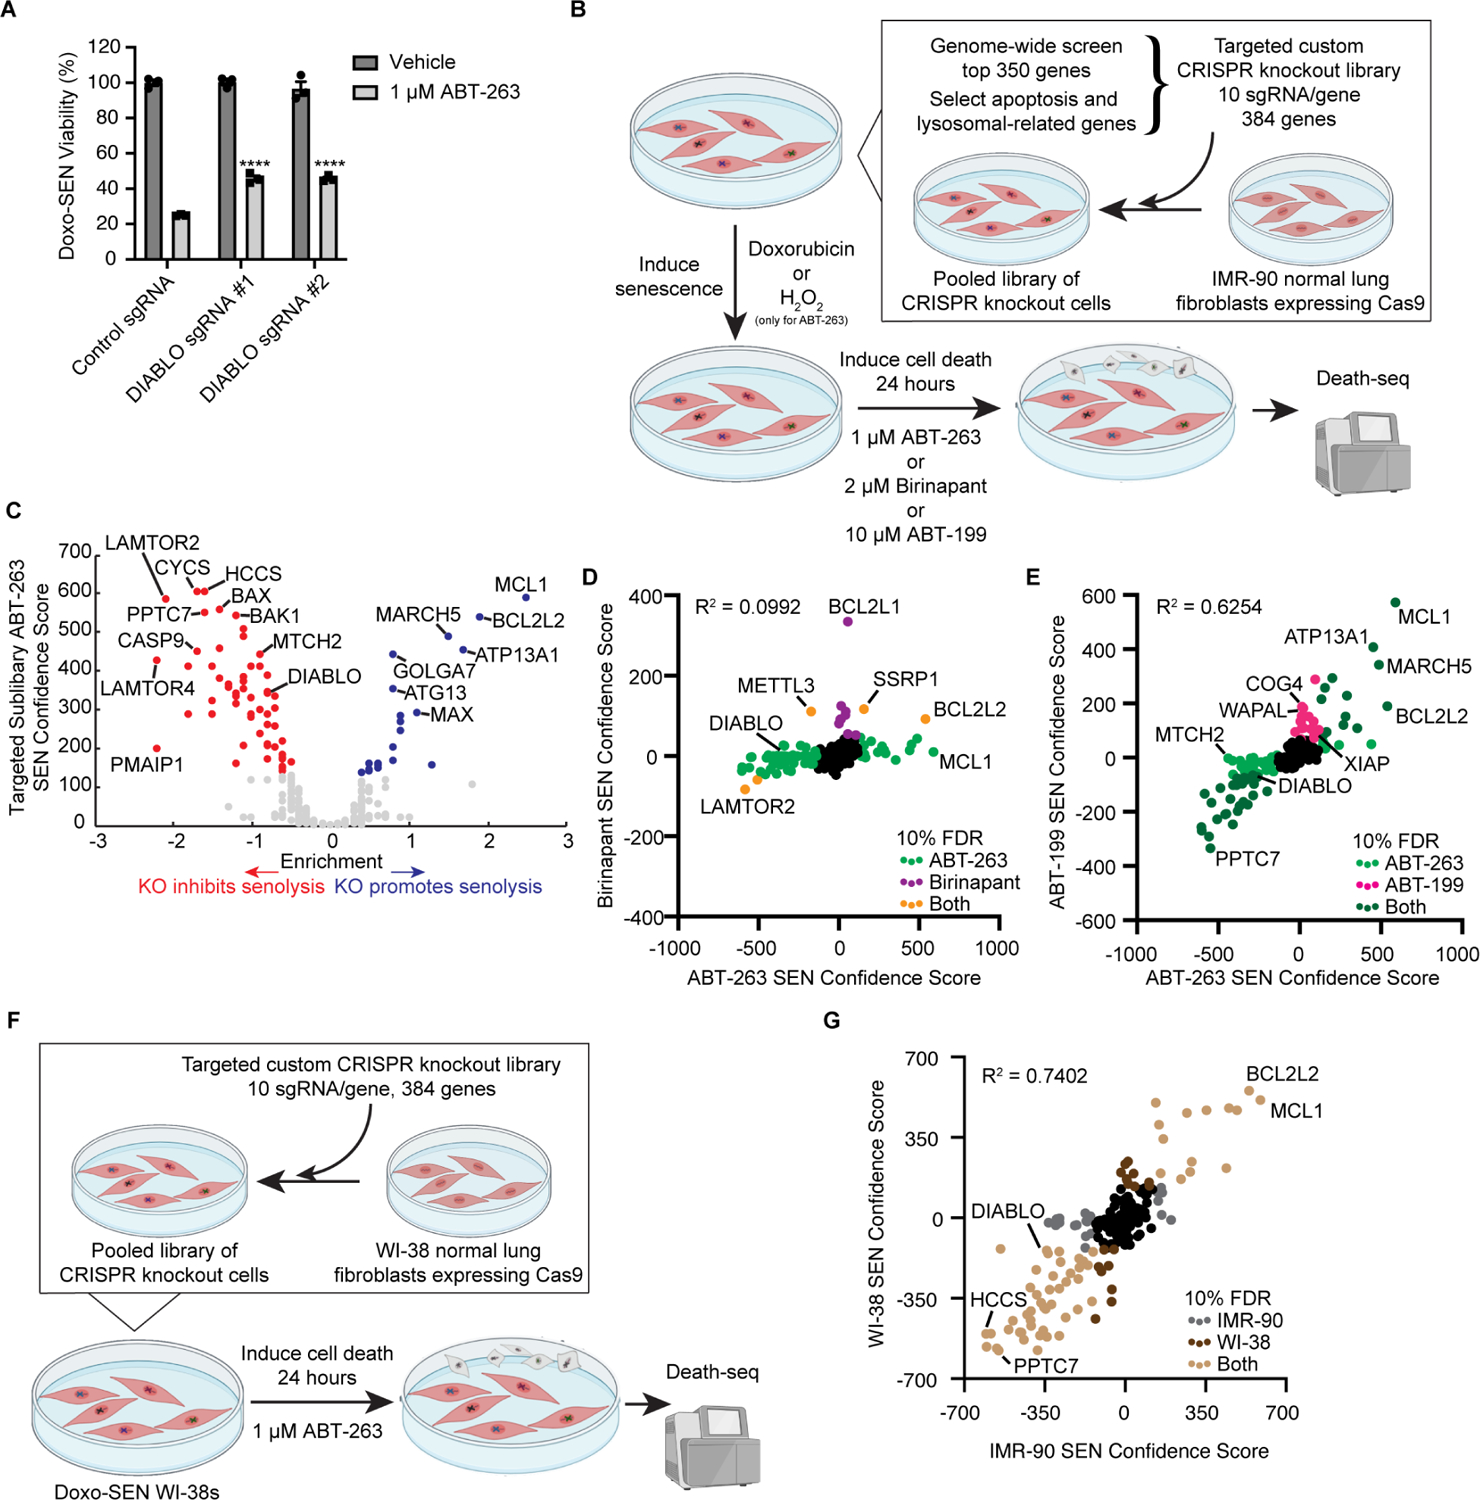
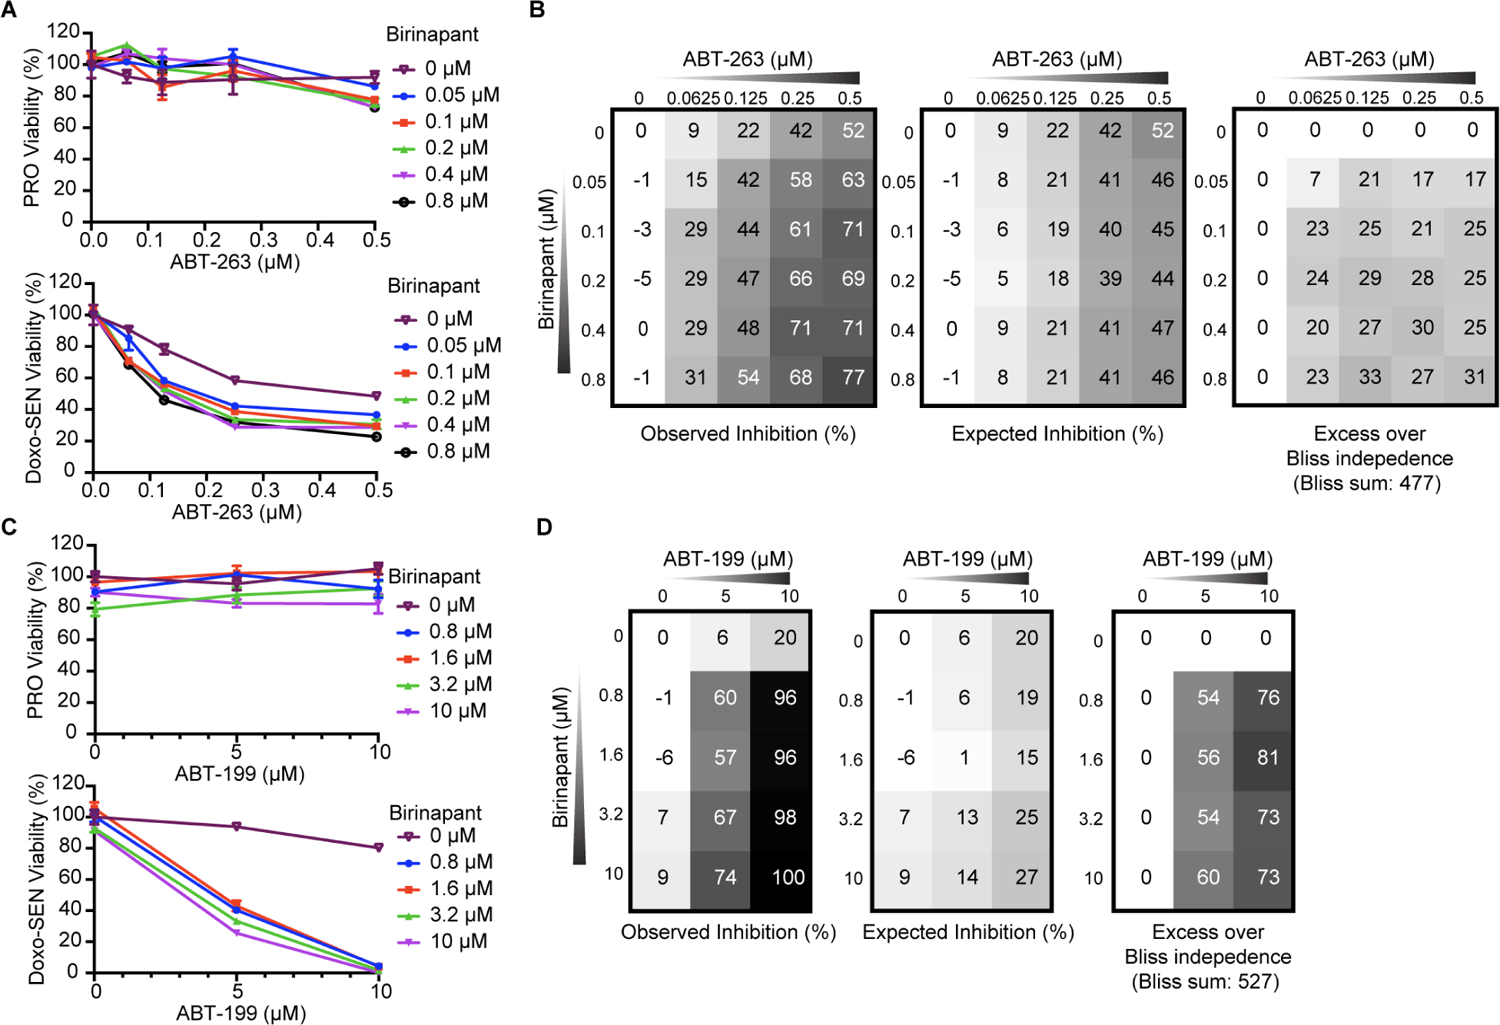
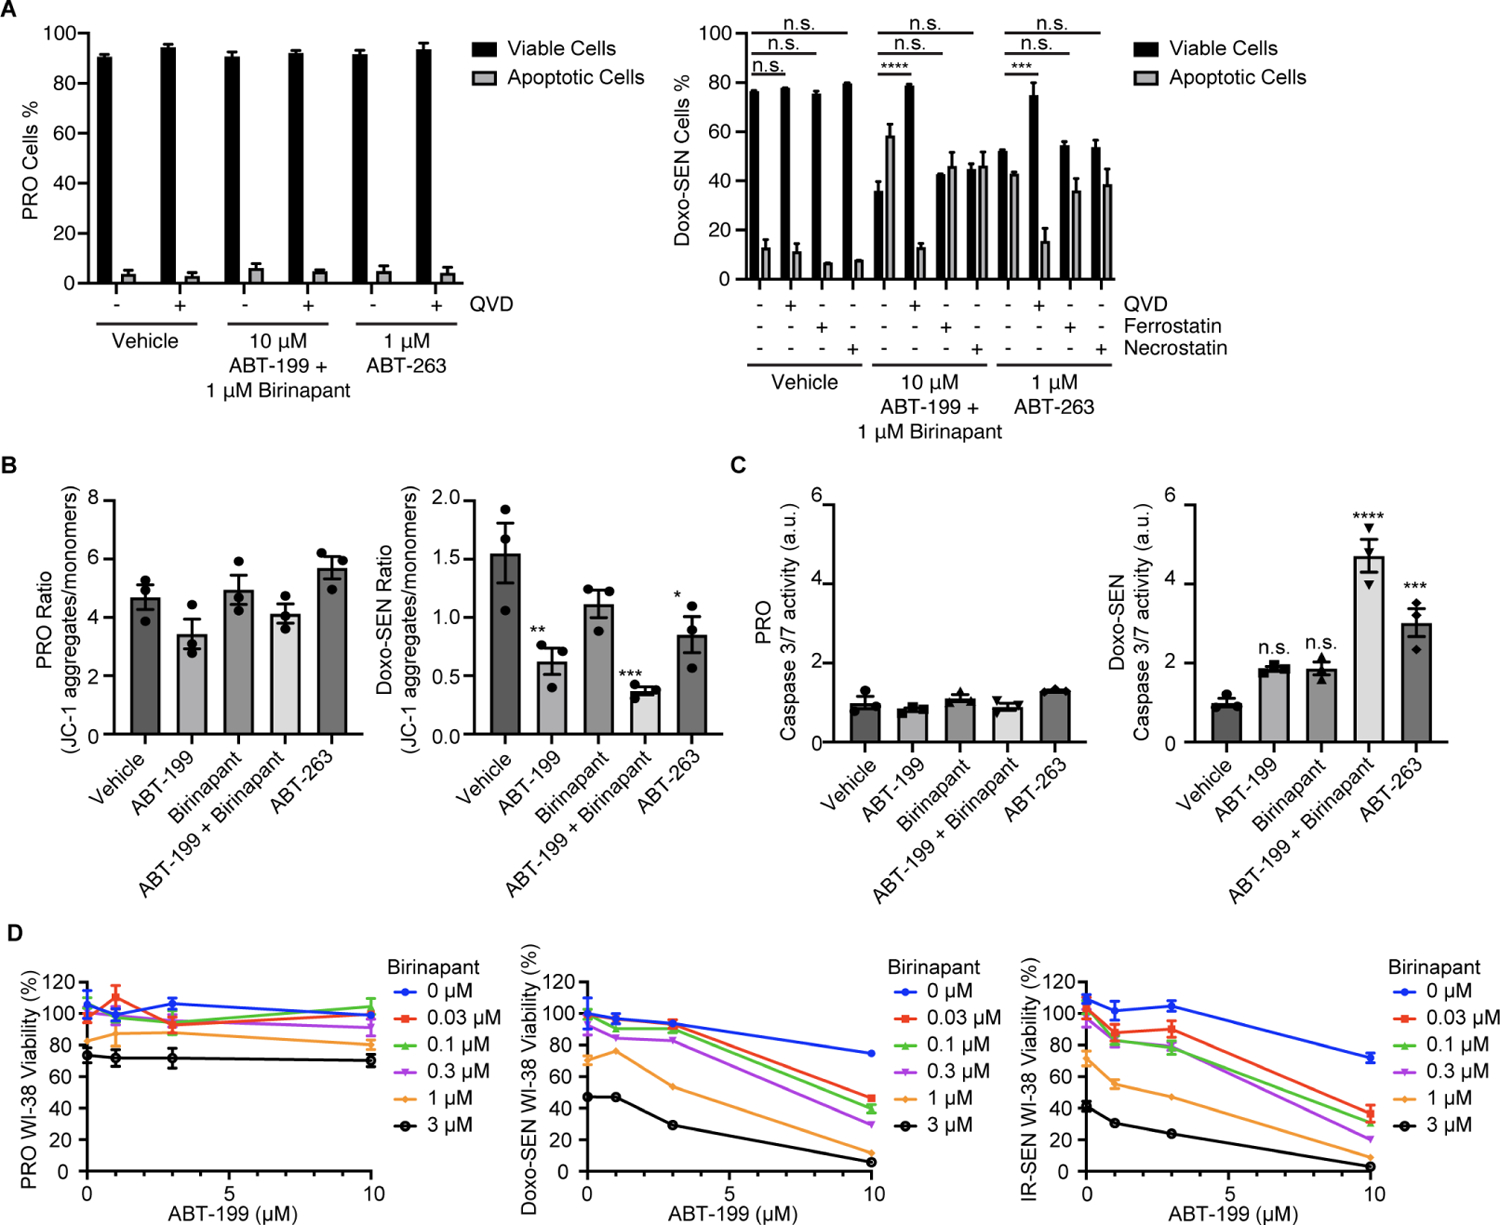
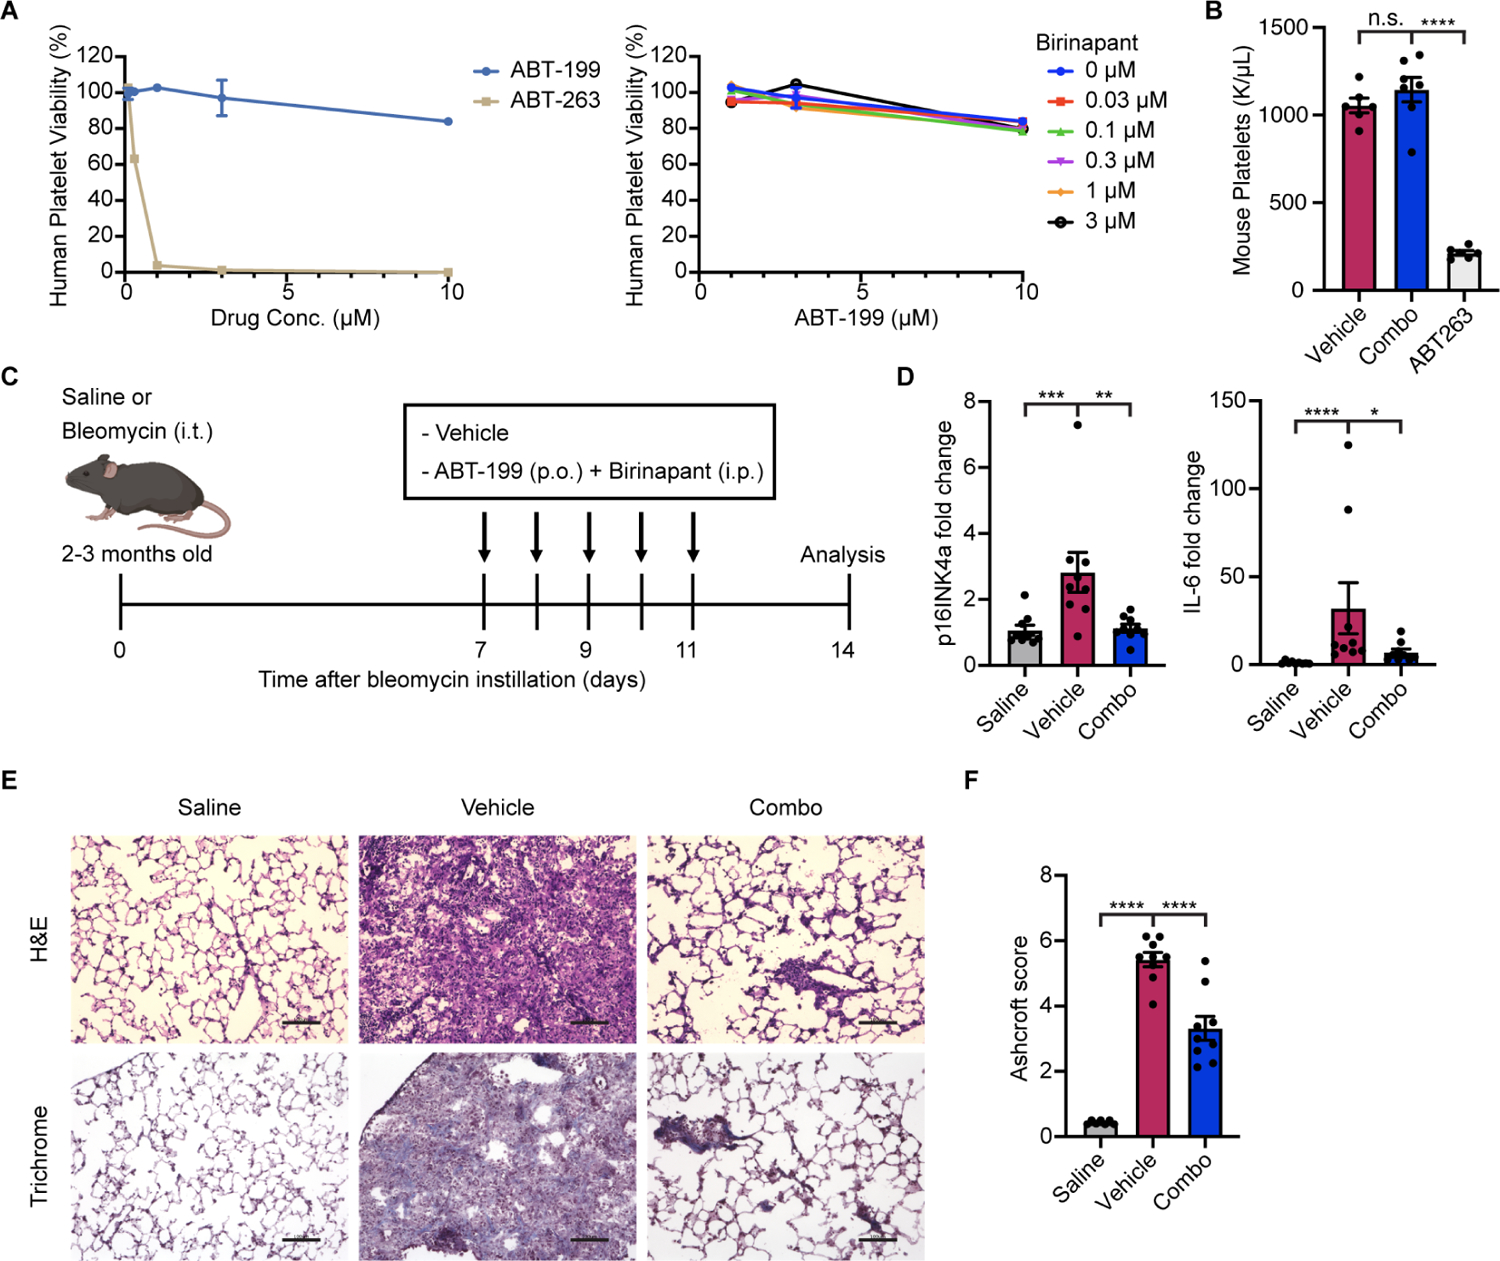
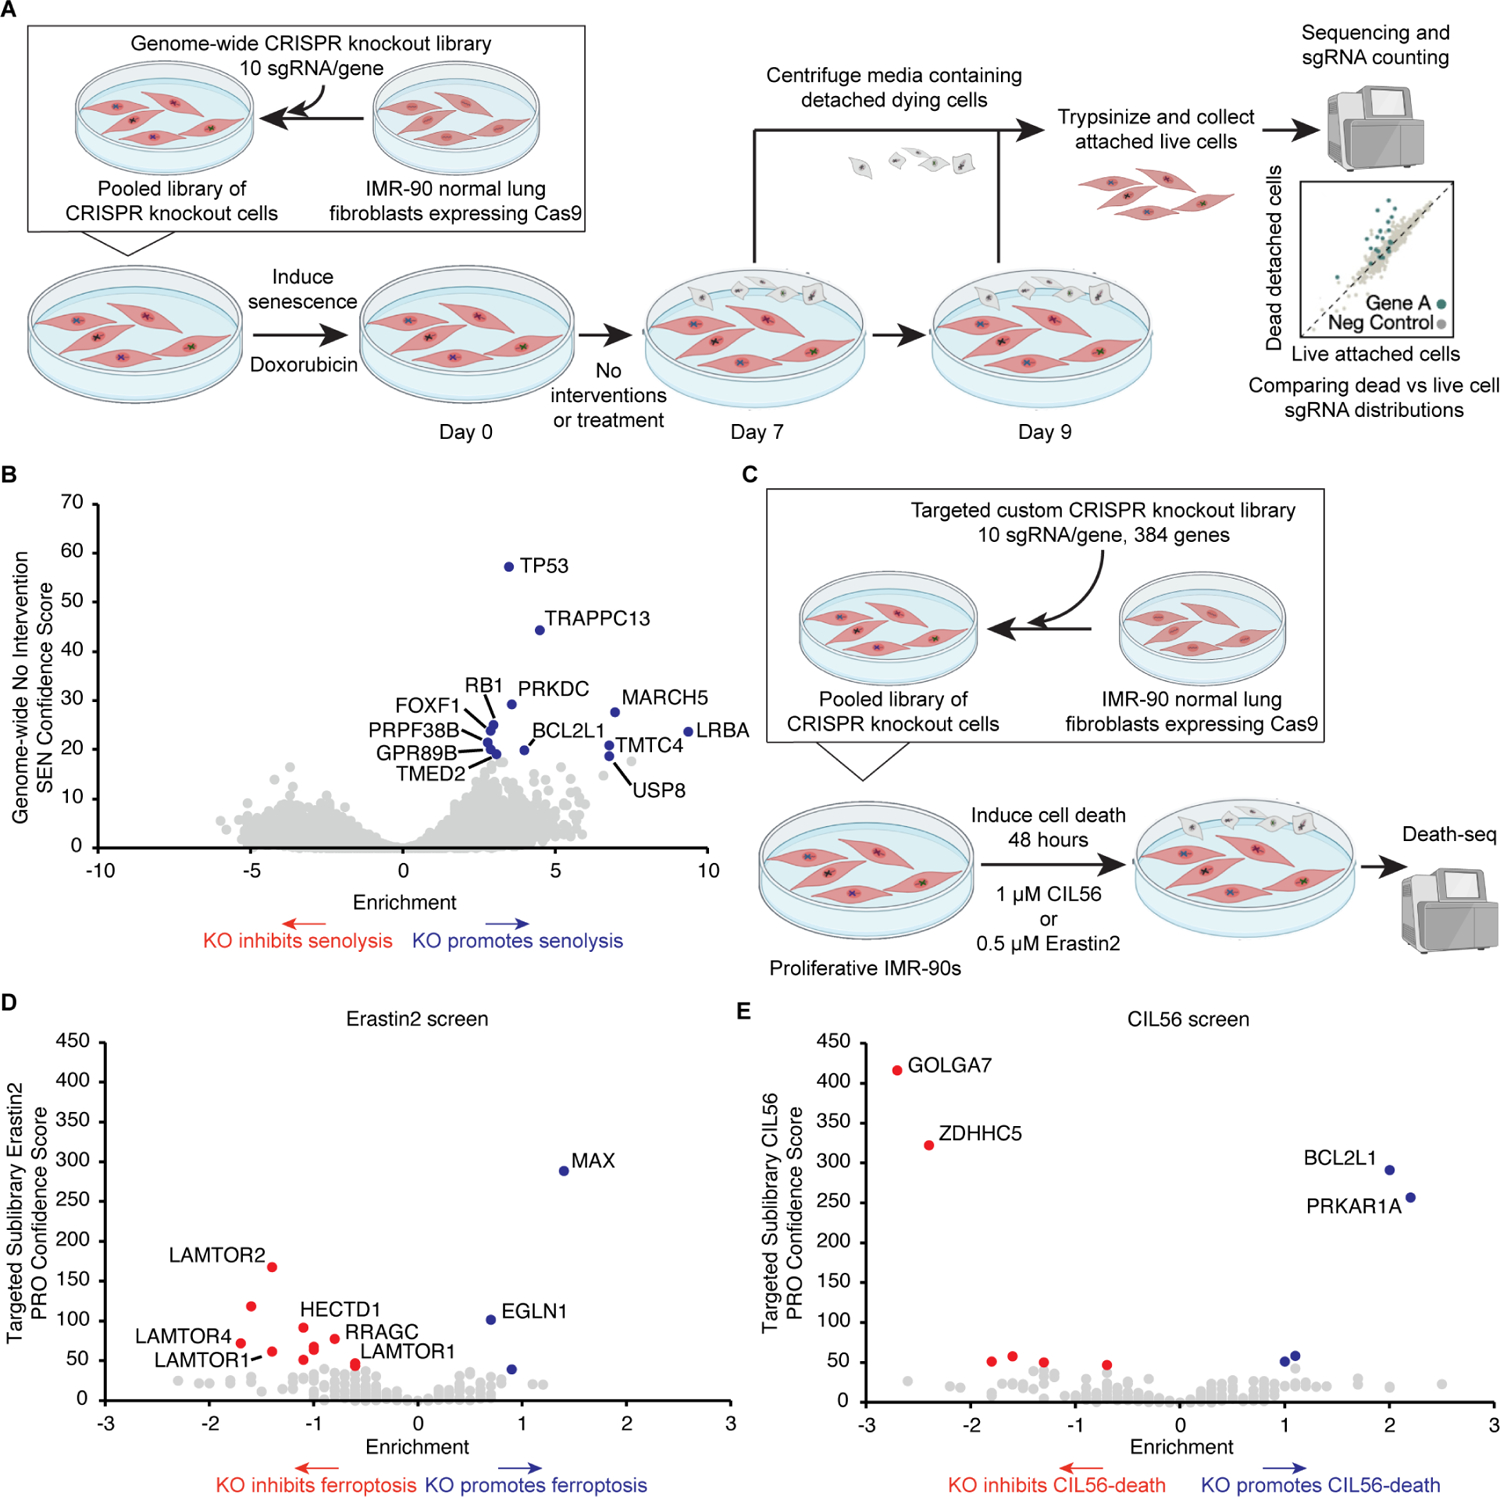
Selectively ablating damaged cells is an evolving therapeutic approach for age-related disease. Current methods for genome-wide screens to identify genes whose deletion might promote the death of damaged or senescent cells are generally underpowered because of the short timescales of cell death as well as the difficulty of scaling non-dividing cells. Here, we establish "Death-seq," a positive-selection CRISPR screen optimized to identify enhancers and mechanisms of cell death. Our screens identified synergistic enhancers of cell death induced by the known senolytic ABT-263. The screen also identified inducers of cell death and senescent cell clearance in models of age-related diseases by a related compound, ABT-199, which alone is not senolytic but exhibits less toxicity than ABT-263. Death-seq enables the systematic screening of cell death pathways to uncover molecular mechanisms of regulated cell death subroutines and identifies drug targets for the treatment of diverse pathological states such as senescence, cancer, and fibrosis.

Keywords: CRISPR; Death-seq; cell death; death screen; genome-wide; positive selection; pulmonary fibrosis; senescence; senolytics; synthetic lethality.


Conflict of interest statement

Declaration of interests A.C. and T.A.R. have filed a patent application related to the subject matter of this paper. A.C. was formerly a paid consultant during this work for Maze Therapeutics and Rubedo Life Sciences.

Figures

Figure 1.
Figure 1.. A genome-wide CRISPR screen for modifiers of cell death, Death-seq, identifies modifiers of senescent cell death
(A) Schematic of Death-seq screening method for genetic modifiers of cell death. The screen 5 was performed in duplicate. (B) Volcano plot of the effects and confidence scores of all the genes in the genome-wide CRISPR screen in doxorubicin-induced senescent IMR-90s treated with 1 μM ABT-263 for 24 h. Effects and casTLE scores are calculated by casTLE. Labelled are the 31 genes passing 10% FDR for inhibiting (red) or promoting (blue) cell death by ABT-263 when knocked out. (C) Validation of the top 20 genome-wide screen hits, which in the screen inhibited (red bars) or promoted (blue bars) cell death, using individual-well sgRNA knockouts of the indicated genes compared to control sgRNA viability (represented by the line) after treatment with 1 μM ABT-263 for 3 d in either doxorubicin (Doxo)-induced (top) or irradiation (IR)-induced (bottom) senescent (SEN) IMR-90s. Data are representative of two independent experiments performed in triplicate and are presented as mean ± s.e.m. One-way ANOVA with Dunnett’s post-hoc test relative to control sgRNA-treated cells, *P < 0.05, **P < 0.01, ***P < 0.001, ****P < 0.0001. (D) Visualization of the genetic interaction network of the top 350 enriched genes in the genome-wide ABT-263 screen using Metascape. The size of the nodes corresponds to the confidence score of each gene in the screen. The Molecular Complex Detection (MCODE) algorithm was used to identify densely connected network components identified by circles of colored nodes. Select representative genes are highlighted. (E) The top Reactome categories enriched in the 64 genes that passed 30% FDR in the genome-wide ABT-263 screen. See also Figure S1 and the results and raw sequencing counts from screen in Tables S1 and S2 respectively.
Figure 2.
Figure 2.. Head-to-head comparison of Death-seq against traditional negative selection viability screens
(A) Schematic of head-to-head comparisons of Death-seq screening method against traditional negative selection viability screens for genetic modifiers of cell death induced by ABT-263 treatment. The screens were performed in duplicate. (B and C) Correlation of casTLE confidence scores for all genes in the apoptosis (ACOC) (B) or targeted custom sublibrary (C) ABT-263 screen technical replicates comparing a traditional negative selection viability screen (top, DMSO-treated live cells vs. ABT-263-treated live cells) against Death-seq (bottom, ABT-263-treated live cells vs. ABT-263-treated dying cells). Labelled are the genes passing 10% FDR for inhibiting (red) or promoting (blue) cell death by ABT-263 when knocked out. R-squared values are from linear regression models. (D and E) Comparison of combo casTLE confidence scores generated using a traditional negative selection viability screen method (DMSO-treated live cells vs. ABT-263-treated live cells) vs. the Death-seq method (ABT-263-treated live cells vs. ABT-263-treated dying cells) for all genes in the apoptosis (ACOC) (D) or the targeted custom sublibrary (E). See also the results, raw sequencing counts, and composition of the targeted custom sublibrary from screens in Tables S1, S2, and S3 respectively.
Figure 3.
Figure 3.. Targeted sublibrary senolytic Death-seq screens highlight importance of SMAC
(A) Validation of DIABLO/SMAC sgRNA knockouts compared to control gRNA viability after treatment with vehicle or 1 μM ABT-263 for 3 d in Doxo-induced senescent IMR-90s. Data are representative of two independent experiments performed in triplicate and are presented as mean ± s.e.m. One-way ANOVA with Dunnett’s post-hoc test relative to control sgRNA-treated cells in the corresponding drug treatment, *P < 0.05, **P < 0.01, ***P < 0.001, ****P < 0.0001. (B) Schematic of targeted custom sublibrary screens. The targeted custom library was infected using lentivirus into Cas9-expressing IMR-90 normal lung fibroblasts. The IMR-90s expressing the targeted sublibrary were then induced to senesce with Doxo and treated with 1 μM ABT-263, 2 μM birinapant, or 10 μM ABT-199 for 24 h. A targeted custom sublibrary screen was also performed with H2O2-induced senescent IMR-90s and 1 μM ABT-263 treatment. Like the genome-wide screen, Death-seq was used to compare the dying cell populations directly with the live attached cells. The screens were performed in duplicate. (C) Volcano plot of the effects and confidence scores of all the genes in the targeted custom CRISPR screen in Doxo-induced senescent IMR-90 cells treated with 1 μM ABT-263 for 24 h. Labelled are the 80 genes passing 10% FDR for inhibiting (red) or promoting (blue) cell death by ABT-263 when knocked out. (D) Correlation of combo casTLE confidence scores of the ABT-263 and birinapant screens in Doxo-induced senescent IMR-90s for all genes in the targeted custom sublibrary. R-squared value is from a linear regression model. Labelled in light green, purple, and orange are hits passing 10% FDR only in ABT-263 screen, only in birinapant screen, or in both screens, respectively. (E) Correlation of combo casTLE confidence scores of the ABT-263 and ABT-199 screens in Doxo-induced senescent IMR-90s for all genes in the targeted custom sublibrary. R-squared value is from a linear regression model. Labelled in light green, pink, and dark green are hits passing 10% FDR only in ABT-263 screen, only in ABT-199 screen, or in both screens, respectively. (F) Schematic of targeted custom sublibrary ABT-263 screen in Doxo-SEN WI-38 normal lung fibroblasts run head-to-head against Doxo-SEN IMR-90s. The screens were performed in duplicate. (G) Correlation of combo casTLE confidence scores of the Doxo-induced senescent IMR-90s and Doxo-induced senescent WI-38s ABT-263 screens for all genes in the targeted custom sublibrary. R-squared value is from a linear regression model. Labelled in grey, dark brown, and light brown are hits passing 10% FDR only in the IMR-90 screen, only in the WI-38 screen, or in both screens, respectively. See also Figure S2 and the results, raw sequencing counts, and composition of the targeted custom sublibrary from screens in Tables S1, S2, and S3 respectively.
Figure 4.
Figure 4.. BH3 and SMAC mimetics synergize to induce selective death in senescent cells
(A) Proliferative (top) and Doxo-induced senescent (bottom) IMR-90s were treated with ABT-263 and birinapant at the indicated concentrations for 3 d before viability was assessed relative to no drug control. Data are representative of two independent experiments performed in triplicate and are presented as mean ± s.e.m. (B) The percent expected inhibition is subtracted from the percent observed inhibition at each combination of drug doses in Doxo-induced senescent IMR-90s to calculate drug synergy represented by excess over Bliss independence. (C) Proliferative (top) and Doxo-induced senescent (bottom) IMR-90s were treated with ABT-199 and the SMAC mimetic birinapant at the indicated concentrations for 3 d before viability was assessed relative to no drug control. Data are representative of two independent experiments performed in triplicate and are presented as mean ± s.e.m. (D) The percent expected inhibition is subtracted from the percent observed inhibition at each combination of drug doses in Doxo-induced senescent IMR-90s to calculate drug synergy represented by excess over Bliss independence. See also Figure S3 and S4.
Figure 5.
Figure 5.. ABT-199 and SMAC mimetic combination is senolytic through apoptosis across different cell types
(A) Percentage of viable and apoptotic proliferative (left) and Doxo-induced senescent (right) IMR-90s 24 h after treatment with vehicle, 10 μM ABT-199 and 1 μM birinapant, or 1 μM ABT-263, all with and without 20 μM Q-VD-Oph (QVD), 10 μM ferrostatin, and 10 μM necrostatin. (B) Proliferative (left) and Doxo-induced senescent (right) IMR-90s were treated for 24 h with vehicle, 10 μM ABT-199, 1 μM birinapant, 10 μM ABT-199 and 1 μM birinapant, or 1 μM ABT-263. The treated cells were then stained and measured by flow cytometry to determine the ratio of JC-1 aggregates to JC-1 monomers. Data are representative of two independent experiments performed in triplicate and are presented as mean ± s.e.m. One-way ANOVA with Dunnett’s post-hoc test, *P < 0.05, **P < 0.01, ***P < 0.001, ****P < 0.0001. (C) Normalized caspase 3/7 activity in proliferative (left) and Doxo-induced senescent (right) IMR-90s that were treated for 24 h with vehicle, 10 μM ABT-199, 1 μM birinapant, 10 μM ABT-199 and 1 μM birinapant, or 1 μM ABT-263. Data are representative of two independent experiments performed in triplicate and are presented as mean ± s.e.m. One-way ANOVA with Dunnett’s post-hoc test, *P < 0.05, **P < 0.01, ***P < 0.001, ****P < 0.0001. (D) Proliferative (left), Doxo-induced senescent (middle), and IR-induced senescent (right) WI-38s were treated with ABT-199 and birinapant at the indicated concentrations for 3 d before viability was assessed relative to no drug control. See also Figure S5.
Figure 6.
Figure 6.. ABT-199 and SMAC mimetic combination spares human platelets and reduces levels of senescent cell markers in vivo
(A) Human platelets were treated with ABT-199 or ABT-263 (left) or ABT-199 in combination with birinapant at the indicated concentrations (right) for 3 d before viability was assessed relative to no drug control. Data are representative of two independent experiments performed in triplicate and are presented as mean ± s.e.m. (B) Platelet count from mice treated with vehicle (n = 6), ABT-199 in combination with birinapant (n = 7), or ABT-263 (n = 6), eight days after the initiation of treatment. (C) Schematic of bleomycin-induced IPF mouse model experiment. (D) mRNA expression of p16INK4a and Il6 in murine lungs were quantified by qRT-PCR and normalized by Tbp levels. Fold-increase was calculated with respect to the mRNA levels in saline-treated control mice (n = 9 in each group). Data are representative of two independent experiments performed in triplicate and are presented as mean ± s.e.m. One-way ANOVA with Dunnett’s post-hoc test, *P < 0.05, **P < 0.01, ***P < 0.001, ****P < 0.0001. (E) Representative images of hematoxylin and eosin (top) and Masson’s trichrome (bottom) stained lung sections from saline control (left), vehicle-treated (middle), and ABT-199/birinapant-treated (right) mice. Scale bar: 100 μm. (F) Pulmonary fibrosis was quantified with modified Ashcroft scores (n = 7 control group, n = 9 vehicle and combo groups). Data are representative of two independent experiments performed in triplicate and are presented as mean ± s.e.m. One-way ANOVA with Dunnett’s post-hoc test, *P < 0.05, **P < 0.01, ***P < 0.001, ****P < 0.0001. See also Figure S6.
Figure 7.
Figure 7.. Death-seq identifies modifiers of cell death in the absence of drugs as well as in nonapoptotic cell death
(A) Schematic of Death-seq genome-wide CRISPR KO screen for modifiers of Doxo-SEN cell death in the absence of small molecules or perturbation. The screen was performed in duplicate. (B) Volcano plot of the effects and confidence scores of all the genes in the genome-wide CRISPR screen in the absence of small molecules. Effects and casTLE scores are calculated by casTLE. Labelled are the 13 genes passing 30% FDR for promoting (blue) senescent cell death when knocked out. (C) Schematic of Death-seq sublibrary CRISPR KO screens in proliferative IMR-90s for modifiers of ferroptosis induced by treatment with 0.5 μM erastin2 for 48 h and cell death induced by treatment with 1 μM CIL56 for 48 h. The screens were performed in duplicate. (D) Volcano plots of the effects and confidence scores of all the genes in the sublibrary CRISPR screens for modifiers of erastin2-induced ferroptosis (left) and CIL56-induced cell death (right) in proliferative IMR-90s. Effects and casTLE scores are calculated by casTLE. Labelled are the genes passing 30% FDR for inhibiting (red) or promoting (blue) cell death when knocked out. See also the results and raw sequencing counts from screens in Tables S1 and S2 respectively.

Comment in

References

    1. Collado M, Blasco MA, and Serrano M (2007). Cellular senescence in cancer and aging. Cell 130, 223–233. 10.1016/j.cell.2007.07.003. - DOI - PubMed
    1. Di Micco R, Krizhanovsky V, Baker D, and di Fagagna FDA (2021). Cellular senescence in ageing: from mechanisms to therapeutic opportunities. Nat. Rev. Mol. Cell Biol 22, 75–95. 10.1038/s41580-020-00314-w. - DOI - PMC - PubMed
    1. Gorgoulis V, Adams PD, Alimonti A, Bennett DC, Bischof O, Bishop C, Campisi J, Collado M, Evangelou K, Ferbeyre G, et al. (2019). Cellular senescence: defining a path forward. Cell 179, 813–827. 10.1016/j.cell.2019.10.005. - DOI - PubMed
    1. Baker DJ, Childs BG, Durik M, Wijers ME, Sieben CJ, Zhong J, Saltness RA, Jeganathan KB, Verzosa GC, Pezeshki A, et al. (2016). Naturally occurring p16Ink4a-positive cells shorten healthy lifespan. Nature 530, 184–189. 10.1038/nature16932. - DOI - PMC - PubMed
    1. He S, and Sharpless NE (2017). Senescence in health and disease. Cell 169, 10001011. 10.1016/j.cell.2017.05.015. - DOI - PMC - PubMed

Publication types