. 2023 Oct 15:170:68-85.
doi: 10.1016/j.actbio.2023.09.007. Epub 2023 Sep 10.

A viscoelastic constitutive model for human femoropopliteal arteries

Affiliations

A viscoelastic constitutive model for human femoropopliteal arteries

Will Zhang et al. Acta Biomater. .

Abstract

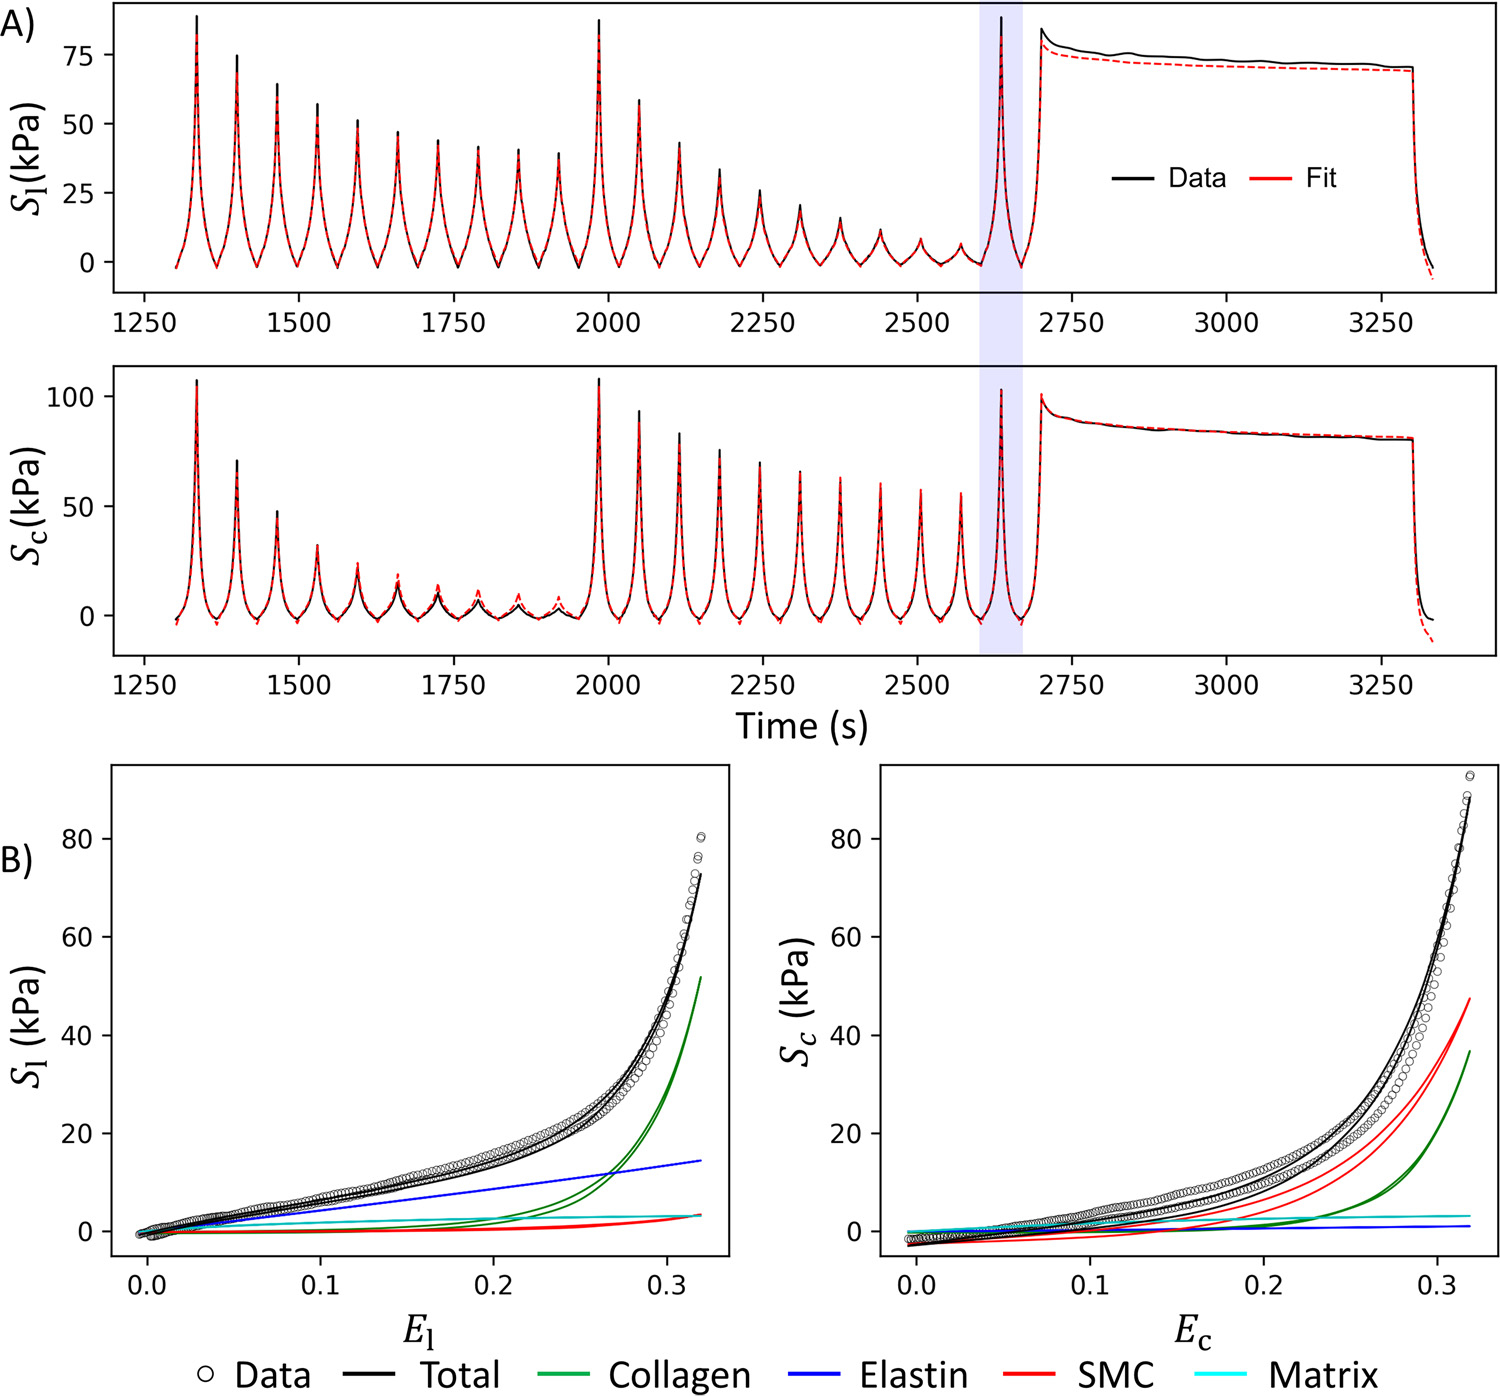
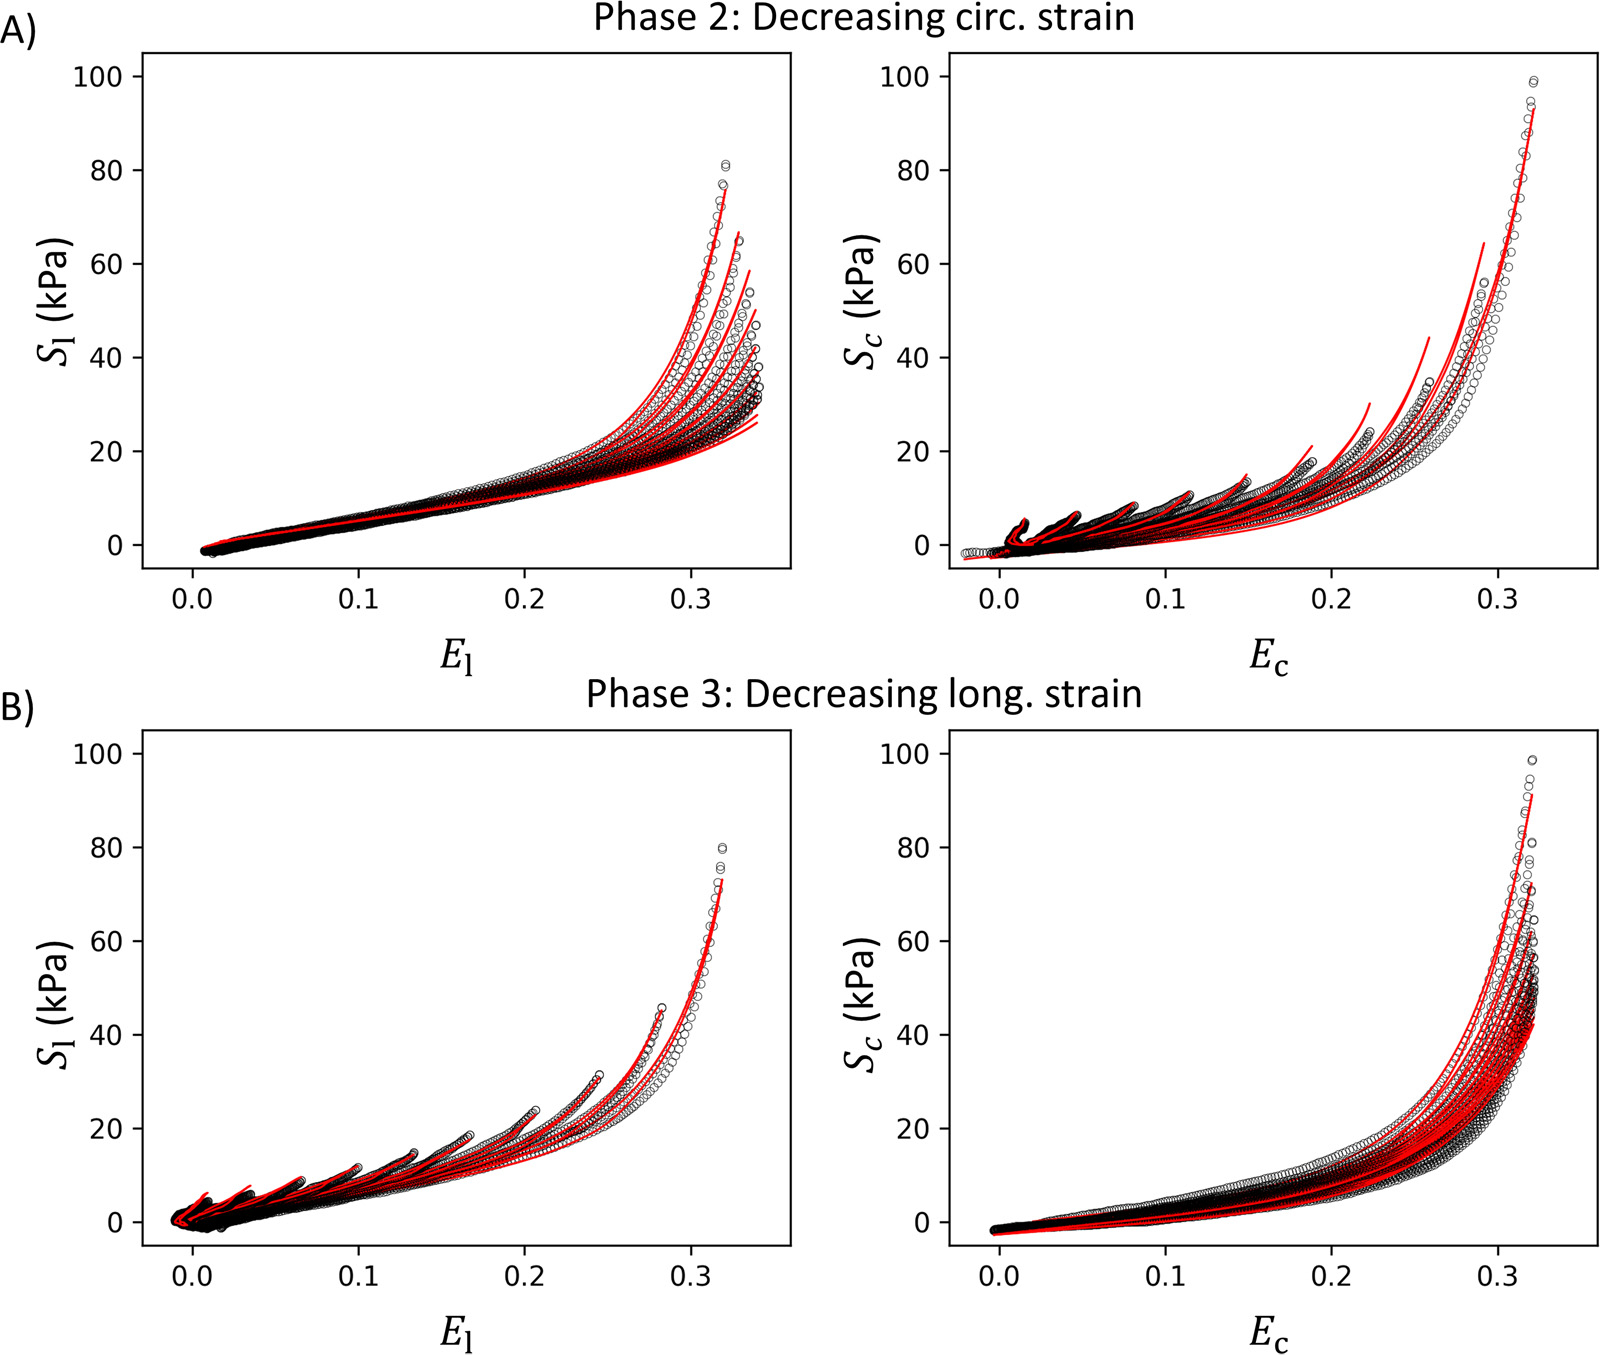
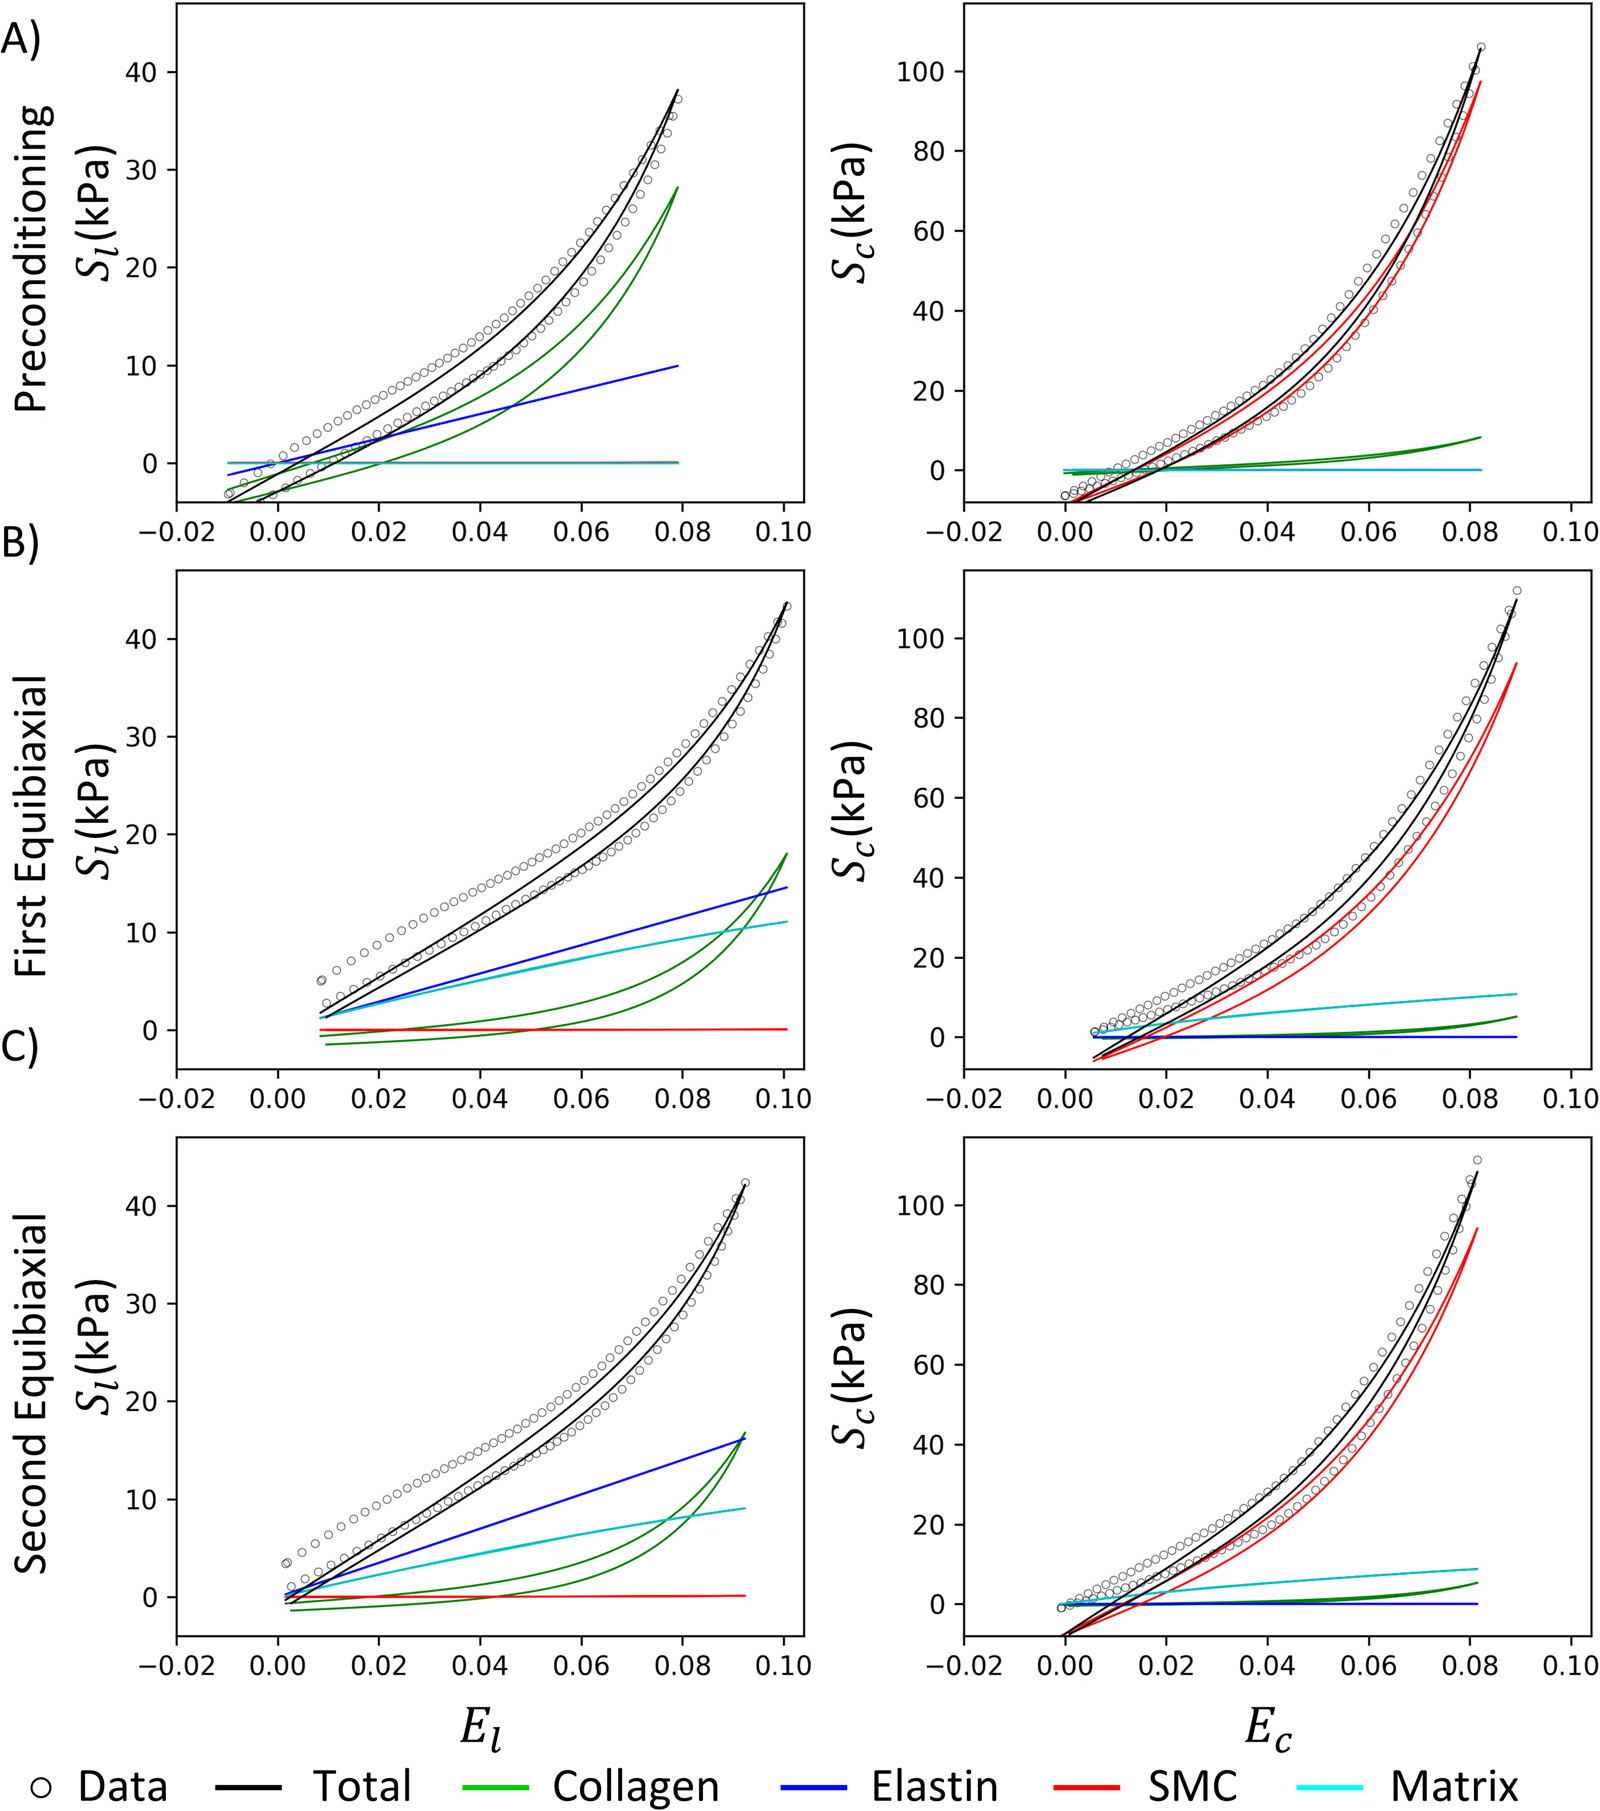
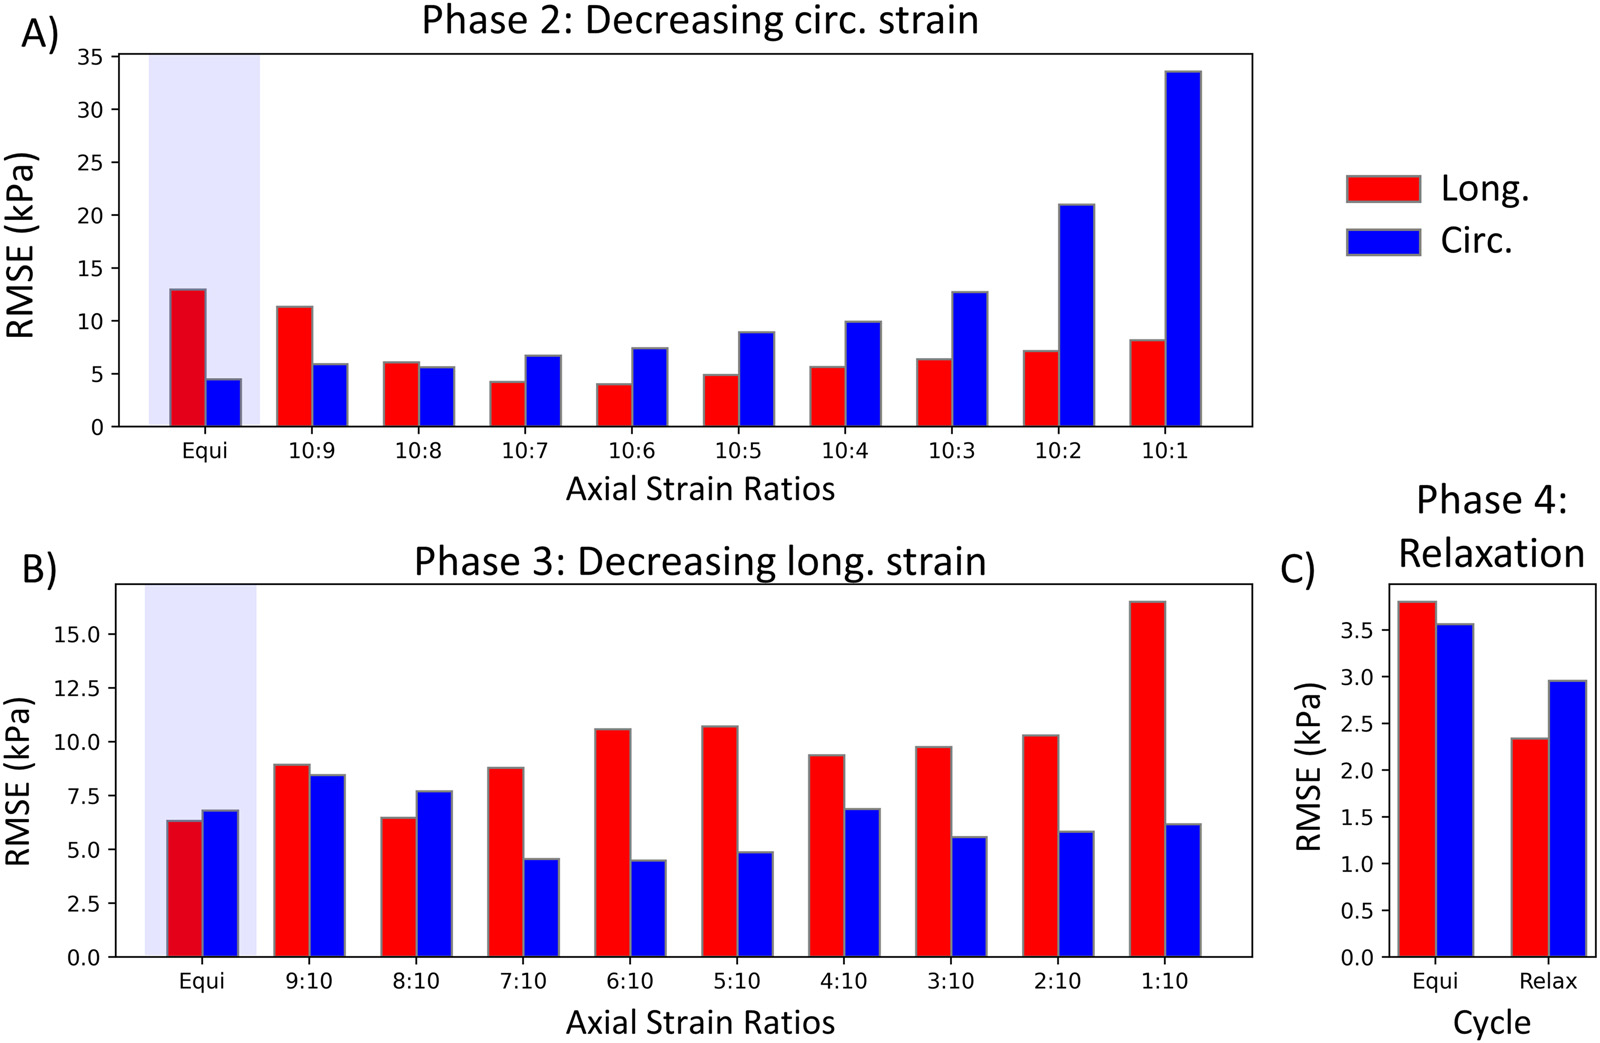
High failure rates present challenges for surgical and interventional therapies for peripheral artery disease of the femoropopliteal artery (FPA). The FPA's demanding biomechanical environment necessitates complex interactions with repair devices and materials. While a comprehensive understanding of the FPA's mechanical characteristics could improve medical treatments, the viscoelastic properties of these muscular arteries remain poorly understood, and the constitutive model describing their time-dependent behavior is absent. We introduce a new viscoelastic constitutive model for the human FPA grounded in its microstructural composition. The model is capable of detailing the contributions of each intramural component to the overall viscoelastic response. Our model was developed utilizing fractional viscoelasticity and tested using biaxial experimental data with hysteresis and relaxation collected from 10 healthy human subjects aged 57 to 65 and further optimized for high throughput and automation. The model accurately described the experimental data, capturing significant nonlinearity and hysteresis that were particularly pronounced circumferentially, and tracked the contribution of passive smooth muscle cells to viscoelasticity that was twice that of the collagen fibers. The high-throughput parameter estimation procedure we developed included a specialized objective function and modifications to enhance convergence for the common exponential-type fiber laws, facilitating computational implementation. Our new model delineates the time-dependent behavior of human FPAs, which will improve the fidelity of computational simulations investigating device-artery interactions and contribute to their greater physical accuracy. Moreover, it serves as a useful tool to investigate the contribution of arterial constituents to overall tissue viscoelasticity, thereby expanding our knowledge of arterial mechanophysiology. STATEMENT OF SIGNIFICANCE: The demanding biomechanical environment of the femoropopliteal artery (FPA) necessitates complex interactions with repair devices and materials, but the viscoelastic properties of these muscular arteries remain poorly understood with the constitutive model describing their time-dependent behavior being absent. We hereby introduce the first viscoelastic constitutive model for the human FPA grounded in its microstructures. This model was tested using biaxial mechanical data collected from 10 healthy human subjects between the ages of 57 to 65. It can detail the contributions of each intramural component to the overall viscoelastic response, showing that the contribution of passive smooth muscle cells to viscoelasticity is twice that of collagen fibers. The usefulness of this model as tool to better understand arterial mechanophysiology was demonstrated.

Keywords: Constitutive modeling; Human femoropopliteal artery; Nonlinear elasticity,; Tissue mechanics; Viscoelasticity.


Conflict of interest statement

Declaration of Competing Interest The authors declare that they have no known competing financial interests or personal relationships that could have appeared to influence the work reported in this paper.

Figures

Fig. A.1.
Fig. A.1.
Flowchart of the algorithm for filtering data. 𝒴tj is the interpolation of yj at tj.
Fig. A.2.
Fig. A.2.
A) Filtered results for data with outliers. B) Filtered results for noisy data.
Fig. B.1.
Fig. B.1.
Example best fit A) without the weights in Eq. (21) and B) with only the protocol-specific part of the weights.
Fig. B.2.
Fig. B.2.
Example showing discrepancy occurring in the data from testing. A) Shows the full protocol over time; the redundant equibiaxial loading curves at B) and C) are used to show differences in the curves. Weights are used to bias the fit to curve C).
Fig. B.3.
Fig. B.3.
The number of specimens that converged to the best-fit values. The scaled fiber model (Eq. (12)) is shown in blue, and the normal fiber model (Eq. 8) is shown in red. (For interpretation of the references to color in this figure legend, the reader is referred to the web version of this article.)
Fig. 1.
Fig. 1.
Structural composition of the human femoropopliteal artery (FPA) from a representative middle-aged subject with longitudinally-oriented elastic fibers in the external elastic lamina (first row, Verhoeff-Van Gieson stain, elastin is black) and circumferential smooth muscle cells (SMCs) in the media (second row, Masson’s Trichrome stain, SMCs are red), surrounded by medial collagen (blue) and two diagonally-oriented families of collagen type I fibers in the adventitia (third row, multiphoton microscopy, second harmonic generation signal (blue)). (For interpretation of the references to color in this figure legend, the reader is referred to the web version of this article.)
Fig. 2.
Fig. 2.
Graphical representation of the loading protocols showing the stretch λl in the longitudinal direction and λc in the circumferential direction of each cycle. There are four phases: preconditioning, decreasing ratios of circumferential stretch, decreasing ratios of longitudinal stretch, and stress relaxation. Black curves are simulated, but only the blue curves are used in parameter estimation. (For interpretation of the references to color in this figure legend, the reader is referred to the web version of this article.)
Fig. 3.
Fig. 3.
An illustration of the material axes of the smooth muscle cells (ms), elastin (me), and collagen (mc) used in the model: A) relative to the intact specimen, B) showing the tissue components, and C) relative to the Cartesian coordinate for mechanical testing eˆ. The color and subscript correspond to the components: collagen (green, c), elastin (blue, e), and SMCs (red, s). (For interpretation of the references to color in this figure legend, the reader is referred to the web version of this article.)
Fig. 4.
Fig. 4.
Illustration of how varying the modulus μk and exponent bk of the fiber model (Eq. (8)) changes after applying the scaling (Eq. (14)). A) Changes in the stress-strain curve as the modulus (μk and the equivalent scaled modulus μk*) is varied. B) Changes in the stress-strain curve as the exponent bk is varied. The local contours for the objective function with C) the original (Eq. (8)) and D) the scaled models (Eq. (14)) are also shown.
Fig. 5.
Fig. 5.
Representative fit of the experimental data: A) Data versus fit over time for all loading cycles after preconditioning, including the unfitted cycles. B) Best fit for the last equibiaxial loading cycle (blue shaded curve in A) illustrating the hysteresis and contribution of each tissue component. Sl is the second Piola-Kirchhoff stress in the longitudinal direction, and Sc is the stress in the circumferential direction, while λl and λc are the stretches in the longitudinal and circumferential directions, respectively.
Fig. 6.
Fig. 6.
Individual fits for individual loading curves with different axial strain ratios: A) Phase 2 with decreasing circumferential strain. B) Phase 3 with decreasing longitudinal strain. Sl is the second Piola-Kirchhoff stress in the longitudinal direction, while El and Ec are the Green-Lagrange strains in the longitudinal and circumferential directions, respectively.
Fig. 7.
Fig. 7.
Best-fit stress-strain curve of the last equibiaxial protocol with separate contributions, if the reference state is assumed to be A) before preconditioning, B) before the first equibiaxial protocol, and C) before the second equibiaxial protocol. Sl is the second Piola-Kirchhoff stress in the longitudinal direction, and Sc is the stress in the circumferential direction, while El and Ec are the Green Lagrange strains in the longitudinal and circumferential directions, respectively. (For interpretation of the references to color in this figure legend, the reader is referred to the web version of this article.)
Fig. 8.
Fig. 8.
The root mean squared error (RMSE) of the individual loading cycles for the representative specimen in Fig. 5: A) RMSE for the loading cycles in phase 2 of Fig. 2, where the circumferential strain decreases cycle by cycle. B) RMSE for the loading cycles in phase 3, where the longitudinal strain decreases. C) RMSE for the loading cycles in phase 4, where the relaxation testing was performed. Red bars represent the RMSE for the longitudinal stress, while blue bars represent the circumferential stress. The blue-shaded loading curves were not used for fitting. (For interpretation of the references to color in this figure legend, the reader is referred to the web version of this article.)

References

    1. Aday AW, Matsushita K, Epidemiology of peripheral artery disease and polyvascular disease, Circ. Res. 128 (12) (2021) 1818–1832, doi: 10.1161/CIRCRESAHA.121.318535. Publisher: American Heart Association; - DOI - PMC - PubMed
    1. Criqui MH, Aboyans V, Epidemiology of peripheral artery disease, Circ. Res. 116 (9) (2015) 1509–1526, doi: 10.1161/CIRCRESAHA.116.303849. ISBN: 9781437729306 - DOI - PubMed
    1. Mahoney EM, Wang K, Keo HH, Duval S, Smolderen KG, Cohen DJ, Steg G, Bhatt DL, Hirsch AT, Vascular hospitalization rates and costs in patients with peripheral artery disease in the United States, Circ. Cardiovasc. Qual. Outcomes 3 (6) (2010) 642–651, doi: 10.1161/CIRCOUTCOMES.109.930735. Publisher: Lippincott Williams & Wilkins Hagerstown, MD; - DOI - PubMed
    1. Schulze-Bauer CAJ, Regitnig P, Holzapfel GA, Mechanics of the human femoral adventitia including high-pressure response, Am. J. Physiol.-HeartCirc. Physiol. 282 (2002) H2427–H2440, doi: 10.1152/ajpheart.00397.2001. - DOI - PubMed
    1. Kamenskiy A, Seas A, Deegan P, Poulson W, Anttila E, Sim S, Desyatova A, MacTaggart J, Constitutive description of human femoropopliteal artery aging, Biomech. Model. Mechanobiol. 16 (2) (2016) 681–692, doi: 10.1007/s10237-016-0845-7. Publisher: Springer Berlin Heidelberg; - DOI - PMC - PubMed

Publication types