. 2023 Oct 25;43(43):7130-7148.
doi: 10.1523/JNEUROSCI.0428-23.2023. Epub 2023 Sep 12.

Layer 5 Intratelencephalic Neurons in the Motor Cortex Stably Encode Skilled Movement

Affiliations

Layer 5 Intratelencephalic Neurons in the Motor Cortex Stably Encode Skilled Movement

Takanori Shinotsuka et al. J Neurosci. .

Abstract

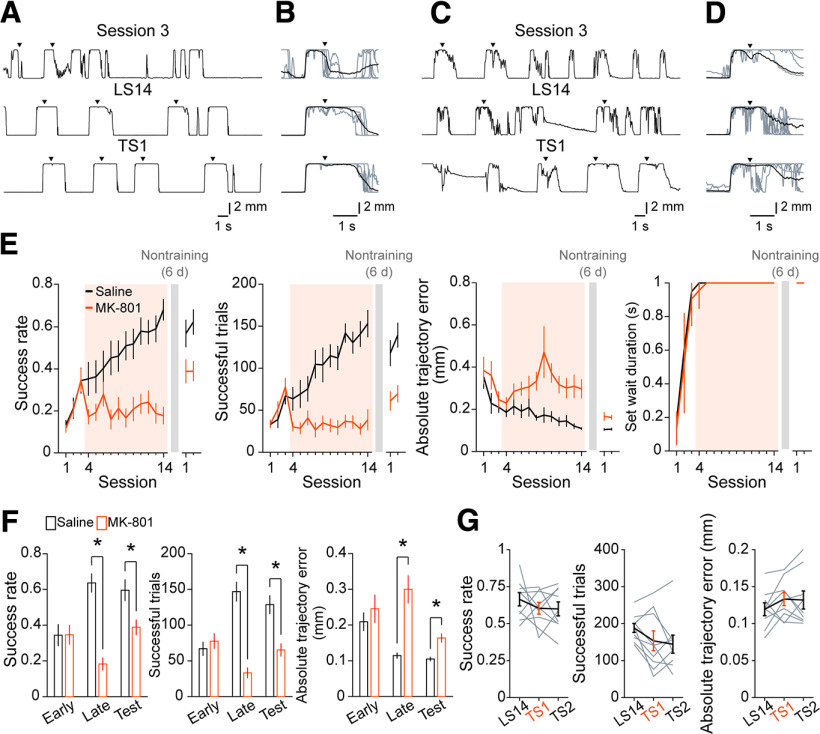
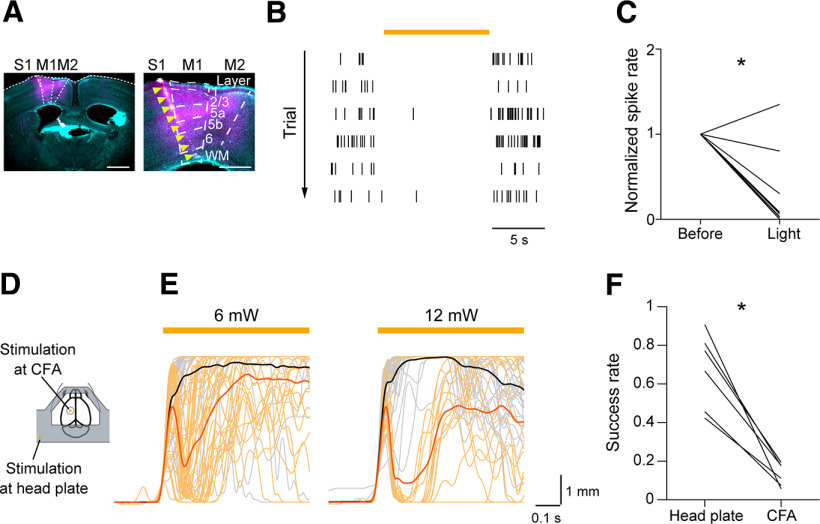
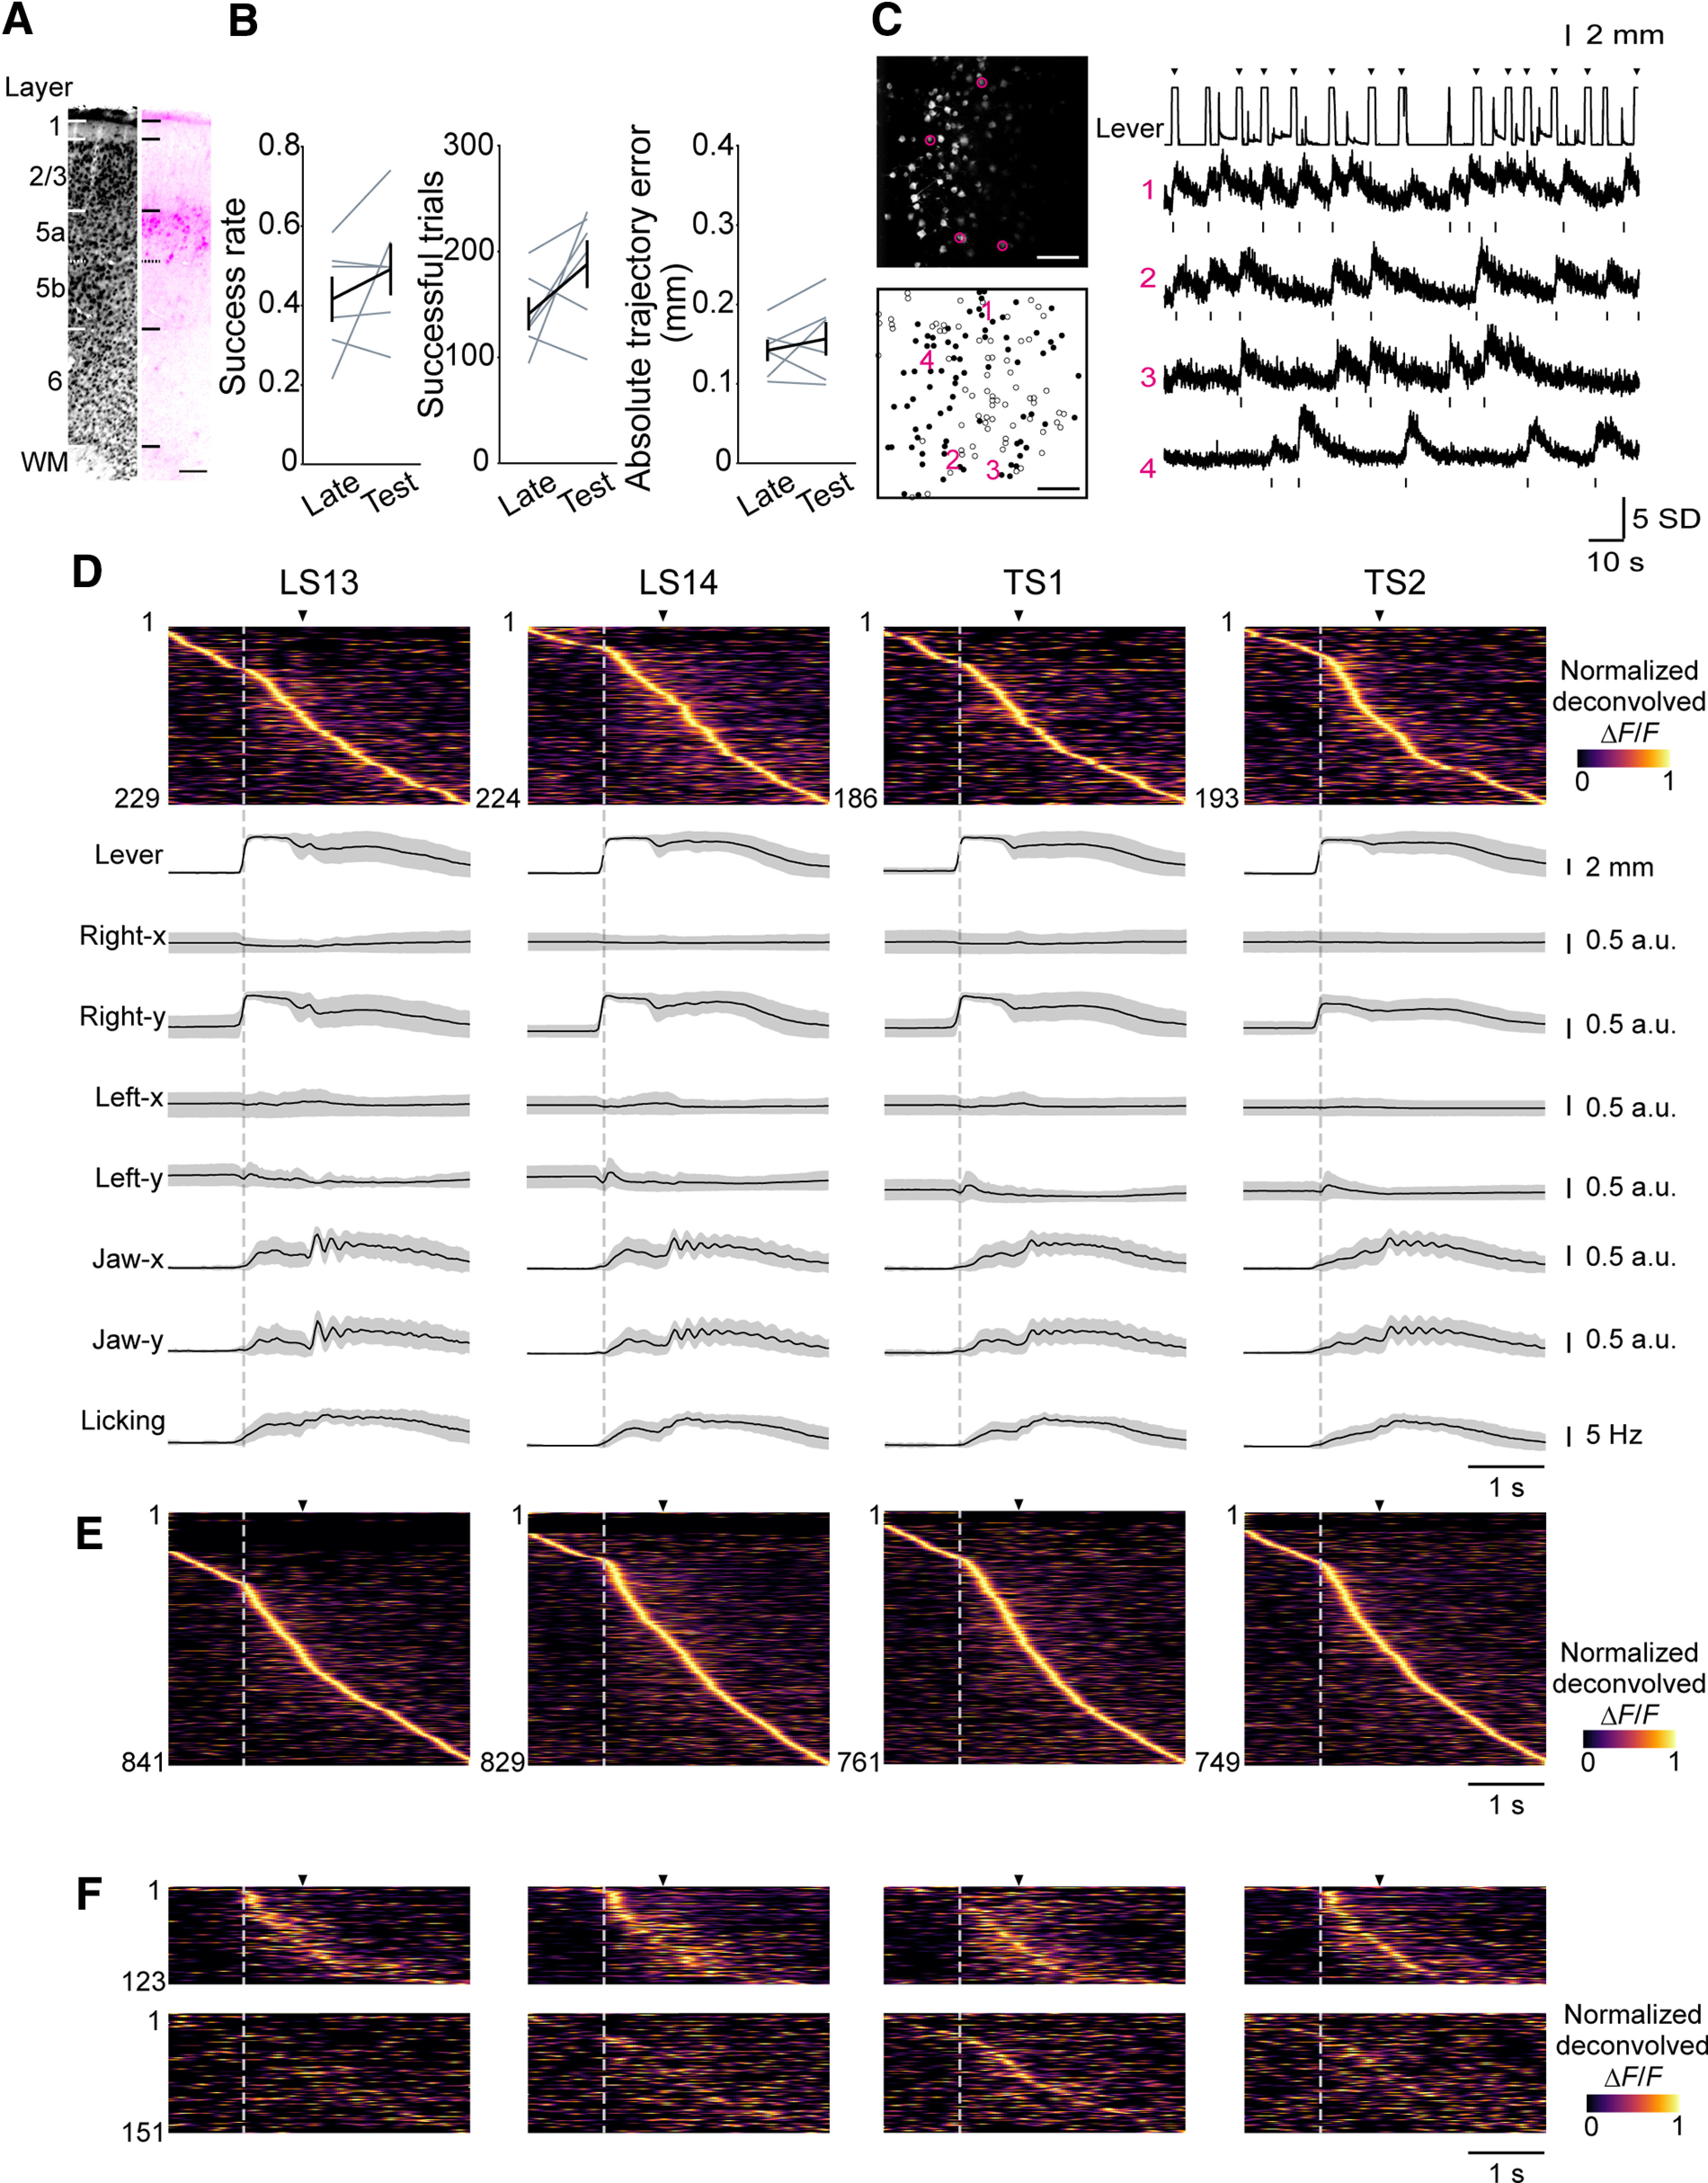
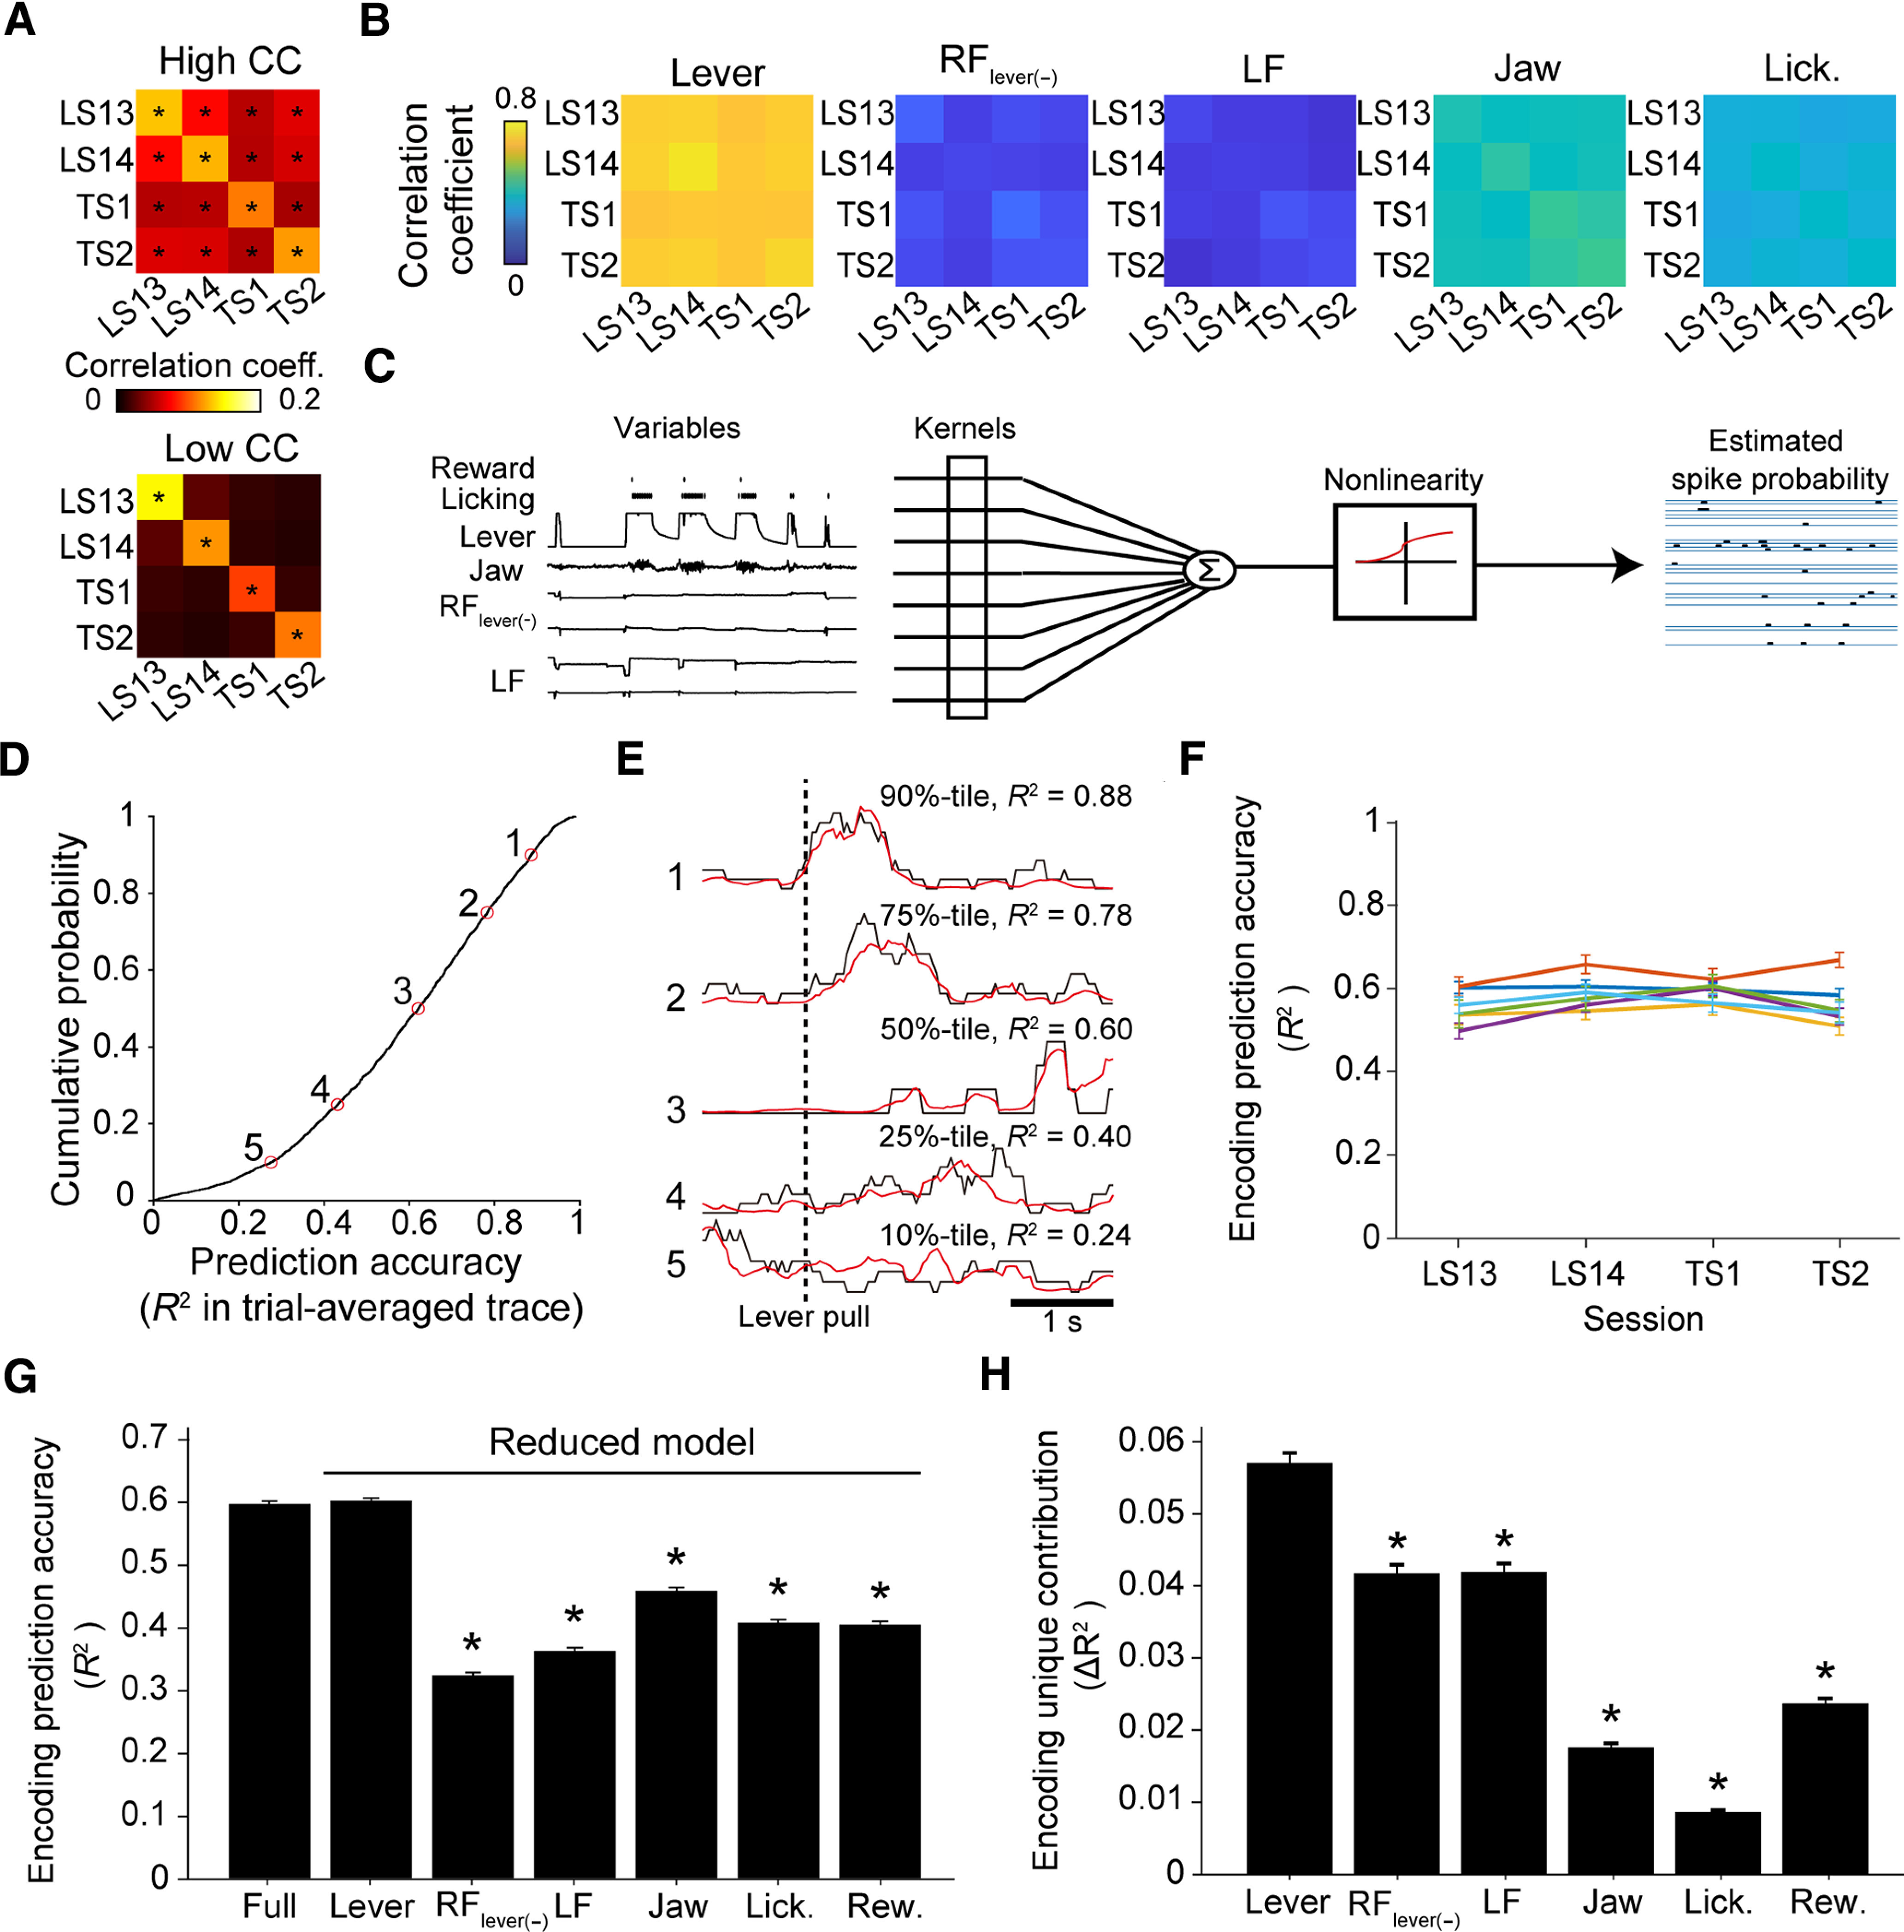
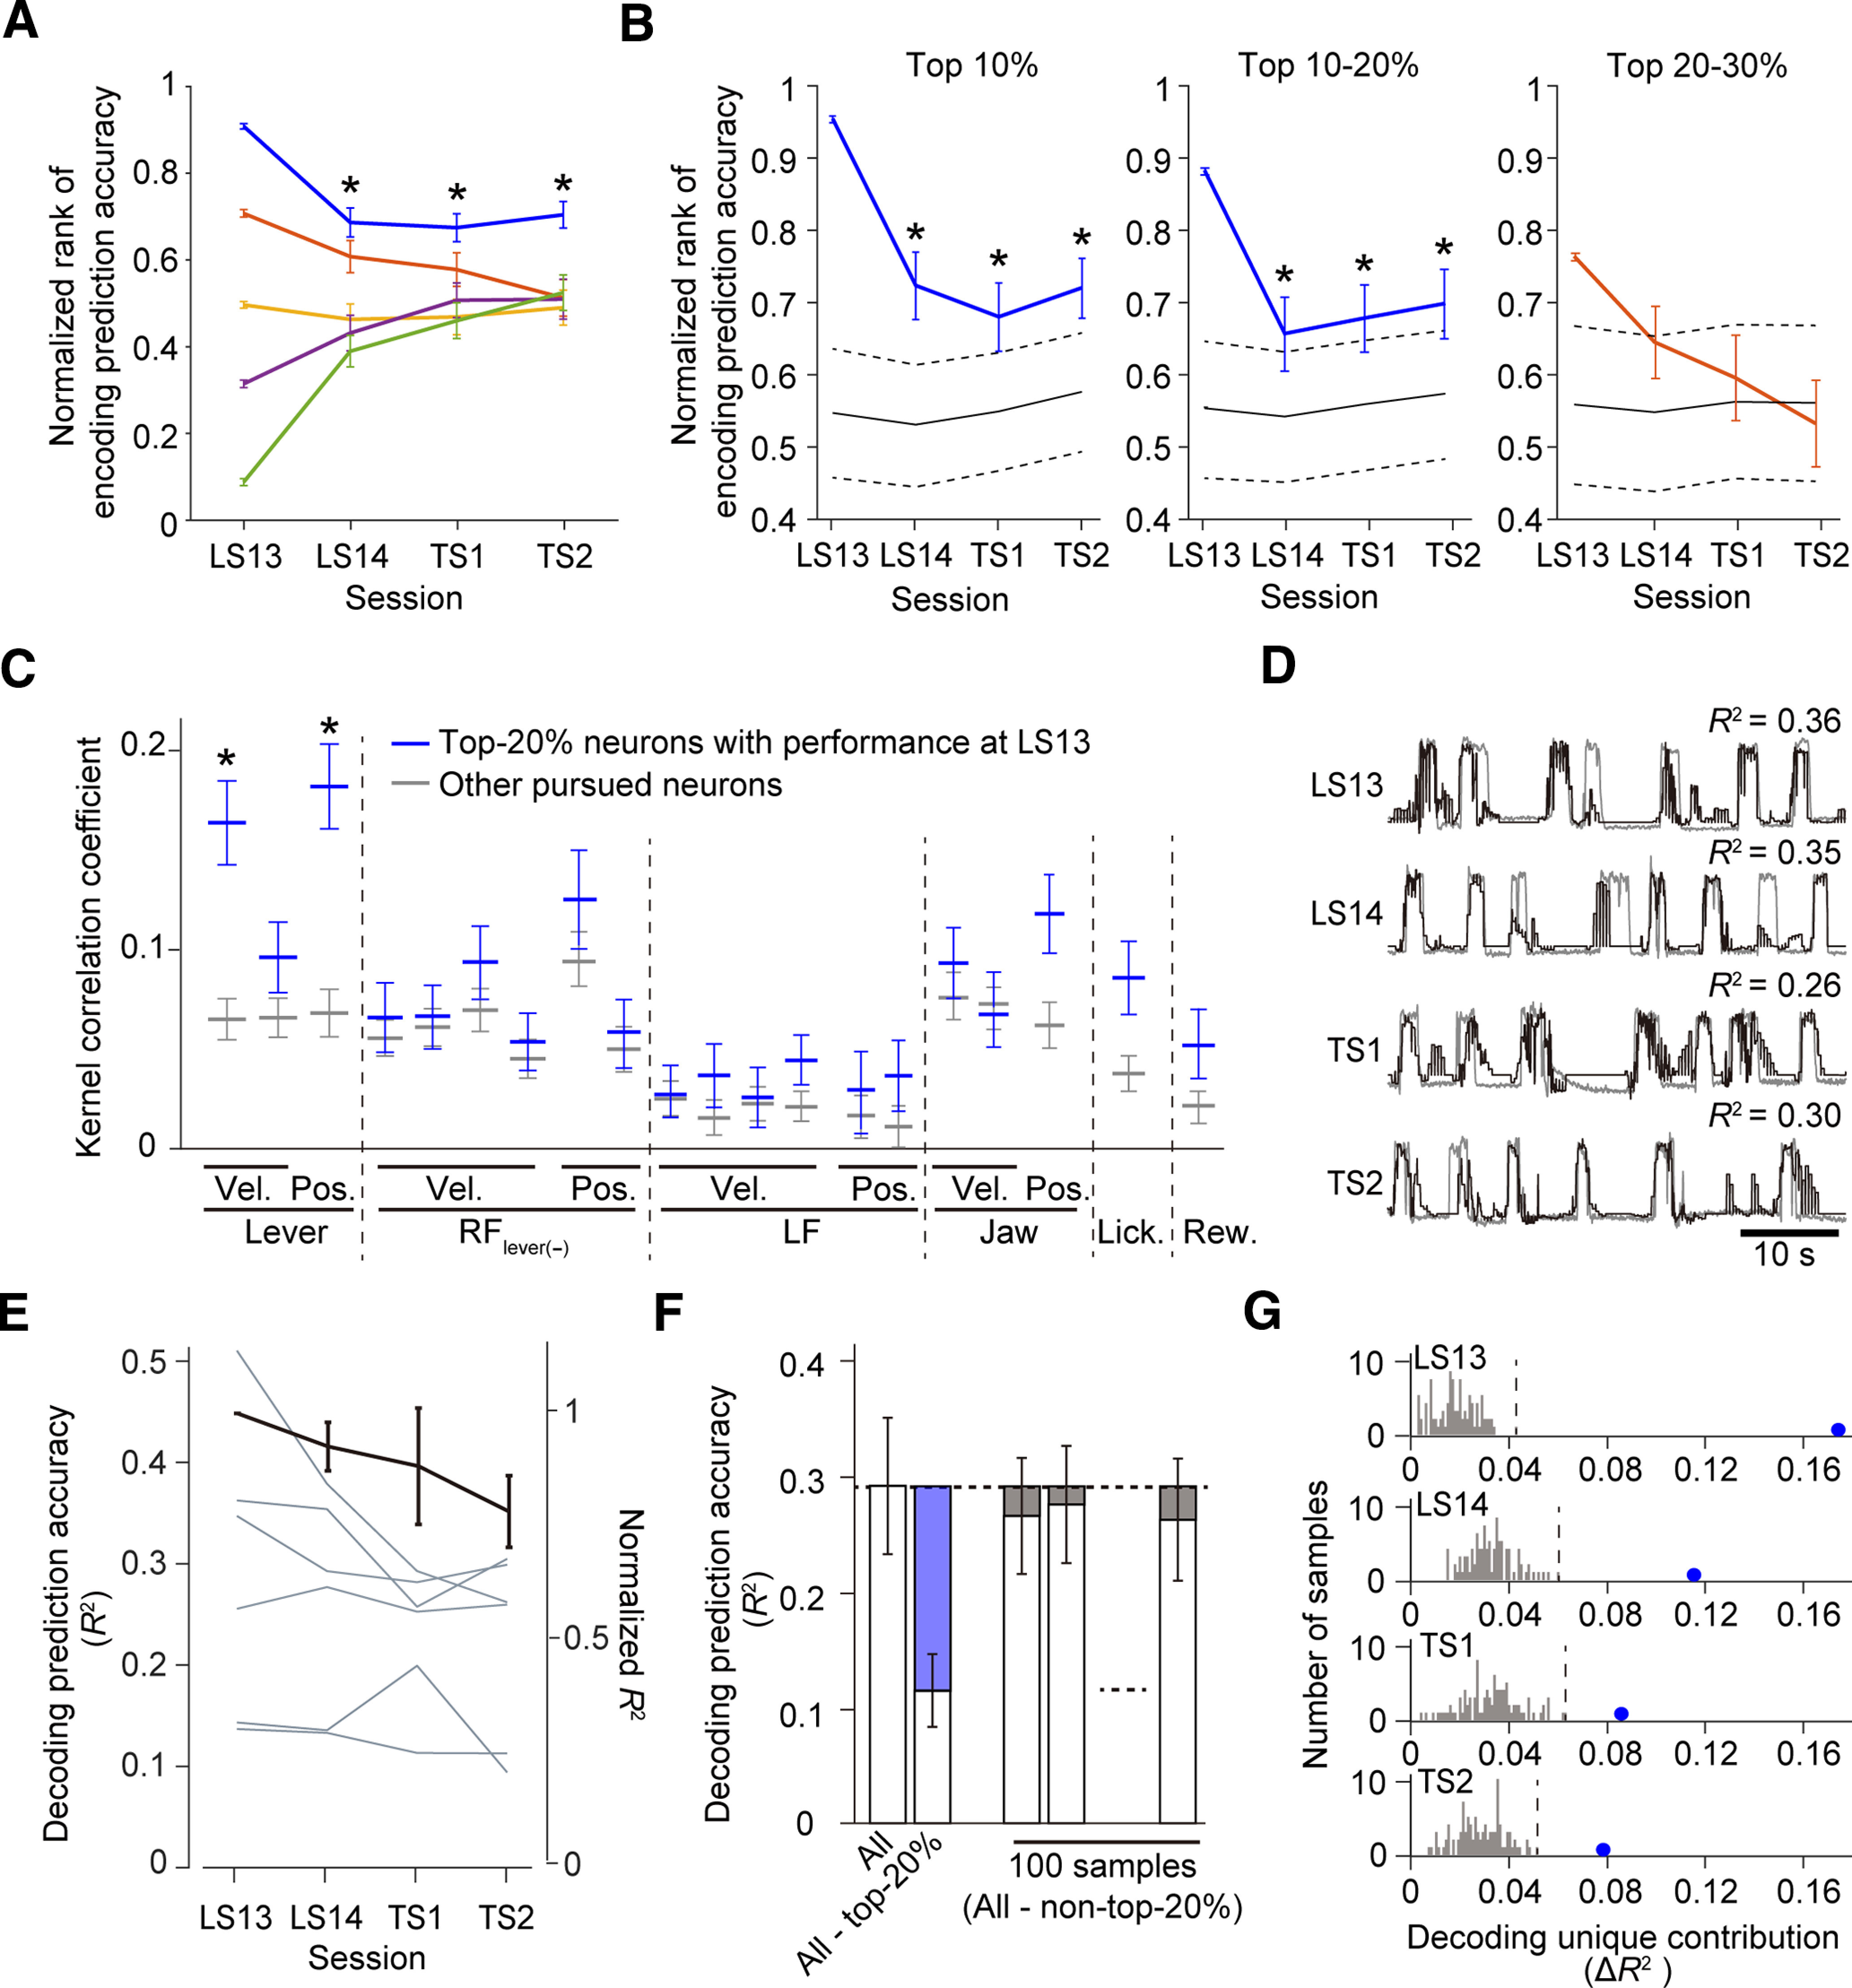
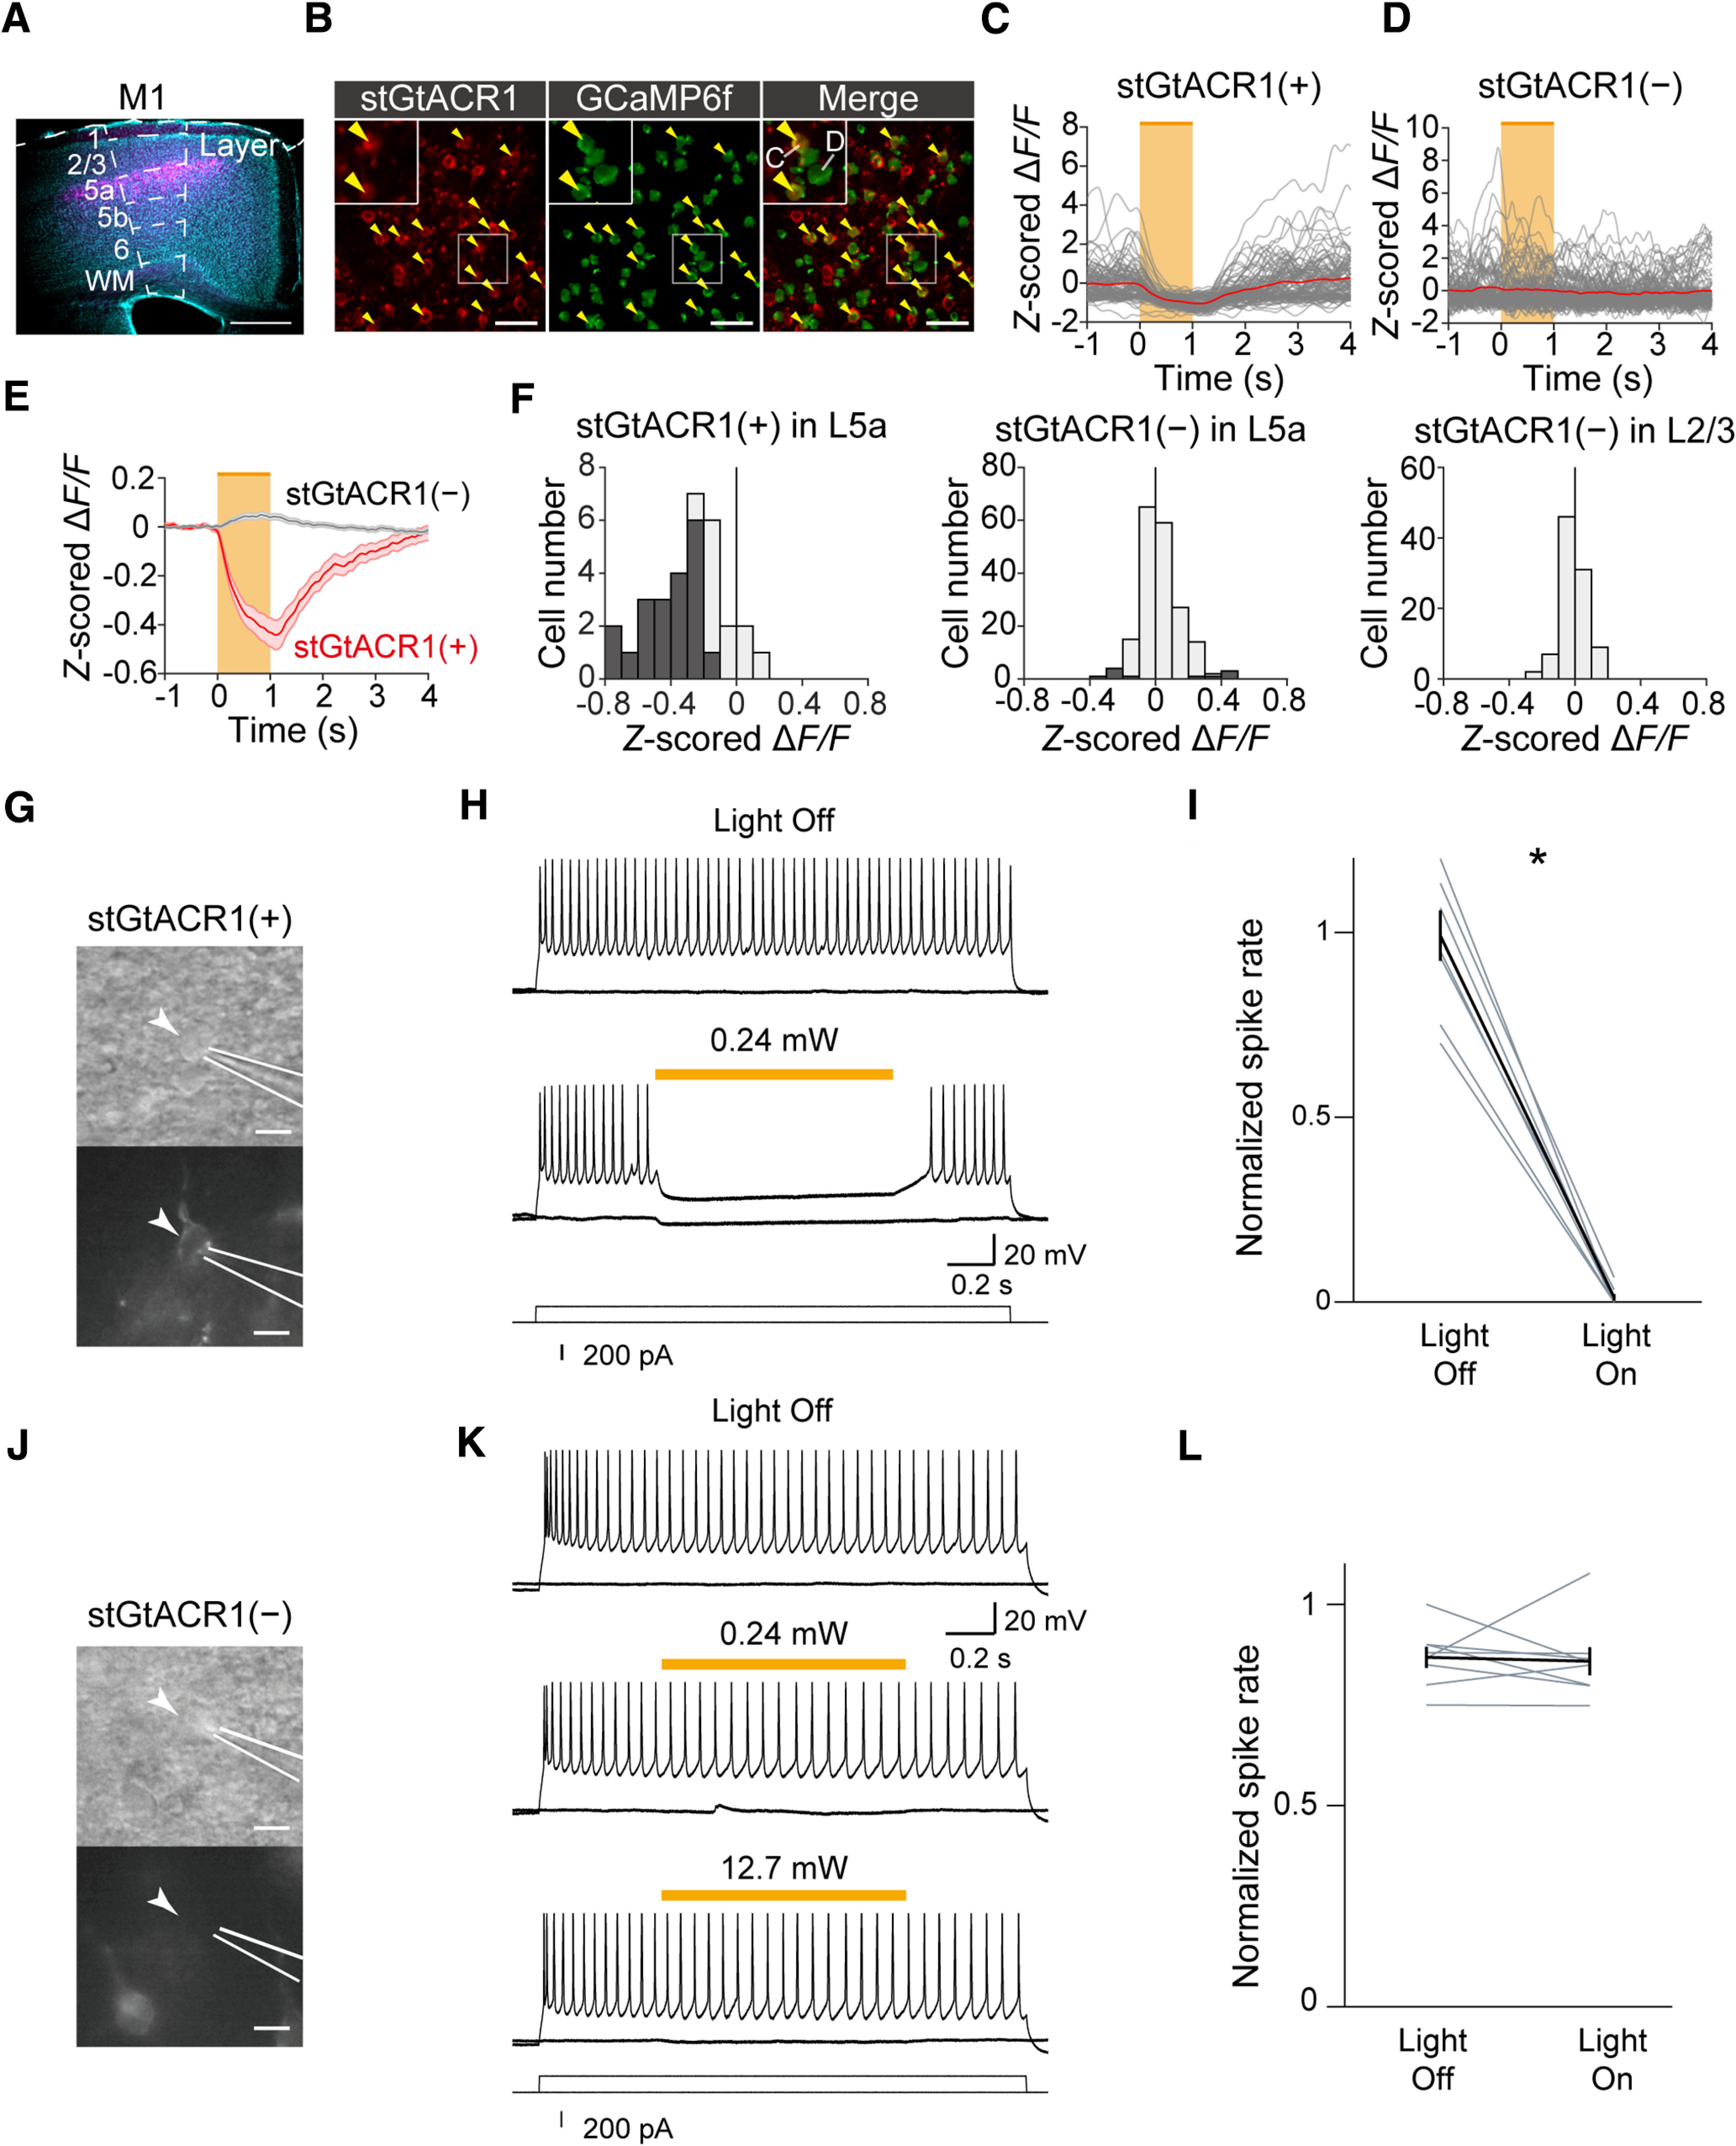
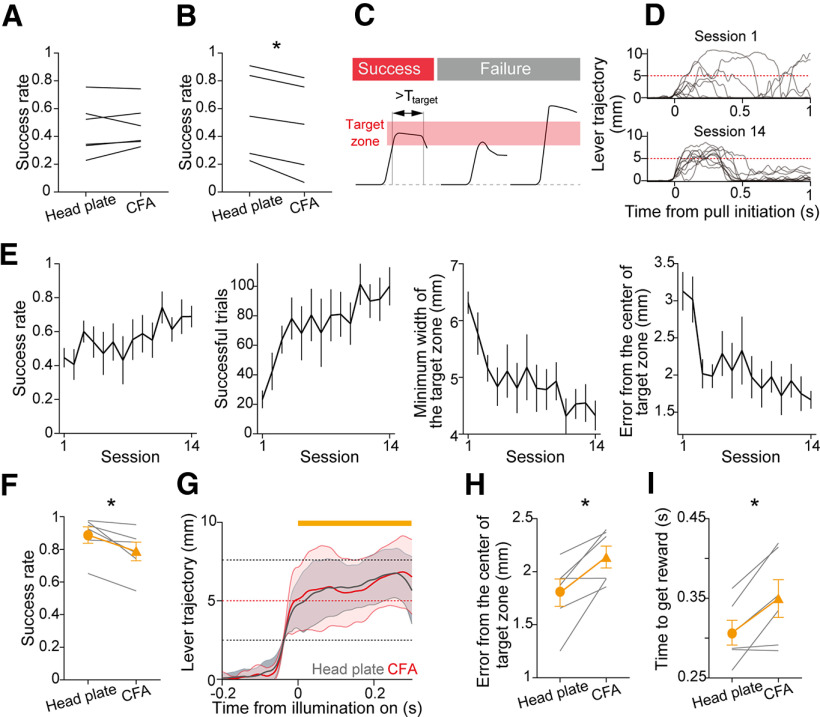
The primary motor cortex (M1) and the dorsal striatum play a critical role in motor learning and the retention of learned behaviors. Motor representations of corticostriatal ensembles emerge during motor learning. In the coordinated reorganization of M1 and the dorsal striatum for motor learning, layer 5a (L5a) which connects M1 to the ipsilateral and contralateral dorsal striatum, should be a key layer. Although M1 L5a neurons represent movement-related activity in the late stage of learning, it is unclear whether the activity is retained as a memory engram. Here, using Tlx3-Cre male transgenic mice, we conducted two-photon calcium imaging of striatum-projecting L5a intratelencephalic (IT) neurons in forelimb M1 during late sessions of a self-initiated lever-pull task and in sessions after 6 d of nontraining following the late sessions. We found that trained male animals exhibited stable motor performance before and after the nontraining days. At the same time, we found that M1 L5a IT neurons strongly represented the well-learned forelimb movement but not uninstructed orofacial movements. A subset of M1 L5a IT neurons consistently coded the well-learned forelimb movement before and after the nontraining days. Inactivation of M1 IT neurons after learning impaired task performance when the lever was made heavier or when the target range of the pull distance was narrowed. These results suggest that a subset of M1 L5a IT neurons continuously represent skilled movement after learning and serve to fine-tune the kinematics of well-learned movement.SIGNIFICANCE STATEMENT Motor memory persists even when it is not used for a while. IT neurons in L5a of the M1 gradually come to represent skilled forelimb movements during motor learning. However, it remains to be determined whether these changes persist over a long period and how these neurons contribute to skilled movements. Here, we show that a subset of M1 L5a IT neurons retain information for skilled forelimb movements even after nontraining days. Furthermore, suppressing the activity of these neurons during skilled forelimb movements impaired behavioral stability and adaptability. Our results suggest the importance of M1 L5a IT neurons for tuning skilled forelimb movements over a long period.

Keywords: encoding/decoding; intratelencephalic neurons; motor cortex; motor learning; skilled forelimb movement; two-photon imaging.


Figures

Figure 1.
Figure 1.
Learning of a self-initiated lever-pull task and performance after the nontraining days with or without NMDA antagonist treatment. A, Lever trajectories in the third learning session (session 3), LS14, and TS1 from a representative mouse in the saline-solution-administered control group. B, Lever trajectories of five consecutive trials (gray) and the mean lever trajectories in successful trials (black) in each session shown in A. Arrowheads indicate the reward timings. C. Lever trajectories in session 3, LS14, and TS1 from a representative mouse in the MK-801-solution-administered group. D, Lever trajectories of five consecutive trials (gray) and the mean lever trajectories in successful trials (black) in each session shown in C. E, Task performance in the learning and test sessions with NMDAR antagonist treatment between the middle and late learning sessions (the fourth to 14th learning sessions). From left to right, success rate, number of successful trials, mean absolute trajectory errors, and minimum set wait duration are shown. Trajectory errors were calculated in successful trials for 0.6 s from the lever-pull initiation from the reference expert lever trajectory which was defined as the mean lever trajectory in successful trials in LS13 and LS14 from mice in the saline solution-administered control group. n = 11 mice in the saline-solution-administered control group, n = 13 mice in the MK-801-solution-administered group. F, A summary of task performance in the early (session 3) and late learning sessions (LS13 and LS14) and test sessions (TS1 and TS2). Left, Mean success rate. Middle, Mean number of successful trials. Right, Mean absolute trajectory errors from the expert lever trajectory in successful trials at 0.6 s from the lever-pull initiation, *p < 0.05 by Welch's t test with Bonferroni correction, n = 11 mice in the saline-solution-administered control group, n = 13 mice in the MK-801-solution-administered group. G, Task performance with NMDAR antagonist treatment in TS1. Left, Success rate, p > 0.05 across sessions, paired t test with Bonferroni correction, n = 9 mice. Middle, Number of successful trials, p > 0.05 across sessions, paired t test with Bonferroni correction, n = 9 mice. Right, Mean absolute trajectory errors in successful trials, p > 0.05 across sessions, paired t test with Bonferroni correction, n = 9 mice.
Figure 2.
Figure 2.
Inhibition of skilled lever pulls caused by CFA optogenetic manipulations in the test sessions. A, Left, Histological image of the Neuropixels 1.0 probe tract in a coronal section including the CFA that was 0.2 mm anterior to the bregma. Cyan indicates neurons labeled with NeuroTrace. Magenta indicates stGtACR1-FusionRed-expressing neurons. The Neuropixels 1.0 probe was labeled with CM-Dil (indicated by yellow arrowheads). Scale bar, 1 mm. Right, Magnification of the image on the left. Scale bar, 0.5 mm. WM, white matter. B, Raster plots of spikes from a representative M1 L5 unit in six light illumination trials at 12 mW. The orange bar indicates the light illumination. C, A summary of normalized spike rates of M1 L5 units before and during light illumination, *p = 6.4 × 10⁻⁴ by paired t test, n = 10 units. D, Schematic image of the light illumination sites on the head plate and CFA. E, Left, Lever traces in optogenetic stimulation trials at 6 mW. Lever traces in the head plate illumination trials (n = 37 trials, black) and in the CFA illumination trials (n = 34 trials, orange) from a representative mouse. Right, Lever traces in optogenetic stimulation trials at 12 mW. Lever traces in the head plate illumination trials (n = 40 trials, black) and in the CFA illumination trials (n = 16 trials, orange) from a representative mouse, the same mouse as on the left. Mean lever trajectories in each type of trial are shown as thick lines. The orange bar indicates light illumination. F, Summary of the success rate in the head plate illumination trials and the CFA illumination trials at 6 mW, *p = 1.0 × 10⁻³ by paired t test, n = 6 sessions from 3 mice.
Figure 3.
Figure 3.
Longitudinal two-photon calcium imaging of CFA L5 IT neurons. A, Histological image of jRGECO1a expressed in a representative Tlx3-Cre mouse. Left, Neurons labeled with NeuroTrace. Right, Neurons expressing jRGECO1a. Scale bar, 100 µm. WM, white matter. B, A summary of task performance in the late learning sessions (LS13 and LS14) and test sessions (TS1 and TS2). Left, Mean success rate, p = 0.27 by paired t test. Middle, Mean number of successful trials, p = 0.14 by paired t test. Right, Mean absolute trajectory errors in successful trials of the expert lever trajectory at 0.6 s from the lever-pull initiation, p = 0.42 by paired t test, n = 6 mice. C, Left, Frame-averaged two-photon image of L5a IT neurons expressing jRGECO1a in the CFA from a representative mouse (top). ROIs extracted by the CaImAn algorithm. Left, Neurons tracked throughout the imaging sessions (pursued neurons) are shown as black circles, and other neurons are shown as white circles (bottom). Scale bar, 100 µm. Right, Representative lever trajectories and ΔF/F traces of neurons 1–4 in the left images. Frames with the deconvolved calcium activity are shown in raster plots below each trace. Arrowheads indicate the reward timings. D, Trial-averaged deconvolved calcium traces (normalized) of CFA L5a IT neurons and movements of body parts (lever, right forelimb, left forelimb, jaw, and licking) from a representative mouse aligned to lever-pull initiation of successful trials (gray dotted line). Arrowheads indicate reward timings. E, Trial-averaged deconvolved calcium traces (normalized) of CFA L5a IT neurons pooled from six mice and aligned to the lever-pull initiation of successful trials. F, Trial-averaged deconvolved calcium traces (normalized) of CFA L5a IT pursued neurons aligned to the lever-pull initiation of successful trials (n = 274 cells from 6 mice). Top, The mean sorted deconvolved calcium traces (normalized) of the fraction of pursued neurons whose mean correlation of trial-averaged deconvolved calcium traces (normalized) across imaging sessions was higher than that of the 95th percentile of random shuffling (the 95th percentile of the correlation coefficient was 0.136, n = 123 neurons). Bottom, The mean sorted deconvolved calcium traces (normalized) of the remaining fraction of pursued neurons (n = 151 neurons). The order of neurons is the same across sessions.
Figure 4.
Figure 4.
Lever movement was well encoded in CFA L5a IT neurons during the motor task. A, Correlation coefficients of the activities of pursued neurons. Top, The average correlation coefficient of the neurons shown in Figure 3F (top; n = 123 neurons). Bottom, The correlation coefficients of neurons shown in Figure 3F (bottom; n = 151 neurons). The correlation coefficients were averaged across 1000 randomly selected trial-by-trial correlations from before 1 s to after 3 s relative to the lever-pull initiation (*p < 0.05 vs time-shifted control). B, Correlation coefficients of task variables averaged across 1000 randomly selected trial-by-trial correlations (1000 instances from each of six mice). C, Schemes of the encoding model of L5a IT neurons during the lever-pull task. D, Cumulative probability of the accuracy of the mean binarized activity aligned with lever-pull initiation that was predicted by the encoding models using all variables. Only neurons that were reconstructed by the encoding models with higher prediction accuracy (cross-validated log likelihood per frame; see above, Materials and Methods) than the null model are plotted (n = 2790 neurons). E, Mean traces across trials for deconvolved calcium traces (binarized, black), and binarized activity (red) for five representative neurons. The same numerical figures in D and E indicate data from the same neuron. F, The variance in the encoding prediction accuracy across animals and days. Different colored lines indicate different mice. Although statistical significance was found in 68/276 possible comparisons (between 6 mice and 4 d; p < 0.05, t tests with Bonferroni correction), the absolute differences were small overall [0.14 at most, 0.046 ± 0.034 (mean ± SD), n = 276 comparisons]. G, The encoding prediction accuracy of the full model (Full). The encoding prediction accuracies of the models with variables in a single category are also shown (Lever, prediction accuracy for the model with only 3 lever-related variables; RFlever(-) for the model with only 6 RF-related variables; LF for the model with only 6 LF-related variables; Jaw for the model with only 3 jaw-related variables; Lick. for the model with only licking timing; Rew. for the model with only reward timing, n = 2790 neurons; *p < 0.05 vs full model, signed-rank test with Bonferroni correction). H, Unique encoding contributions (ΔR2) of single-category variables, calculated by subtracting the prediction accuracy from that of the corresponding full model (e.g., the unique contribution for Lever was calculated by subtracting the model with 17 variables other than the 3 lever-related variables; n = 2790 neurons; *p < 0.05 vs Lever, signed-rank test with Bonferroni correction).
Figure 5.
Figure 5.
A subset of CFA L5a IT neurons stably encoded the learned motor skill after the nontraining days. A, Normalized rankings of the five groups of pursued neurons in the four imaging sessions. Five groups were determined according to the normalized rankings among the pursued and nonpursued neurons in each imaging field in LS13. The top 20% neurons maintained their rank in the field (blue; n = 81 neurons). Other neurons quickly merged to ∼0.5 (orange, neurons with a normalized rank of 0.6–0.8 at LS13, n = 49 neurons; yellow, neurons with a normalized rank of 0.4–0.6 at LS13, n = 48 neurons; purple, neurons with a normalized rank of 0.2–0.4 at LS13, n = 44 neurons; green, neurons with a normalized rank of 0–0.2 at LS13, n = 52 neurons). The statistical significance (asterisks) of the top 20% neurons was determined as follows. In each LS14, TS1, and TS2, the average normalized rank was calculated 10,000 times with randomly selected populations of the same size as the top 20% neurons. When the normalized rank exceeded the 97.5th percentile of the distribution in the 10,000 instances, it was taken as being statistically significant. B, Normalized rankings of the top 10% (left), top 10–20% (middle), and top 20–30% (right) neurons in the four imaging sessions. Either a blue or orange line shows the averaged encoding performance of the neurons in question (left, n = 41 neurons; middle, 40; right, 27). In each LS14, TS1, and TS2, the average normalized rank was calculated 10,000 times with randomly chosen populations of the same size as the corresponding group of neurons. Black solid lines show the average of 10,000 repetitions for the encoding performance of the randomly chosen neurons. Black dashed lines show 97.5% tile and 2.5% tile of the averaged performance of 10,000 samples. Statistical significance (asterisks) was determined by whether the blue line exceeded the black dashed line. Note that the comparison was based on the mean values but not on the SE bars of the blue line. C. The correlations of the encoding kernels (blue, top 20% neurons, n = 81; gray, the other pursued neurons, n = 193 neurons; *p < 0.05 by t test, between blue and gray, with Bonferroni correction). D, Representative traces of recorded (gray) and predicted (black) lever trajectories (decoded with 33 pursued neurons). E, Daily variations in the decoding prediction accuracy of each mouse are shown by gray lines (each field contained 57, 41, 39, 78, 26, or 33 pursued neurons, scale on the left axis). The black line represents the normalized mean across mice (n = 6 mice, scale on the right axis; p > 0.14 between days and p > 0.17 between mice by one-way ANOVA). F, Schematic of the calculation of decoding unique contributions (ΔR2) using data from LS13 (6 mice). The blue part of the second column displays ΔR2 of the top 20% neurons, which was defined as the difference between the decoding performance (R2) of all pursued neurons (far left column) and that of the pursued neurons other than the top 20% neurons (second column, white part). The first three columns exemplify control samples. The gray parts show ΔR2 of the subpopulations that were randomly chosen from the nontop 20% neurons that were defined as neurons with a normalized rank of 0–0.8 in LS13. The number of chosen neurons was the same as that for the top 20% neurons. To obtain the distribution of ΔR2 of subpopulations without the top 20% neurons, the random sampling and calculation were repeated 100 times. G, Histogram of ΔR2 of the nontop 20% neurons (gray, 100 samples) with ΔR2 of the top 20% neurons (blue dot, the average across 6 mice) in each session. Each dashed line indicates the highest ΔR2 of the nontop 20% neurons in each session.
Figure 6.
Figure 6.
CFA L5a IT neuron-specific optogenetic inactivation. A, A representative coronal image of M1 IT neuron-specific expression of stGtACR1; NeuroTrace (cyan) and stGtACR1-FusionRed (magenta). The image location along the anterior–posterior axis was the same as for the bregma. Scale bar, 0.5 mm. B, Left, Frame-averaged two-photon image of CFA L5a IT neurons expressing stGtACR1-FusionRed. Middle, ROIs of GCaMP6f-expressing neurons that were extracted with the CaImAn algorithm. Right, Merged left and middle images. Scale bar, 50 µm. The yellow arrows indicate the neurons that express both stGtACR1-FusionRed and GCaMP6f [stGtACR1(+) neurons]. Insets, Enlarged view of the area indicated by the smaller white rectangle. C, Representative calcium traces (z-scored ΔF/F) of stGtACR1(+) neurons shown in B when the 594 nm light was illuminated (orange). The traces were sorted to the onset of light stimulation. Each gray trace was from each trial, and red traces are the average of all trials. D, Representative calcium traces (z-scored ΔF/F) of the GCaMP6f-expressing neurons shown in B that did not express stGtACR1-FusionRed [stGtACR1(–) neurons] when the 594 nm light was illuminated (orange). E, Average response to 594 nm light stimulation of stGtACR1(+) neurons (n = 31) and stGtACR1(–) neurons (n = 190) in CFA L5a. F, Histogram of the difference between z-scored ΔF/F during the light stimulation (from 0 to 1 s after the onset of light stimulation) and the baseline (from −1 to 0 s before the onset of light stimulation) in L5a stGtACR1(+) neurons (left), L5a stGtACR1(–) neurons (middle), and L2/3 stGtACR1(–) neurons (right, n = 95). All were from the CFA L2/3 stGtACR1(–) neurons that were imaged above the field of view where the L5a neurons were imaged. G, Bright-field (top) and fluorescent (bottom) images of a representative whole-cell patch-clamped stGtACR1(+) neuron (arrowhead). White lines indicate the location of the patch pipette. Scale bar, 20 µm. H, Representative traces of the membrane potentials of the stGtACR1(+) neurons with and without light illumination. A current of 200 pA was injected into the recorded neuron for 2 s. The orange bar indicates the 594 nm light illumination period of 1 s. I, Normalized spike rates of stGtACR1(+) neurons before and during the light illumination, *p = 1.7 × 10⁻⁶ by paired t test, n = 8 neurons from seven slices. J, Bright-field (top) and fluorescent (bottom) images of a representative whole-cell patch-clamped stGtACR1(–) neuron (arrowhead). White lines indicate the location of the patch pipette. Scale bar, 20 µm. K, Representative traces of the membrane potential of the stGtACR1(–) neuron with and without light illumination. A current of 200 pA was injected into the recorded neuron for 2 s. The orange bar indicates the 1 s light illumination period. L, Normalized spike rates of stGtACR1(–) neurons before and during light illumination, p = 0.81 by paired t test, n = 8 neurons from 7 slices.
Figure 7.
Figure 7.
CFA IT neuron-specific optogenetic inactivation during skilled lever pulls. A, Summary of the success rate of the self-initiated lever-pull task in head plate and CFA stimulation trials with the CFA IT-specific optogenetic inactivation at 12 mW, p = 0.54 by paired t test, n = 6 sessions from 5 mice. B, Success rate of the self-initiated lever-pull task with CFA IT neuron-specific optogenetic manipulation under the heavier lever weight (0.05 N), *p = 0.005 by paired t test, n = 5 sessions from 5 mice. C, The scheme of the target zone lever-pull task. D, Lever trajectories in the first learning session (session 1) and the 14th learning session (session 14) from a representative mouse (n = 10 trials in each session). E, Task performance in the target zone lever-pull task in the learning sessions. Left to right, The success rate; the number of successful trials; the minimum width of the target zone; the error from the center of the target zone (the 5 mm pull position from baseline), n = 6 mice. F, Summary of the success rate of the target zone lever-pull task in the head plate illumination trials and CFA illumination trials with CFA IT neuron-specific optogenetic manipulation, *p = 0.03 by paired t test, n = 6 sessions from 6 mice. G, The mean lever trajectories of the target zone lever-pull task in the head plate (gray) illumination trials and CFA illumination (red) trials from a representative mouse; mean ± SD. The orange bar indicates light illumination. H, Summary of the mean errors from the center of the target zone for 0.2 s from initiation in the head plate illumination trials and CFA illumination trials, *p = 0.02 by paired t test, n = 6 sessions from 6 mice. I, Summary of the time to obtaining reward in the head plate illumination trials and CFA illumination trials, *p = 0.03 by paired t test, n = 6 sessions from 6 mice.

Similar articles

Cited by

References

    1. Albarran E, Raissi A, Jáidar O, Shatz CJ, Ding JB (2021) Enhancing motor learning by increasing the stability of newly formed dendritic spines in the motor cortex. Neuron 109:3298–3311.e4. 10.1016/j.neuron.2021.07.030 - DOI - PMC - PubMed
    1. Aoki S, Smith JB, Li H, Yan X, Igarashi M, Coulon P, Wickens JR, Ruigrok TJ, Jin X (2019) An open cortico-basal ganglia loop allows limbic control over motor output via the nigrothalamic pathway. Elife 8:e49995. 10.7554/eLife.49995 - DOI - PMC - PubMed
    1. Arthur WJ, Bennett WJ, Stanush PL, McNelly TL (1998) Factors that influence skill decay and retention: a quantitative review and analysis. Hum Perform 11:57–101. 10.1207/s15327043hup1101_3 - DOI
    1. Azim E, Jiang J, Alstermark B, Jessell TM (2014) Skilled reaching relies on a V2a propriospinal internal copy circuit. Nature 508:357–363. 10.1038/nature13021 - DOI - PMC - PubMed
    1. Badreddine N, Zalcman G, Appaix F, Becq G, Tremblay N, Saudou F, Achard S, Fino E (2022) Spatiotemporal reorganization of corticostriatal networks encodes motor skill learning. Cell Rep 39:110623. 10.1016/j.celrep.2022.110623 - DOI - PubMed

Publication types

LinkOut - more resources