. 2023 Nov 8;43(45):7601-7615.
doi: 10.1523/JNEUROSCI.0789-23.2023. Epub 2023 Sep 12.

Voltage- and Calcium-Gated Membrane Currents Tune the Plateau Potential Properties of Multiple Neuron Types

Affiliations

Voltage- and Calcium-Gated Membrane Currents Tune the Plateau Potential Properties of Multiple Neuron Types

Curtis L Neveu et al. J Neurosci. .

Abstract

Many neurons exhibit regular firing that is limited to the duration and intensity of depolarizing stimuli. However, some neurons exhibit all-or-nothing plateau potentials that, once elicited, can lead to prolonged activity that is independent of stimulus intensity or duration. To better understand this diversity of information processing, we compared the voltage-gated and Ca2+-gated currents of three identified neurons from hermaphroditic Aplysia californica Two of these neurons, B51 and B64, generated plateau potentials and a third neuron, B8, exhibited regular firing and was incapable of generating a plateau potential. With the exception of the Ca2+-gated potassium current (I KCa), all three neuron types expressed a similar array of outward and inward currents, but with distinct voltage-dependent properties for each neuron type. Inhibiting voltage-gated Ca2+ channels with Ni+ prolonged the plateau potential, indicating I KCa is important for plateau potential termination. In contrast, inhibiting persistent Na+ (I NaP) blocked plateau potentials, empirically and in simulations. Surprisingly, the properties and level of expression of I NaP were similar in all three neurons, indicating that the presence of I NaP does not distinguish between regular-firing neurons and neurons capable of generating plateau potentials. Rather, the key distinguishing factor is the relationship between I NaP and outward currents such as the delayed outward current (I D), and I KCa We then demonstrated a technique for predicting complex physiological properties such as plateau duration, plateau amplitude, and action potential duration as a function of parameter values, by fitting a curve in parameter space and projecting the curve beyond the tested values.SIGNIFICANCE STATEMENT Plateau potentials are intrinsic properties of neurons that are important for information processing in a wide variety of nervous systems. We examined three identified neurons in Aplysia californica with different propensities to generate a plateau potential. No single conductance was found to distinguish plateau generating neurons. Instead, plateau generation depended on the ratio between persistent Na+ current (I NaP), which favored plateaus, and outward currents such as I KCa, which facilitated plateau termination. Computational models revealed a relationship between the individual currents that predicted the features of simulated plateau potentials. These results provide a more solid understanding of the conductances that mediate plateau generation.

Keywords: Aplysia; KCa; SNNAP; persistent sodium; plateau potential.


Figures

Figure 1.
Figure 1.
Physiologic properties of plateau-generating and regular-spiking neurons. A, Diagram of rostral surface of right buccal ganglion. Neurons were identified by size and position. B, Neurons were isolated and recordings were made after 5–6 d in culture. C, Firing properties of B8, B51, and B64. Activity was elicited by 1-s duration intracellular current injection in B51 and B64 with increments of 0.1 nA. The first current pulse failed to elicit activity in B51, but a plateau potential and high-frequency spike activity were produced when the current was increased by 0.1 nA. The plateau potential self-terminated after about 25 s. Similar dynamics were exhibited by B64, but the plateau potential in B64 persisted until it was terminated artificially by injecting a hyperpolarizing current. B8 was activated by 5-s duration current injection at 0.5-nA increments to illustrate regular firing that increased in frequency in response to the intensity of the stimuli. D, Images of cultured B8, B51, and B64 neurons.
Figure 2.
Figure 2.
The conductances of IA and ID were increased in the regular firing neuron B8 compared with the plateau generating neuron B51 and B64. A, Voltage-clamp protocol to measure IA. A 250-ms duration hyperpolarizing prepulse was used to de-inactivate IA. 4-AP was used to block IA (Materials and Methods). Inactivation of IA was measured by a separate voltage-clamp protocol (Extended Data Fig. 2-1). B–D, 4-AP subtracted current response indicating IA for B51 (B), B64 (C), and B8 (D) for each command potential. A single exponential equation (Eq. 1; Materials and Methods) was fitted to a 200-ms region beginning 25 ms after start of the command pulse (black line). E, Summary data for the inactivation (dashed line, open diamonds) and activation curves (solid line, solid diamonds). The data were fit with Boltzmann equations (Eqs. 12 and 15) with minimum A and B (minimum activation and maximum inactivation) set to 0. Data are represented as mean and standard error. F–I, Summary data for the maximum conductance (Eq. 7) half-activation, activation slope parameter, half inactivation, and inactivation slope parameter of the Boltzmann equations (Eqs. 12 and 15). Data are represented by a box-plot, median is a horizontal line and the interquartile range is represented by a rectangle. J, Maximum conductance of IA was estimated by extrapolating the fitted exponential curve to the beginning of the pulse and calculating conductance using Ohm's law. K, Voltage-clamp protocol to measure ID. A 300-ms duration prepulse at −40 mV was given to inactivate and reduce contamination by IA, making use of the lower threshold of inactivation of IA. The current responses were measured in 2 mm TEA to block IKCa. The final 100-ms pulse to 30 mV measured the amount of inactivation. L–N, Current response indicating ID for B51 (L), B64 (M), and B8 (N) for each command potential. The product of two exponential equations (Eq. 2) was fitted to a 1-s region beginning at the start of the command pulse (black line). O, Summary data for the inactivation (dashed line, open diamonds) and activation curves (solid line, solid diamond) and fitted Boltzmann equations (Eqs. 12 and 15). Data represented as mean and standard error. P–T, Summary data for the parameters of the Boltzmann equations. U, Maximum conductance calculated using Ohm's law. Sample sizes are: B8, n = 5; B51, n = 5; B64, n = 4 for IA; and B8, n = 5; B51, n = 4; B64, n = 5 for ID. For all box-plots here and subsequently, statistical significance (p < 0.05) is indicated by a star and the lack of a star indicates that the comparison did not reach statistical significance. The inactivation traces for IA and ID are illustrated in Extended Data Figure 2-1A,B and the time constant analyses for IA and ID are illustrated in Extended Data Figure 2-2A,B. The parameter values of the Boltzmann equations of all currents are provided in Extended Data Table 2-1.
Figure 3.
Figure 3.
IKCa facilitates the termination of plateau potentials. A, Application of Ni2+ increased the duration of the plateau potential of B51. Activity elicited by 1-s duration suprathreshold stimulation. B, Summary data of effects of Ni2+ on the B51 plateau potential. The duration was measured as the amount of time after the stimulus above −70 mV. Data are represented as a boxplot, median is a horizontal line and the interquartile range is represented as a rectangle. Sample size, n = 8. C, Voltage-clamp protocol to measure IKCa. D, The current responses to a voltage step to 20 mV. Responses in control were subtracted from responses in 4 mM TEA (teal). This procedure was repeated in a second set of B51 neurons in the presence of Ni2+ + Cd2+ to measure the calcium-insensitive outward component, which was averaged (see Extended Data Fig. 3-1). This average calcium-insensitive current response was normalized to the current response in the absence of Ni2+ + Cd2+ (gray). E, IKCa for B51. The averaged calcium-insensitive outward current at each command potential was subtracted from responses without Ni2+ + Cd2+ to isolate IKCa. F, TEA-subtracted current responses to a 20-mV step in B64 in the absence of Ni2+ + Cd2+ (teal) and the average TEA-subtracted current responses in a second set of B64 neurons. G, There was no apparent IKCa for B64 when the averaged calcium-insensitive outward current was subtracted from responses without Ni2+ + Cd2+. H, TEA-subtracted current responses to a 20-mV step in B8 in the absence of Ni2+ + Cd2+ (teal) and the average TEA-subtracted current responses in a second set of B8 neurons. I, IKCa for B8. The averaged calcium-insensitive outward current was subtracted from responses without Ni2+ + Cd2+ to isolate IKCa. J, Current response of IKCa. Mean current of last 50 ms of −10-mV voltage step. Sample sizes: B8, n = 6; B51, n = 5; B64, n = 5.
Figure 4.
Figure 4.
The conductances of ICaL and ICaR were increased in B8 compared with B51. A, Voltage-clamp protocol to measure ICaL. The current responses in control were subtracted from responses in 10 µm nifedipine to isolate ICaL. Inactivation for ICaL was measured by a separate voltage-clamp protocol (Extended Data Fig. 2-2). B–D, Subtracted current responses indicating ICaL for B51 (B), B64 (C), and B8 (D) for each command potential. A double exponential equation (Eq. 4) was fitted to a 100-ms region beginning 2 ms after start of the command pulse (black line). E, Summary data for the inactivation (dashed line, open diamonds) and activation curves (solid line, solid diamonds). The data were fit with Boltzmann equations (Eqs. 12 and 15) with minimum A and B (minimum activation and maximum inactivation) set to 0. Data are represented as mean and standard error. F–I, Summary data for the parameters of the Boltzmann equations. Data are represented by a boxplot, median is a horizontal line and the interquartile range is represented by a rectangle. J, Maximum conductance of ICaL was calculated using Ohm's law. K, Voltage-clamp protocol to measure ICaR. A 300-ms prepulse to −10 mV was given to inactivate ICaR. Protocols were administered in the presence of nifedipine to block ICaL. The current responses without prepulse were subtracted from responses with the prepulse to isolate ICaR. Inactivation for ICaR was measured by a separate voltage-clamp protocol (Extended Data Fig. 2-2). L–N, Subtracted current response indicating ICaR for B51 (A), B64 (B), and B8 (C) for each command potential. A double exponential equation (Eq. 4) was fitted to a 120-ms region beginning 8 ms after the start of the command pulse (black line). O, Summary data for the inactivation (dashed line, open diamonds) and activation curves (solid line, solid diamond) and fitted Boltzmann equations (lines; Eqs. 12 and 15). Data represented as mean and standard error. P–T, Summary data for the parameters of the Boltzmann equations. U, Maximum conductance calculated using Ohm's law. Sample sizes: ICaL B8, n = 5; B51, n = 5, and B64, n = 5; for ICaR: B8, n = 5; B51, n = 5; B64, n = 5. The inactivation traces for ICaL and ICaR are illustrated in Extended Data Figure 2-1C,D, and the time constant analyses for ICaL and ICaR are illustrated in Extended Data Figure 2-2C–F.
Figure 5.
Figure 5.
INaP has similar properties in both the plateau-generating neurons B51 and B64 and the regular-spiking neuron B8. A, Example neuron showing the reduction in plateau duration by varying concentrations of TTX. B, Dose-effect curve of TTX. The decrease in action potential amplitude was used as an indicator block of INa, whereas the percent decrease in the amount of time above −70 mV after the end of the stimulus was used as an indicator of the block of INap. C, Voltage-clamp protocol to measure INaP. A 20-ms duration step to −40 mV was used to reduce contamination by INa. To isolate INaP, the current responses in control were subtracted from responses in 10 µm TTX. D–F, TTX subtracted current response indicating INaP for B51 (D), B64 (E), and B8 (F) for each command potential. A double exponential equation (Eq. 5) was fitted for a 640-ms region beginning 9 ms after the start of the command pulse (black line). G, Summary data for the activation curves (solid line, solid diamonds) and fitted Boltzmann equations (lines, Eq. 12). Data represented as mean and standard error. H, I, Summary data for the parameters of the Boltzmann equations. J, Maximum conductance calculated using Ohm's law. Sample sizes: B8, n = 7; B51, n = 8; B64, n = 8. The time constant analysis for INaP is illustrated in Extended Data Figure 2-2G.
Figure 6.
Figure 6.
Simulations indicated that outward currents IKCa, IA, and ID terminated plateau potentials and could suppress the initiation of plateau potentials. A, Diagram of the conductance-based model for the three neurons. Each neuron was modeled as a single compartment containing ID, IA, IKTEA, IKCa, INaP, INa, ICaR, ICaL, and IHCN for B8. IKTEA is described in Extended Data Figure 3-1. Comparison of the current response to voltage commands between the model and empirical data is provided in Extended Data Figure 6-1. B–D, Plots showing the dominant steady-state current for each membrane potential. Ileak and IHCN dominate near the holding potential (−80 mV), INaP dominates between −60 and −30 mV, INa dominates between −30 mV and −10 mV, ID and IKCa dominate above −10 mV. E, Voltage and current responses during activity triggered by a simulated 1-s, 3-nA current injection. B8 has a pronounced sag potential (Díaz-Ríos and Miller, 2006) and rebound excitation (Kabotyanski et al., 2000); thus, we confirmed the presence of IHCN (see Extended Data Fig. 6-2) and substituted this current for ILeak in B8. the horizontal lines on the panels for Ileak and IHCN indicate 0 current. Passive properties could not explain the differences in firing properties (Extended Data Fig. 6-3). The parameter values of Equations 7, 12, and 15 for all currents in the model are provided in Extended Data Table 2-1.
Figure 7.
Figure 7.
INa, IKCa, and ID play key roles in maintaining and terminating plateau potentials. A–C, 3-D voltage plots of ID in B51, B64, and B8. Activity was elicited by a 1-s duration, 3-nA depolarizing current injection. The 3-D line is colored according to ID activation. Projections of the 3-D plot onto the xz-plane and xy-plane are colored in gray. Arrows indicate the direction of time. D–F, 3-D voltage plots of IKCa in B51, B64, and B8. G–I, 3-D voltage plots of INa in B51, B64, and B8. J, Voltage responses to 1-s duration, 3-nA current injection in control simulations (black), when either IKCa (green) or INa (red) was absent, or when both IKCa and INa were absent (purple). A voltage-clamp step to 60 mV was given to mimic the occurrence of an action potential.
Figure 8.
Figure 8.
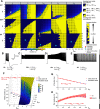
Effect of ion currents on plateau potential duration and prediction of biophysical properties outside the tested parameter space. A, Heat maps of the plateau duration for varying the maximum conductance (g¯) of ID, IA, IKCa, ICaL, and ICaR versus varying the maximum conductance of INaP (g¯NaP). The g¯ of the outward currents and Ca2+ currents were each varied from 0 to 6 µS, whereas g¯NaP was varied independently from 0 to 0.5 µS. The remaining model parameters were set according to experimental data presented in Extended Data Figures 2-1, 2-2, 3-1, 6-1, 6-2, and 6-3. A guide to interpreting the maps is provided on the right. A holding current was applied to set the membrane potential to −80 mV, similar to the empirical studies. Activity was then elicited by a 1-s duration, 5-nA simulated positive current injection. The filled circles indicate the physiological values of g¯ (red = B51, green = B64, cyan = B8). Yellow indicates neurons with nonterminating plateau potentials. The + indicates when spike activity outlasted the duration of the stimulus. Heatmaps for IKTEA are provided in Extended Data Figure 8-2. B–E, Voltage trace of simulations (top) for the parameter values indicated (bottom). The locations in the parameter space for B–E are indicated in A. F, The g¯KCa versus g¯NaP parameter space represented as a colored surface. For F–H, red diamonds indicate g¯KCa and g¯NaP parameter combinations within the tested parameter space having a plateau duration of 6–8 s. A second-degree polynomial was fit (red curve) to the red data points to estimate the g¯KCa and g¯NaP parameter combinations for the blue data points. In the polynomial equation, the plateau duration (PD) of the line was set to the mean of the red data points (6.99 s). Blue data points are parameter combinations predicted to have a plateau duration near 6.99 s. The plateau duration is indicated below each data point. G, Action potential duration (AD; see Extended Data Fig. 8-1J) along the fitted curve in F. The red line is a linear fit of the red data points and predicts the action potential duration of the blue data points in F. The light red regions surrounding the line in G and the fitted curve in H delineate the confidence intervals of the fits, with respect to the dependent variables (AD in G, PA in H; Materials and Methods). H, Plateau potential amplitude (PA; see Extended Data Fig. 8-1A) along the fitted curve in F. The red curve is a second-degree polynomial fit of the red data points and predicts the plateau potential amplitude of the blue data points in F.

Similar articles

Cited by

References

    1. Bal T, Nagy F, Moulins M (1994) Muscarinic modulation of a pattern-generating network: control of neuronal properties. J Neurosci 14:3019–3035. 10.1523/JNEUROSCI.14-05-03019.1994 - DOI - PMC - PubMed
    1. Baxter DA, Byrne JH (1989) Serotonergic modulation of two potassium currents in the pleural sensory neurons of Aplysia. J Neurophysiol 62:665–679. 10.1152/jn.1989.62.3.665 - DOI - PubMed
    1. Baxter DA, Byrne JH (2007) Simulator for neural networks and action potentials. Methods Mol Biol 401:127–154. 10.1007/978-1-59745-520-6_8 - DOI - PubMed
    1. Bédécarrats A, Simmers J, Nargeot R (2023) Sodium-mediated plateau potentials in an identified decisional neuron contribute to feeding-related motor pattern genesis in Aplysia. Front Neural Circuits 17:1200902. - PMC - PubMed
    1. Beurrier C, Congar P, Bioulac B, Hammond C (1999) Subthalamic nucleus neurons switch from single-spike activity to burst-firing mode. J Neurosci 19:599–609. 10.1523/JNEUROSCI.19-02-00599.1999 - DOI - PMC - PubMed

Publication types

MeSH terms