. 2023 Sep 12;14(1):5627.
doi: 10.1038/s41467-023-41353-z.

Metabolic heterogeneity of tissue-resident macrophages in homeostasis and during helminth infection

Affiliations

Metabolic heterogeneity of tissue-resident macrophages in homeostasis and during helminth infection

Graham A Heieis et al. Nat Commun. .

Erratum in

Abstract

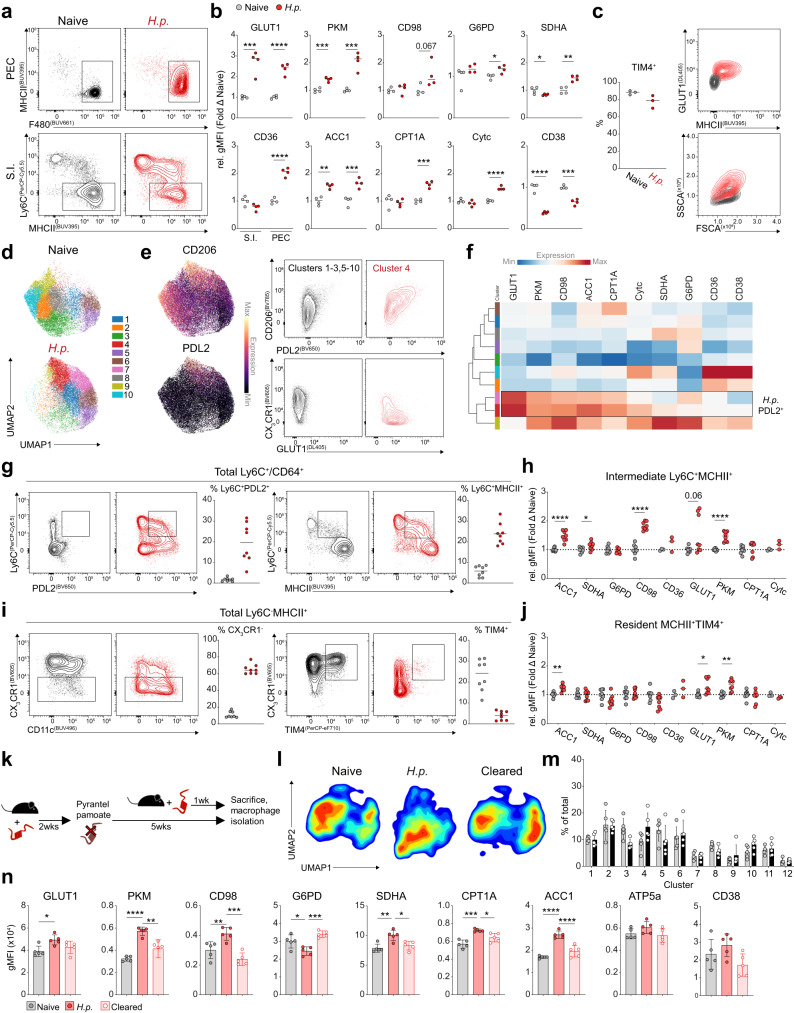
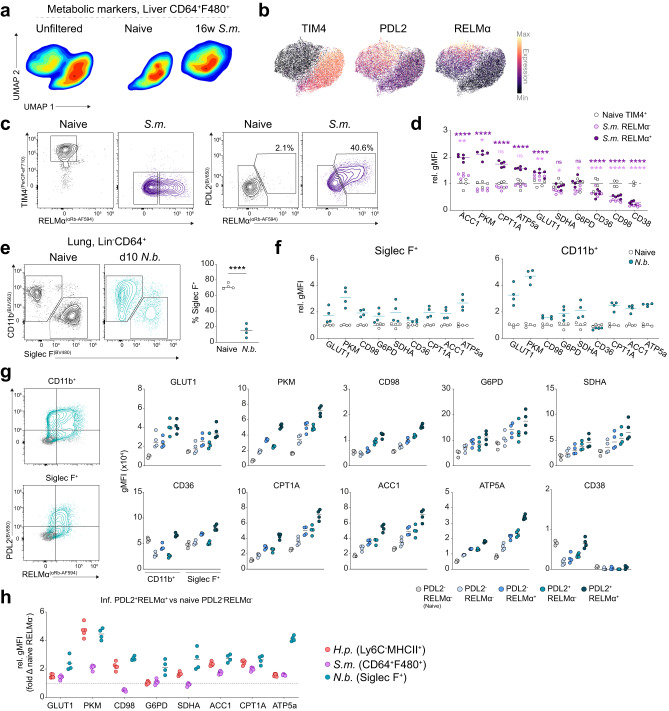
Tissue-resident macrophage populations constitute a mosaic of phenotypes, yet how their metabolic states link to the range of phenotypes and functions in vivo is still poorly defined. Here, using high-dimensional spectral flow cytometry, we observe distinct metabolic profiles between different organs and functionally link acetyl CoA carboxylase activity to efferocytotic capacity. Additionally, differences in metabolism are evident within populations from a specific site, corresponding to relative stages of macrophage maturity. Immune perturbation with intestinal helminth infection increases alternative activation and metabolic rewiring of monocyte-derived macrophage populations, while resident TIM4+ intestinal macrophages remain immunologically and metabolically hyporesponsive. Similar metabolic signatures in alternatively-activated macrophages are seen from different tissues using additional helminth models, but to different magnitudes, indicating further tissue-specific contributions to metabolic states. Thus, our high-dimensional, flow-based metabolic analyses indicates complex metabolic heterogeneity and dynamics of tissue-resident macrophage populations at homeostasis and during helminth infection.


Conflict of interest statement

The authors declare no competing interests.

Figures

Fig. 1
Fig. 1. Metabolic flow cytometry identifies distinct phenotypes between macrophages in vitro.
a Schematic of metabolic targets for flow-based analysis. b Relative change in geometric MFI of metabolic targets by stimulated BMDM relative to media control, and representative histograms below. Data points represent BMDM cultures from individual mice, pooled from 3–4 experiments (n = 12–16) with mean shown. c Fold change of metabolic target expression (gMFI) in GM-CSF relative to M-CSF differentiated human macrophages, datapoints represent individual donors (n = 6–9). Statistics calculated with (b) RM one-way ANOVA with Geisser-Greenhouse correction and Dunnett Test to correct for multiple comparisons, or (c) Wilcoxon two-tailed matched-pairs signed rank test. ****p < 0.0001, ***p < 0.001, **p < 0.01, *p < 0.05. Source data are provided as a Source Data file.
Fig. 2
Fig. 2. Macrophages display unique metabolic properties across different tissues.
Brain (LinCD11b+), lung (LinCD64+), intestine (LinCD11b+CD64+MHCIIHiLy6C), spleen (LinCD11bLoF4/80Hi), liver (CD11bLo/MidCD64+TIM4+), and peritoneal cavity (LinCD11b+) macrophages were gated in FlowJo and exported for analysis in OMIQ (a–f). a Uniform manifold approximation and projection (UMAP) analysis of all tissues using only metabolic targets. b Principal component (PC) analysis using metabolic target MFIs for tissue macrophages, done using the Clustvis web tool, representative of 3 independent experiments with n = 5. c Relative MFI of metabolic proteins normalized to the small intestine using brain microglia (CD11b+F4/80LoCX3CR1Hi), alveolar macrophages (CD11bSiglecF+), intestinal macrophages (Ly6CMHCIIHi), splenic red pulp macrophages, and resident peritoneal cavity macrophages (MHCIIF4/80Hi), pooled from 3–5 independent experiments (n = 16–21, 25–75th percentile with median, min and max). d Phenograph (pg) clustering overlaid on UMAP dimensional reduction of tissue macrophages from (a) according to metabolic protein expression, and frequency of clusters across tissues. e histogram showing intensity of metabolic targets in the most prominent clusters of the large (cluster 10) and small (cluster 6) intestines. f Histograms of TIM4 and ACC1 expression in tissue macrophages, shown according to ascending TIM4 expression. g Frequency of cell-trace violet+ cells after culturing either lung or peritoneal cavity macrophages with labeled apoptotic thymocytes for 1 h from 1 experiment; data points represent individual mice (n = 4) with mean shown. h Frequency of cell-trace violet+ peritoneal macrophages or BMDM incubated for 1 h with labeled apoptotic thymocytes or jurkat cells, respectively, after overnight pre-treatment with or without ACC inhibitor (60uM, CP 640,186), data points are from individual mice (n = 5), representative of 3 or 2 experiments, respectively. For (c) statistical tables can be viewed in Supplementary Tables 2–11, calculated using Kruskal–Wallis test with Dunn’s multiple comparisons, data in (g) and (h) were compared using a two-tailed unpaired t test. ****p < 0.0001, ***p < 0.001, **p < 0.01, *p < 0.05. Source data are provided as a Source Data file.
Fig. 3
Fig. 3. Small and large peritoneal macrophages are metabolically distinct.
a Wanderlust trajectory analysis of total CD11b+CD11c peritoneal exudate cells using immune marker (Ly6C, MHCII, F4/80, CX3CR1, CD206, TIM4) and metabolic protein expression. b Manual gating of MHCII+CD206+CPT1AHi macrophages, and representative histograms comparing their metabolic marker expression relative to total F4/80Hi macrophages. c gMFI of metabolic proteins in MHCII+CD206+, F4/80+TIM4 and F4/80+TIM4+ populations. One of five representative experiments, compared using one-way RM ANOVA (n = 4, mean ± SD). d SCENITH analysis of cavity macrophages using HPG incorporation following incubation with 1uM oligomycin (O), 100 mM 2-deoxy-d-glucose (2DG) or media controls (Co), one of two representative experiments shown with data compared using paired two-tailed t test (n = 4, mean ± SD), FAAO = Fatty acid/amino acid oxidation capacity. e Long-chain fatty-acid (BODIPY C16) uptake, mitochondrial polarization (TMRM) and mitochondrial mass (MitoTrackerDR) of peritoneal macrophage populations, data pooled from 3 experiments of n = 5 mice and compared using Wilcoxon two-tailed matched-pairs test. ****p < 0.0001, ***p < 0.001, **p < 0.01, *p < 0.05. Source data are provided as a Source Data file.
Fig. 4
Fig. 4. Distinct immune phenotypes within intestinal TIM4+ macrophages linked to differing metabolic states.
a Gating for monocytes and intermediate or mature macrophages in the small intestine lamina propria, and corresponding gMFI values of metabolic targets. b TMRM, MitoTracker DeepRed and BODIPY C16 staining or uptake for monocytes/macrophages in the small and (c) large intestine. d UMAP plots and overlaid phenograph clusters generated using immune (MHCII, CD11c, F4/80, PDL1, CX3CR1, CD64, CD206, TIM4) and metabolic targets. e Heatmap with Euclidean clustering showing mean relative expression of metabolic targets across resulting phenograph clusters. f, g Matching analysis of the colonic lamina propria macrophages (corresponding to d and e). h Metabolic target gMFI comparing small and large intestine macrophages, according to CD11c or CD206 expression. i Representative PDL1 staining (left), frequencies of PDL1+ cells amongst total MHCII+ macrophages or within the CD206+/CD11c+ populations (middle), and corresponding gMFI of gated PDL1+ cells (right). (j) Correlation between ACC1 and PDL1 expression (gated on total MHCII+ macrophages) using a simple linear regression (dashed lines = 95% confidence interval), and representative staining of ACC1 vs PDL1 in the small and large intestine. Statistics done using either RM one-way ANOVA with Geisser-Greenhouse correction and Tukey test for multiple comparisons (ac, e, i), two-way ANOVA and Tukey test for multiple comparisons (h, i). Representative of (ah) or pooled from (i, j) four independent experiments. ****p < 0.0001, ***p < 0.001, **p < 0.01, *p < 0.05. Source data are provided as a Source Data file.
Fig. 5
Fig. 5. Metabolically responsive, alternatively activated macrophages resemble monocyte-derived cells in the intestine during H. polygyrus infection.
a Representative flow-plots of monocyte/macrophage populations from the peritoneal cavity (top) or intestine (bottom) from naïve or day 7 infected mice. b Relative gMFI of metabolic markers normalized to the mean expression in macrophages, as gated in (a), from the corresponding naïve tissue (n = 4/group) representative of 3 experiments. c Frequency of TIM4+ macrophages in the naïve and infected peritoneal cavity, and representative plots of corresponding MHCII/GLUT1 expression and scatter profiles (n = 3/group) representative of 2 experiments. d Phenograph clustering overlaid on UMAP generated from metabolic target expression for Ly6CMHCII+ intestinal macrophages. e Localized CD206 and PDL2 expression on UMAP and representative plots of PDL2+ clusters from infected mice, compared to PDL2 clusters. f Heatmap showing mean metabolic expression for phenograph clusters. g Flow plots and graphs exhibiting Ly6C and PDL2 expression in the small intestine during infection, pooled from 2 experiments with n = 8 (gj). h Fold change in marker expression on intermediate macrophages relative to the mean of the matching naïve population. i Representative CX3CR1, CD11c, and TIM4 staining and frequencies of total CX3CR1 cells, or TIM4+ cells on MHCII+ macrophages. j Fold change in marker expression on TIM4+ macrophages relative to the mean of the matching naïve population. k Schematic for analyzing macrophage metabolism after helminth clearance. l Contour plots of UMAP generating from metabolic marker expression in MHCII+ macrophages. m Frequencies of phenograph clusters for MHCII+ macrophages from naïve (gray) or cleared (black) mice (mean ± SD). n Expression of metabolic targets in MHCII+ intestinal macrophages from naïve, infected or cleared mice (mean ± SD). Data representative of, or pooled from, two experiments with n = 2–5 per group (ln). Statistics done using either two-tailed unpaired t test (b, c, gj, m) or one-way ANOVA with Tukey test for multiple comparisons (n). ****p < 0.0001, ***p < 0.001, **p < 0.01, *p < 0.05. Source data are provided as a Source Data file.
Fig. 6
Fig. 6. Shared metabolic phenotypes in alternatively-activated macrophages from different models of helminth infection.
a UMAP of macrophages from the livers of naïve or 16 week S. mansoni infected livers and (b) overlay of TIM4, PDL2 and RELMα expression. c Representative gating for naïve resident or S.m induced alternatively activated macrophages. d relative expression of metabolic marker normalized to mean expression on naïve Kupffer cells, n = 4–6 mice per group shown as individual data points and mean. e Gating for lung macrophages in naïve and N. brasiliensis infected mice, 10 days post-infection, and corresponding frequencies of Siglec F+ alveolar macrophages, n = 4 mice per group shown as individual data points and mean (eg). f gMFI of alveolar and CD11b+ macrophage metabolic protein expression normalized to mean gMFI of respective population from naïve mice. g Representative gating for alternative activation markers and corresponding gMFI of metabolic markers segregated according to PDL2 or RELMα expression. h Fold change in metabolic markers across infections, relative to the matched naïve population from the same tissue. Data representative of one (Sm, n = 6) or two (Sm, n = 4/Hp, n = 2,5) independent experiments. Statistics calculated using one-way ANOVA with Tukey test for multiple comparisons (d) or two-tailed unpaired t test (e). ****p < 0.0001, ***p < 0.001, **p < 0.01, *p < 0.05. Source data are provided as a Source Data file.

References

    1. Ginhoux, F. & Guilliams, M. Tissue-resident macrophage ontogeny and homeostasis. Immunity44, 439–449 (2016). 10.1016/j.immuni.2016.02.024 - DOI - PubMed
    1. Nobs, S. P. & Kopf, M. Tissue-resident macrophages: guardians of organ homeostasis. Trends Immunol.42, 495–507 (2021). 10.1016/j.it.2021.04.007 - DOI - PubMed
    1. Wculek, S. K., Dunphy, G., Heras-Murillo, I., Mastrangelo, A. & Sancho, D. Metabolism of tissue macrophages in homeostasis and pathology. Cell Mol. Immunol.10.1038/s41423-021-00791-9 (2021). - PMC - PubMed
    1. Liu, Z. et al. Fate mapping via Ms4a3-expression history traces monocyte-derived cells. Cell178, 1509–1525.e1519 (2019). 10.1016/j.cell.2019.08.009 - DOI - PubMed
    1. Bain, C. C. et al. Rate of replenishment and microenvironment contribute to the sexually dimorphic phenotype and function of peritoneal macrophages. Sci. Immunol.5, eabc4466 (2020). 10.1126/sciimmunol.abc4466 - DOI - PMC - PubMed

Publication types