. 2023 Sep 12;14(1):5465.
doi: 10.1038/s41467-023-40052-z.

The genomic footprint of whaling and isolation in fin whale populations

Affiliations

The genomic footprint of whaling and isolation in fin whale populations

Sergio F Nigenda-Morales et al. Nat Commun. .

Abstract

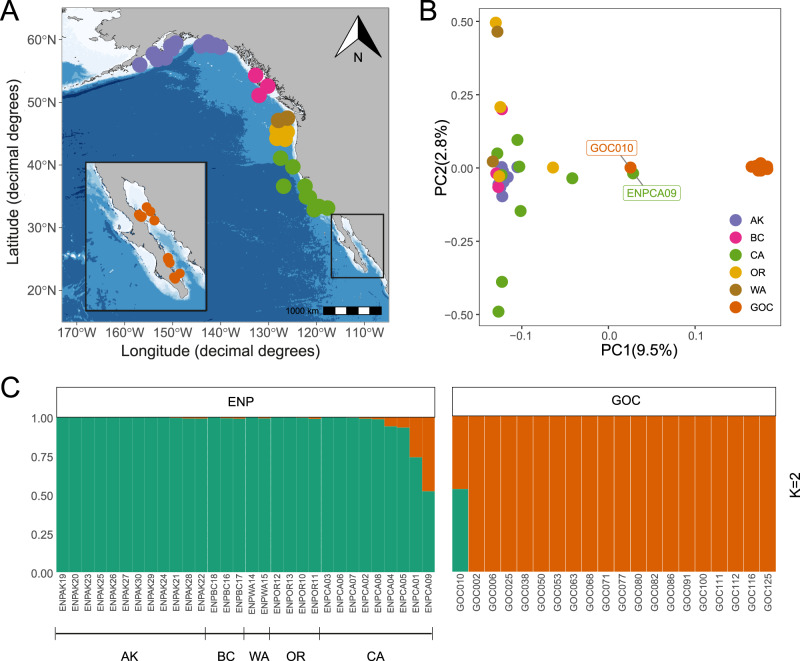
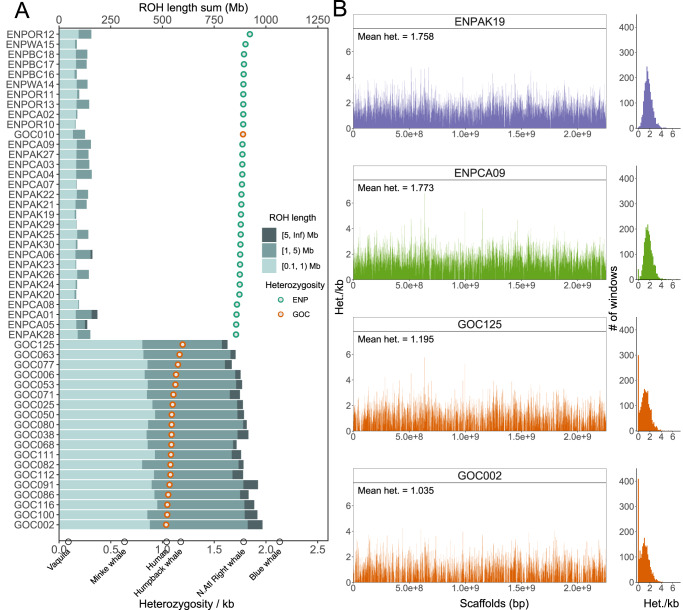
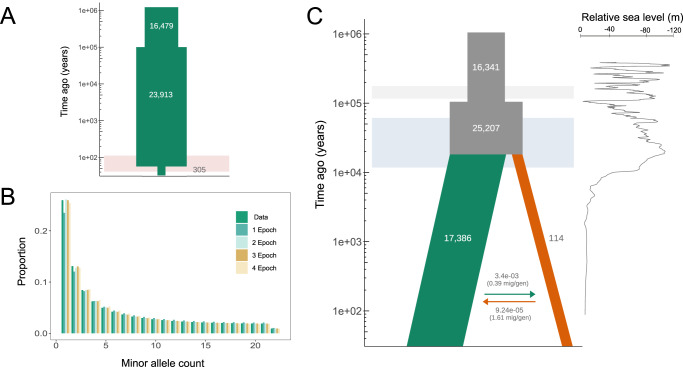
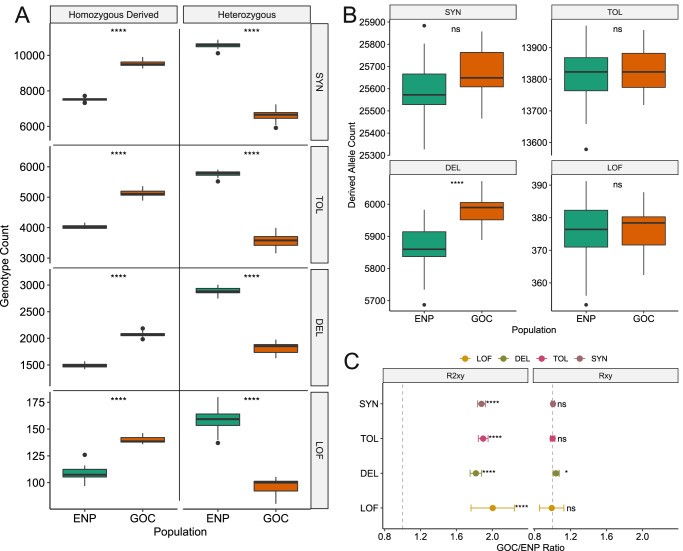
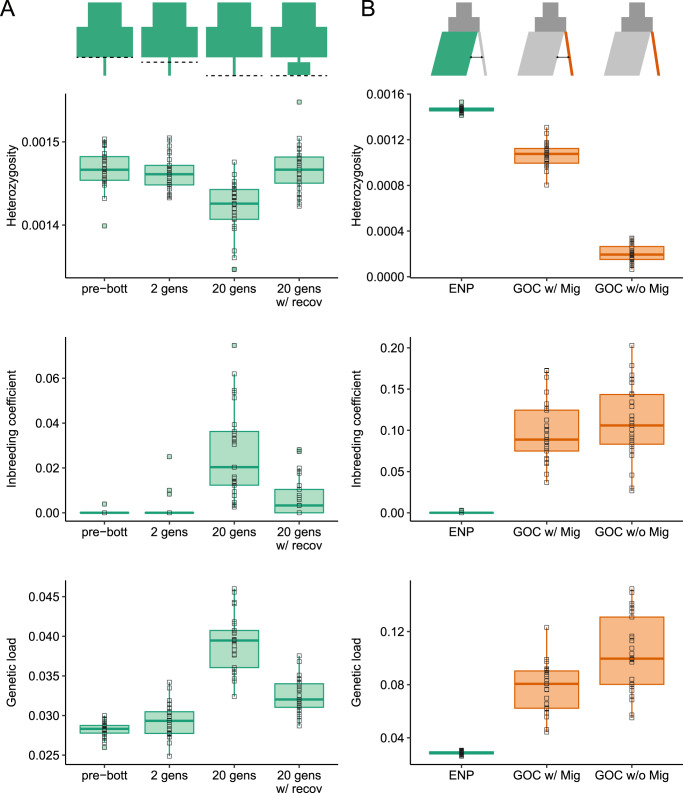
Twentieth century industrial whaling pushed several species to the brink of extinction, with fin whales being the most impacted. However, a small, resident population in the Gulf of California was not targeted by whaling. Here, we analyzed 50 whole-genomes from the Eastern North Pacific (ENP) and Gulf of California (GOC) fin whale populations to investigate their demographic history and the genomic effects of natural and human-induced bottlenecks. We show that the two populations diverged ~16,000 years ago, after which the ENP population expanded and then suffered a 99% reduction in effective size during the whaling period. In contrast, the GOC population remained small and isolated, receiving less than one migrant per generation. However, this low level of migration has been crucial for maintaining its viability. Our study exposes the severity of whaling, emphasizes the importance of migration, and demonstrates the use of genome-based analyses and simulations to inform conservation strategies.


Conflict of interest statement

The authors declare no competing interests.

Figures

Fig. 1
Fig. 1. Population structure and sample origins for the fin whale genomes obtained in this study.
A Thirty skin samples were collected along Eastern North Pacific (ENP) locations near Alaska (AK), British Columbia (BC), Washington (WA), Oregon (OR), and California (CA) from 1995 to 2017. Twenty samples were collected in seven sites within the Gulf of California (GOC) from Bahía de La Paz and Los Frailes in the southern Gulf to Bahía de los Ángeles, Puerto Refugio, and Bahía Kino around the Midriff islands (Table S1). B PCA for 50 samples are colored by their location origin. The admixed individuals are labeled. C Admixture analyses supported two ancestral populations (K = 2). The map in A was generated with the R package ggOceanMaps which uses publicly available bathymetry data from the ETOPO1 1-arc minute global relief data set distributed by the National Center for Environmental Information (https://www.ncei.noaa.gov/products/etopo-global-relief-model). Source data are provided as a Source Data file.
Fig. 2
Fig. 2. ROH and distribution of heterozygosity across the genome.
A Points of genome-wide heterozygosity for each sample are ranked by decreasing heterozygosity from top to bottom. Circles at the bottom axis denote heterozygosity in other mammals. Barplots present summed lengths of short (0.1 Mb ≤ ROH < 1 Mb) to long (>5 Mb) ROH per individual (top axis). B The left panel shows per-site heterozygosity in non-overlapping 1-Mb windows across called scaffolds. The genome-wide heterozygosity value is annotated as “Mean het”. The right panel summarizes the distribution of per-window heterozygosity. Individuals with divergent demographic histories were selected as examples. ENPAK19 represents the large outbred Eastern North Pacific population that recently experienced whaling. ENPCA09 is an admixed individual. GOC002 and GOC125 belong to the small, isolated Gulf of California population. Source data are provided as a Source Data file.
Fig. 3
Fig. 3. Demographic history inferred for fin whale populations.
A The historical demography of the Eastern North Pacific (ENP; green) population is best represented by a single-population 3-epoch model. This model has an initial expansion, occurring around 115 thousand years ago (kya; 4424 generations) followed by an ~99% reduction only 26 to 52 years ago (one or two generations), during the whaling period for this species in the North Pacific (red horizontal bar). B Fit of the SFS from each demographic model (1- to 4-epoch) obtained with ∂a∂i for the ENP population to the SFS from the empirical data (Data). The SFS distribution for the 3-epoch model represented in A shows the best fit to the data. C Two-population model showing an ancestral effective population size expansion from approximately 16,000 to 25,000 individuals during the Eemian interglacial period >100 kya (between the Illinois [gray bar] and Wisconsin [light blue bar] glaciations). The two populations diverged around 16 kya, during the Last Glacial Maximum. After the divergence, the ENP population (green) remained at an effective population size of ~17,000, whereas the Gulf of California (GOC; orange) population has remained small at an effective size of Ne = 114. These populations have maintained low levels of asymmetrical gene flow, with higher migration rates from ENP into GOC (3.42E-03), than vice-versa (9.24E-05). However, when scaled by the receiving population’s effective size, the GOC is only receiving 0.39 effective migrants/generation, while the ENP receives 1.61 effective migrants/gen. The black line to the right shows the relative sea level. Source data are provided as a Source Data file.
Fig. 4
Fig. 4. Increase in putatively deleterious variation in the GOC compared to the ENP fin whales.
Sample sizes: Gulf of California (GOC) N = 17, Eastern North Pacific (ENP) N = 27. A The GOC fin whales contain significantly fewer heterozygous and more homozygous derived genotypes in all four functional categories of variants. B Only putatively deleterious nonsynonymous alleles (DEL) are significantly elevated (two-tailed MWU test p < 0.001; Table S15) in the GOC compared with the ENP population. The ENP and GOC fin whales contain similar numbers of derived neutral alleles (SYN: synonymous and TOL: tolerated nonsynonymous), and putatively deleterious loss-of-function (LOF) alleles. For A and B, we used two-tailed Mann-Whitney U tests without multiple testing adjustment (the exact p values for the Mann–Whitney U tests are given in Table S15 in the supplementary material). In the boxplots, the notch indicates the median, and the boxes represent the 25th and 75th percentiles. The whiskers extend to data points no >1.5 * IQR (inter-quantile range) from the hinges and the points show outliers beyond the whiskers. C RXY and RXY2 statistics in GOC (X) and ENP (Y) populations. RXY>1 (dashed gray line) indicates a relative accumulation of the corresponding mutation category in the GOC population. Similarly, RXY2>1 indicates relative accumulation of homozygous mutations. The 2x standard error based on the jackknife distribution is denoted as error bar, the circles in the center of the error bars represent the RXY or R2XY values. For C we used a two-tailed Z score test without multiple testing adjustment (RXY Z-test significant values: pSYN = 0.61, pDEL = 0.02, pTOL = 0.98, pLOF = 0.88; R2XY Z-test significant values: pSYN = 0, pDEL = 2.60e-142, pTOL = 3.73e-234, pLOF = 9.91e-17). Significance levels: ns, not significant; *p < 0.05; **p < 0.01; ***p < 0.001; ****p < 0.0001. Source data are provided as a Source Data file.
Fig. 5
Fig. 5. Simulations of heterozygosity, inbreeding coefficient, and genetic load.
Representations of the demographic scenarios under which the simulations were performed are shown at the top. A Results for simulations under single-population 3-epoch model for the ENP population (green), including mean heterozygosity, levels of inbreeding (FROH>1Mb), and mean genetic load. Each quantity was measured prior to the onset of the whaling bottleneck (pre-bott), after two generations at the bottleneck Ne = 305 (2 gens), after 20 generations at the bottleneck Ne = 305 (20 gens), and 20 generations following the onset bottleneck where recovery to Ne = 1000 occurred after just two generations at Ne = 305 (20 gens w/ recov). In the demographic representations, the dashed line indicates the timing of sampling. B Results for simulations under our chosen two-population model. Each quantity is shown for the ENP (green) and GOC (orange; GOC w/mig) populations at the end of the simulation. We also simulated under a no migration demographic scenario for the GOC population (orange; GOC w/o mig). Note the much lower heterozygosity, higher inbreeding, and higher genetic load in the GOC population in the absence of migration. In the demographic representations, the sampled population, ENP or GOC, are shown in green or orange, respectively, and the presence/absence of migration indicated with the black arrows. For all boxplots, the notch indicates the median, and the boxes represent the 25th and 75th percentiles. The whiskers extend to data points no >1.5 * IQR (inter-quantile range) from the hinges and the solid squares show outliers beyond the whiskers. Hollow squares denote each simulation’s value. Source data are provided as a Source Data file.

References

    1. Ceballos G, Ehrlich PR. Mammal population losses and the extinction crisis. Science. 2002;296:904–907. doi: 10.1126/science.1069349. - DOI - PubMed
    1. Pimm SL, et al. The biodiversity of species and their rates of extinction, distribution, and protection. Science. 2014;344:1246752–1246752. doi: 10.1126/science.1246752. - DOI - PubMed
    1. Waters CN, et al. The Anthropocene is functionally and stratigraphically distinct from the Holocene. Science. 2016;351:aad2622–aad2622. doi: 10.1126/science.aad2622. - DOI - PubMed
    1. Lande R. Risks of population extinction from demographic and environmental stochasticity and random catastrophes. Am. Nat. 1993;142:911–927. doi: 10.1086/285580. - DOI - PubMed
    1. Reed DH, Frankham R. Correlation between fitness and genetic diversity. Conserv. Biol. 2003;17:230–237. doi: 10.1046/j.1523-1739.2003.01236.x. - DOI

Publication types