. 2023 Sep 12;14(1):5628.
doi: 10.1038/s41467-023-41409-0.

Langerhans cells shape postnatal oral homeostasis in a mechanical-force-dependent but microbiota and IL17-independent manner

Affiliations

Langerhans cells shape postnatal oral homeostasis in a mechanical-force-dependent but microbiota and IL17-independent manner

Yasmin Jaber et al. Nat Commun. .

Abstract

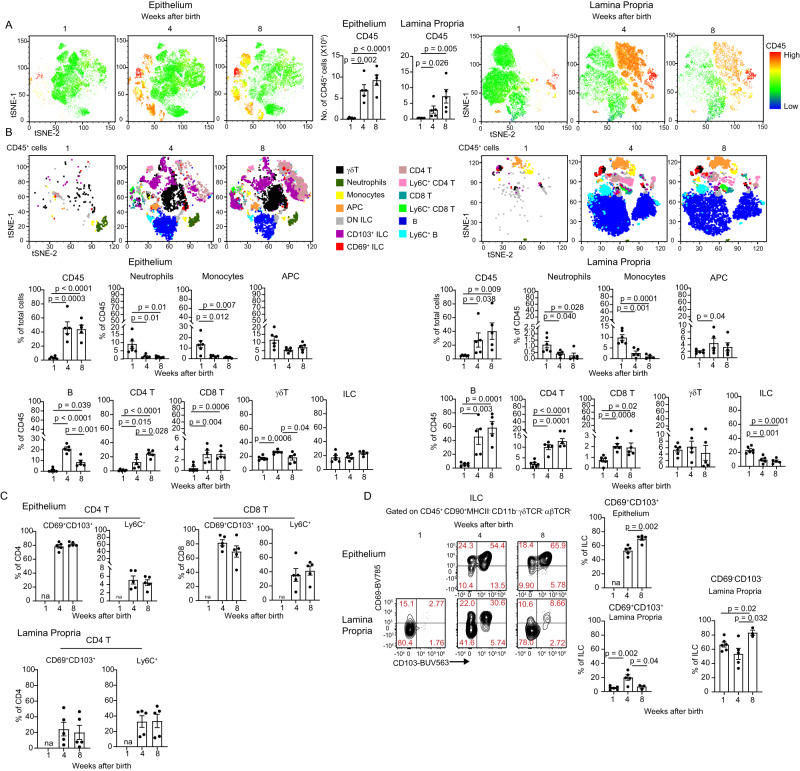
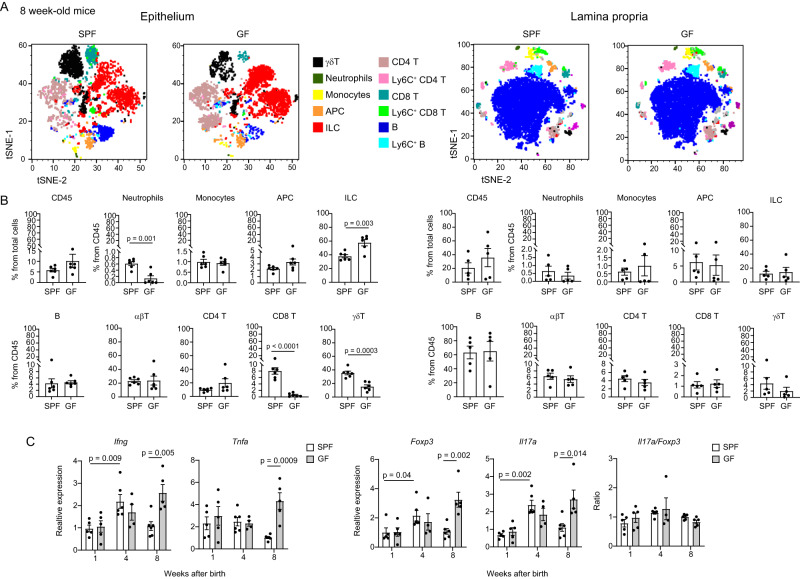
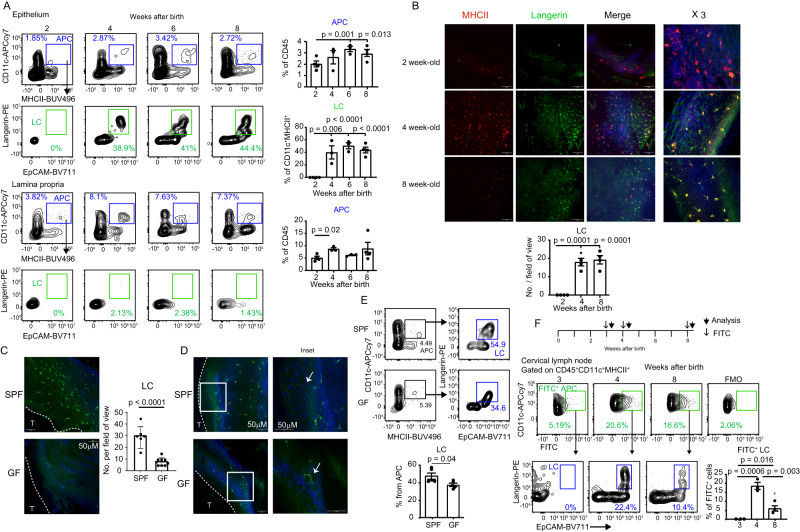
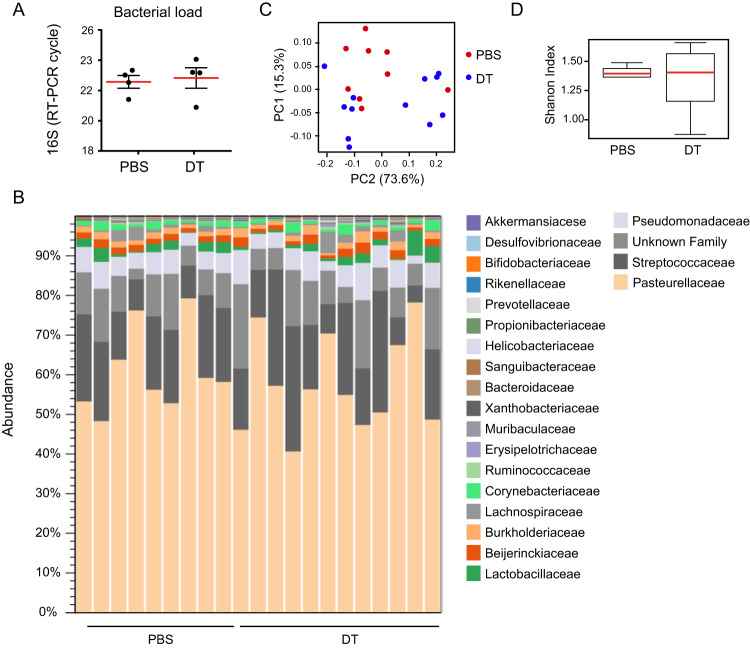
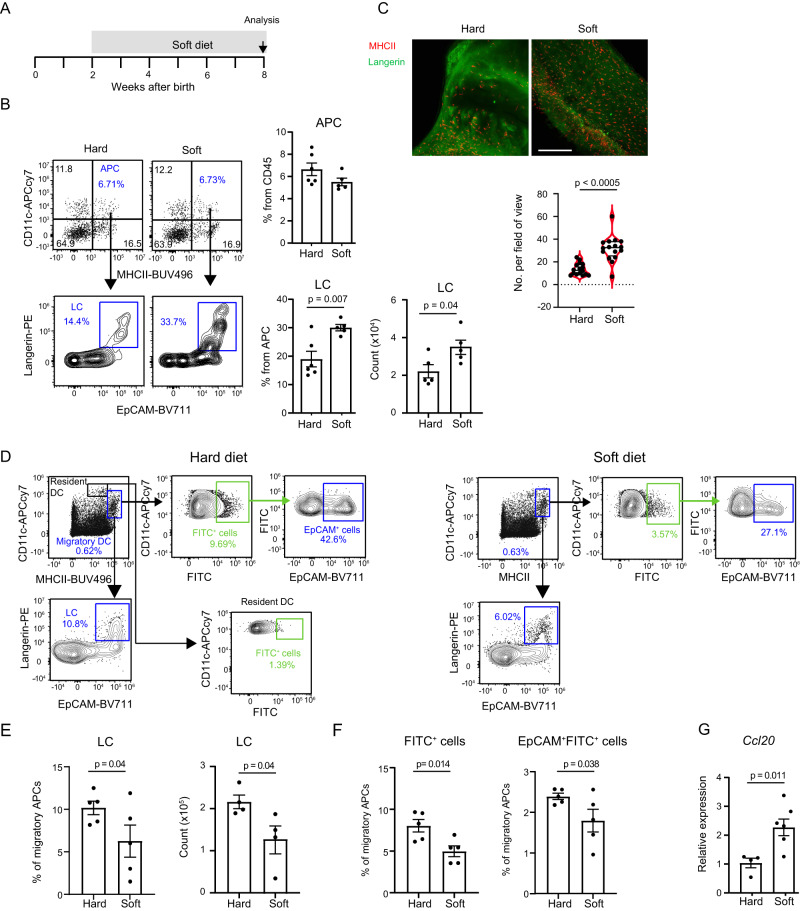
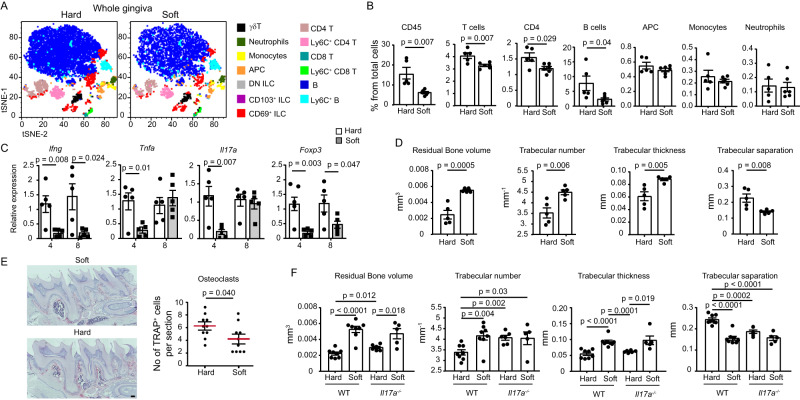
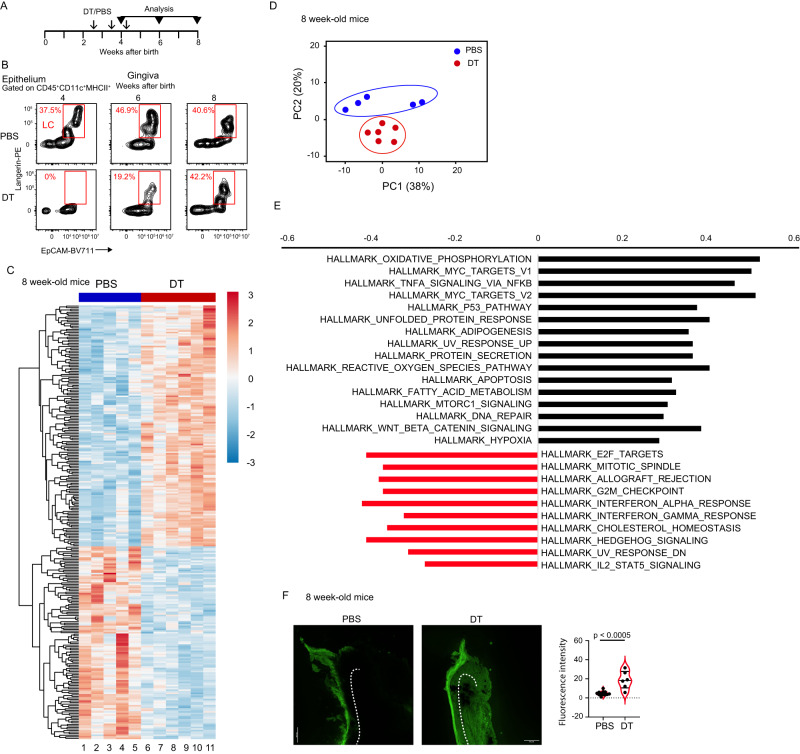
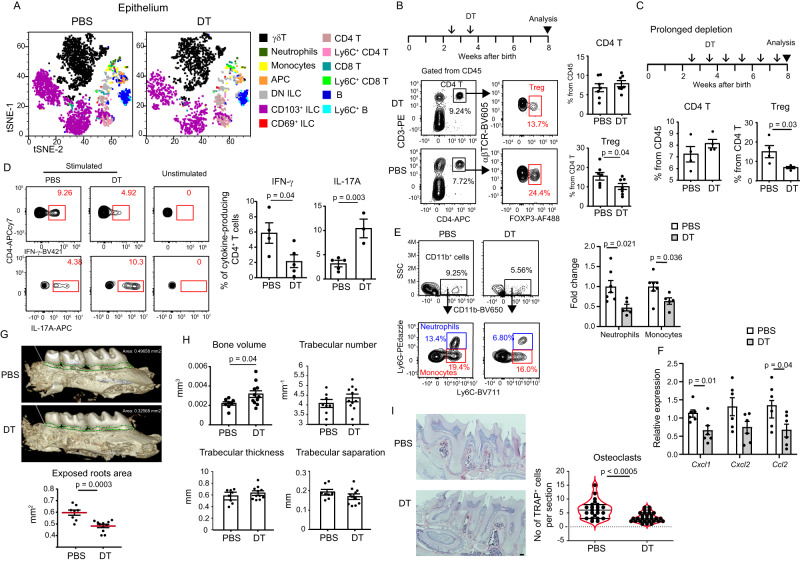
The postnatal interaction between microbiota and the immune system establishes lifelong homeostasis at mucosal epithelial barriers, however, the barrier-specific physiological activities that drive the equilibrium are hardly known. During weaning, the oral epithelium, which is monitored by Langerhans cells (LC), is challenged by the development of a microbial plaque and the initiation of masticatory forces capable of damaging the epithelium. Here we show that microbial colonization following birth facilitates the differentiation of oral LCs, setting the stage for the weaning period, in which adaptive immunity develops. Despite the presence of the challenging microbial plaque, LCs mainly respond to masticatory mechanical forces, inducing adaptive immunity, to maintain epithelial integrity that is also associated with naturally occurring alveolar bone loss. Mechanistically, masticatory forces induce the migration of LCs to the lymph nodes, and in return, LCs support the development of immunity to maintain epithelial integrity in a microbiota-independent manner. Unlike in adult life, this bone loss is IL-17-independent, suggesting that the establishment of oral mucosal homeostasis after birth and its maintenance in adult life involve distinct mechanisms.


Conflict of interest statement

The authors declare no competing interests.

Figures

Fig. 1
Fig. 1. Gingival adaptive immunity is established during weaning.
A tSNE flow cytometry plots display the expression of the leukocyte marker CD45 on total tissue cells and the total numbers of CD45+ leukocytes in the gingival epithelium and lamina propria at the indicated weeks after birth. Bar graph represents the mean leukocyte numbers + SEM (n = 5 mice). p-value from an ordinary one-way ANOVA test using GraphPad Prism. B tSNE plots show the main cells subsets of CD45+ leukocytes present in each tissue at the indicated weeks after birth. Representative data from two independent experiments. Graphs show the mean frequencies + SEM (n = 5 mice for weeks 4 and 8, n = 6 mice for week 1) of the main leukocytes of the gingiva at various weeks postnatally. Data from one out of two independent experiments are shown. p-value from an ordinary one-way ANOVA test using GraphPad Prism. C Graphs show the mean frequencies + SEM (n = 5 mice) of CD69+ CD103+ or Ly6C+ CD4+ and CD8+ T cells in the epithelium and lamina propria at various weeks postnatally. Data from one out of two independent experiments are shown. p-value from an ordinary one-way ANOVA test using GraphPad Prism. D Representative flow cytometry plots and graphs show the mean frequencies + SEM of the ILCs expressing CD69 and CD103 in the epithelium (n = 5) and lamina propria (n = 6 mice for week 1, n = 5 mice for week 4, n = 3 mice for week 8) at various weeks postnatally. Data from one out of two independent experiments are shown. p-value from an ordinary one-way ANOVA test using GraphPad Prism. Source data are provided as a Source Data file.
Fig. 2
Fig. 2. The microbiota has a limited impact on gingival homeostasis.
A tSNE flow cytometry plots display the main subsets of leukocytes present in the gingival epithelium and the lamina propria of 8-week-old SPF and GF mice. Representative data from three independent experiments. p-value from two-tailed, unpaired t-test using GraphPad Prism. B Graphs show the mean frequencies + SEM (n = 5 for SPF, 6 for GF) of the various leukocytes in the gingival tissues of SPF and GF mice. Data from one out of three independent experiments are shown. p-value from a two-tailed, unpaired t-test using GraphPad Prism. C Relative expression of the noted immunological genes in the gingiva at various weeks after birth. Graphs present the transcript levels quantified by RT-PCR and normalized to 8-week-old mice depicted as the mean + SEM (n = 5 for SPF week 1 and GF weeks 1 and 8, n = 6 for SPF weeks 4 and 8, n = 4 for GF week 4). Representative data of two independent experiments. p-value from an ordinary one-way ANOVA test using GraphPad Prism. Source data are provided as a Source Data file.
Fig. 3
Fig. 3. LCs populate the gingival epithelium during weaning and have a potent migratory capability.
A Representative flow cytometry plots and graphs display the mean frequencies + SEM (n = 4 mice for weeks 1 and 8, n = 3 mice for weeks 4 and 6) of APCs and LCs in the gingival epithelium and lamina propria at various weeks after birth. Representative results from two independent experiments. p-value from an ordinary one-way ANOVA test using GraphPad Prism. B Wholemount immunofluorescence staining of gingival epithelial sheets prepared from 2, 4, and 8-weeks-old-mice with antibodies directed against MHCII (red), langerin (green), and with DAPI (Blue) for nuclear visualization. Representative images of two independent experiments. Scale bar, 50 μm. The graph presents the means of LC numbers per field of view + SEM (n = 4 mice). p-value from an ordinary one-way ANOVA test using GraphPad Prism. C, D Wholemount immunofluorescence staining of gingival epithelial sheets prepared from 4-week-old SPF and GF mice with antibody directed against langerin (green) and DAPI (Blue). Representative images of three independent experiments. Scale bar, 50 μm. The graph presents the means of LC numbers per field of view + SEM (n = 6 for SPF, n = 9 for GF). p-value from a two-tailed, unpaired t-test using GraphPad Prism. E Representative flow cytometry plots and a graph display the mean frequencies + SEM (n = 5) of LCs in the gingival epithelium of 4-week-old SPF and GF mice. Representative results from two independent experiments. p-value from a two-tailed, unpaired t-test using GraphPad Prism. F Gingival tissues of B6 mice were painted with FITC solution 3, 4, and 8-weeks after birth, and 3 days later, the cervical LNs were collected. FACS plots and graphs show the frequencies + SEM (n = 3 for weeks 3 and 4, n = 4 for week 8) of FITC+ LCs among the APCs. FMO, fluorescence minus one. Representative results from two independent experiments. p-value from an ordinary one-way ANOVA test using GraphPad Prism. Source data are provided as a Source Data file.
Fig. 4
Fig. 4. Depletion of LCs during weaning has no impact on the oral microbiota.
Langerin-DTR mice were treated with DT or PBS to deplete LCs during weaning, and the oral microbiota was sampled from adult mice for taxonomic analysis. A Total oral bacterial load determined by quantitative RT-PCR of the mean expression of the 16 S rRNA gene + SEM (n = 4 mice). p-value from two-tailed, unpaired t-test using GraphPad Prism. B Histograms represent the distribution of sequences in operational taxonomic units (OTUs) assigned to each family. C Principal coordinates (PCs) analysis of weighted UniFrac distances based on 16S rRNA of Langerin-DTR mice treated with DT or PBS. D Alpha diversity plot representing taxa richness in samples of both groups of mice. Data presented as standard boxplot, the median denoted as a central horizontal line in the box and the whiskers covering the data within ±1.5 IQR (n = 9 for PBS, n = 12 for DT). Taxonomic data was pooled from two independent experiments. Source data are provided as a Source Data file.
Fig. 5
Fig. 5. Early-life masticatory forces facilitate LC migration to the LNs.
A Scheme of the experimental set-up to diminish masticatory forces by giving mice a soft diet from the second to the eighth week of life. B Mice were fed with a soft or solid diet from the second week of life, and at six weeks old, the gingiva was analyzed by flow cytometry. Representative FACS plots and graphs present the mean frequencies + SEM (n = 5 hard diet, n = 6 soft diet) and total numbers of gingival APCs and LCs. Representative data from two independent experiments. p-value from a two-tailed, unpaired t-test using GraphPad Prism. C Representative immunofluorescence images of gingival epithelial sheet prepared from mice fed with hard or soft diet and stained against MHCII and langerin to visualize LCs. Data presented the number of LCs as standard violin plot, the median denoted as a central horizontal line in the box and the whiskers covering the data within ±1.5 IQR (n = 16 fields from 3 mice). p-value from a two-tailed, unpaired t-test using GraphPad Prism. DF Mice were fed with a soft or solid diet from the second week of life, and at six weeks old, the gingiva was painted with FITC solution and two days later the cervical LNs were analyzed by flow cytometry. Representative FACS plots (D) and graphs (E) present the mean frequencies + SEM (n = 5 mice) and total numbers (n = 5 mice) of LCs among migratory APCs. F Graphs show the mean frequencies of FITC+ cells and EpCAM+ FITC+ cells (representing migratory LCs) among migratory APCs + SEM (n = 5 mice). Representative data from two independent experiments. p-value from a two-tailed, unpaired t-test using GraphPad Prism. G Relative expression of the Ccl20 in the gingiva of mice fed with a soft or solid diet. Graphs present the transcript levels quantified by RT-PCR and normalized to mice fed with a solid diet depicted as the mean + SEM (n = 4 hard diet, n = 6 soft diet). Representative data from two independent experiments. p-value from a two-tailed, unpaired t-test using GraphPad Prism. Source data are provided as a Source Data file.
Fig. 6
Fig. 6. Early-life masticatory forces alter gingival immunity and induce IL-17-independent alveolar bone loss.
A tSNE flow cytometry plots display the main subsets of leukocytes present in the gingiva (epithelium and lamina propria) of adult B6 mice receiving a soft or solid diet from the second week of life. p-value from a two-tailed, unpaired t-test using GraphPad Prism. B Graphs show the mean frequencies + SEM (n = 5 hard diet, n = 6 soft diet) of the various leukocytes in the gingiva. Data from one out of two independent experiments are shown. p-value from a two-tailed, unpaired t-test using GraphPad Prism. C Relative expression of the note genes in the gingiva of mice fed with a soft or solid diet. Graphs present the transcript levels quantified by RT-PCR and normalized to mice fed with a solid diet depicted as the mean + SEM (n = 5). Representative data from two independent experiments. p-value from a two-tailed, unpaired t-test using GraphPad Prism. D µCT analysis of the maxilla of adult B6 mice receiving a soft or solid diet prior to weaning. The graphs show the mean alveolar bone volumes + SEM (n = 6) as well as the noted trabecular parameters. Representative data from two independent experiments. p-value from a two-tailed, unpaired t-test using GraphPad Prism. E Representative gingival cross-sections from adult mice fed with a soft or solid diet. The graph shows the mean numbers + SEM of TRAP-positive osteoclasts per cross-section (n = 10 sections from three mice). Representative data from two independent experiments. p-value from a two-tailed, unpaired t-test using GraphPad Prism. F Il17a-/- mice were treated with soft or solid diets as described above. The graphs show the mean alveolar bone volumes + SEM (n = 8 for WT, n = 5 for Il17a-/-) and the trabecular parameters using µCT analysis. Representative data from three independent experiments. Scale bar, 50 µm. p-value from an ordinary one-way ANOVA test using GraphPad Prism. Source data are provided as a Source Data file.
Fig. 7
Fig. 7. Depletion of LCs during weaning dysregulates the cellular and immunological function of the adult gingiva.
A Experimental setting employed to deplete langerin-positive cells from Langerin-DTR mice using DT or PBS as a control. B Representative flow cytometry plots demonstrating the repopulation of gingival LCs upon the noted depletion strategy. CE Epithelial cells were collected from adult Langerin-DTR mice after administration of DT (n = 6) or PBS (n = 5) as described in A, and subjected to global gene expression analysis. C Hierarchical clustering of the genes differentially expressed in the naive and the LC-depleted epithelial cells. D PCA of the most variable transcripts expressed by the epithelial cells from the different groups. E Significantly upregulated and downregulated gene pathways identifies by GSEA analysis among the various groups of epithelial cells (familywise error rate [FWER] <0.05). F FITC solution was applied to the gingiva of 8-weeks-old langerin-DTR mice treated with DT or PBS as described in A. Representative gingival cross-sections show the localization of FITC in the tissue upon topical application of FITC solution. Data presented the quantification of fluorescence intensity as standard violin plot, the median denoted as a central horizontal line in the box and the whiskers covering the data within ±1.5 IQR (n = 6 for DT, n = 12 for PSB). Scale bar, 50 µm. p-value from a two-tailed, unpaired t-test using GraphPad Prism. Source data are provided as a Source Data file.
Fig. 8
Fig. 8. LCs control gingival immunity after birth associated with alveolar bone loss.
A tSNE flow cytometry plots display the main subsets of leukocytes present in the gingival epithelium of Langerin-DTR mice treated with DT or PBS to deplete gingival LCs during weaning. B, C Gingival LCs were depleted during weaning (B) or until adulthood (C) as indicated in the schematics of the experimental settings. Representative flow cytometry plots and graphs show the mean frequencies + SEM (n = 7 for weaning, n = 4 for adulthood) of the Treg cells in the adult gingiva. Data were pooled from two independent experiments. p-value from a two-tailed, unpaired t-test using GraphPad Prism. D Representative flow cytometry plots and graphs display the mean frequencies + SEM of IFN-γ (n = 4 for PBS, n = 5 for DT) or IL-17A (n = 5 for PBS, n = 3 for DT) positive gingival CD4+ T cells of adult mice depleted of LCs during weaning upon stimulation with PMA. Representative data from two independent experiments. p-value from a two-tailed, unpaired t-test using GraphPad Prism. E Representative flow cytometry plots and graphs display the mean frequencies + SEM (n = 7 for PBS, n = 5 for DT) of gingival monocytes, and neutrophils in adult mice depleted of LCs during weaning. Representative data from two independent experiments. p-value from a two-tailed, unpaired t-test using GraphPad Prism. F Relative expression of the note genes in the gingiva of LC-depleted mice. Graphs present the transcript levels quantified by RT-PCR and normalized to PBS-treated mice depicted as the mean + SEM (n = 6). Data were pooled from two independent experiments. p-value from a two-tailed, unpaired t-test using GraphPad Prism. G, H µCT images and graphs of the adult maxilla of mice depleted of LC during weaning show the (G) exposed root area, the (H) alveolar bone volume, and trabecular parameters (n = 8 for PBS, n = 11 for DT). Data were pooled from two independent experiments. p-value from a two-tailed, unpaired t-test using GraphPad Prism. I Representative gingival cross-sections from adult mice show TRAP-positive cells in DT or PBS-treated mice during weaning. Data presented the numbers of TRAP-positive osteoclasts per cross-section as standard violin plot, the median denoted as a central horizontal line in the box and the whiskers covering the data within ±1.5 IQR The graph shows the (n = 23 sections for PBS, n = 29 sections for DT, collected from 3 mice). Representative data from two independent experiments. Scale bar, 50 µm. p-value from a two-tailed, unpaired t-test using GraphPad Prism. Source data are provided as a Source Data file.

Similar articles

Cited by

References

    1. Torow N, Hornef MW. The neonatal window of opportunity: setting the stage for life-long host-microbial interaction and immune homeostasis. J. Immunol. 2017;198:557–563. doi: 10.4049/jimmunol.1601253. - DOI - PubMed
    1. Koren N, et al. Maturation of the neonatal oral mucosa involves unique epithelium-microbiota interactions. Cell Host Microbe. 2021;29:197–209.e195. doi: 10.1016/j.chom.2020.12.006. - DOI - PubMed
    1. Zubeidat K. & Hovav A. H. Shaped by the epithelium - postnatal immune mechanisms of oral homeostasis. Trends Immunol. 42, 622–634 (2021). - PubMed
    1. Dutzan N, et al. On-going mechanical damage from mastication drives homeostatic Th17 cell responses at the oral barrier. Immunity. 2017;46:133–147. doi: 10.1016/j.immuni.2016.12.010. - DOI - PMC - PubMed
    1. Hajishengallis G. Periodontitis: from microbial immune subversion to systemic inflammation. Nat. Rev. Immunol. 2015;15:30–44. doi: 10.1038/nri3785. - DOI - PMC - PubMed

Publication types