. 2023 Sep 12;3(1):123.
doi: 10.1038/s43856-023-00348-z.

Molecular characterization of MRSA collected during national surveillance between 2008 and 2019 in the Netherlands

Collaborators, Affiliations

Molecular characterization of MRSA collected during national surveillance between 2008 and 2019 in the Netherlands

Leo M Schouls et al. Commun Med (Lond). .

Abstract

Background: Although the Netherlands is a country with a low endemic level, methicillin-resistant Staphylococcus aureus (MRSA) poses a significant health care problem. Therefore, high coverage national MRSA surveillance has been in place since 1989. To monitor possible changes in the type-distribution and emergence of resistance and virulence, MRSA isolates are molecularly characterized.

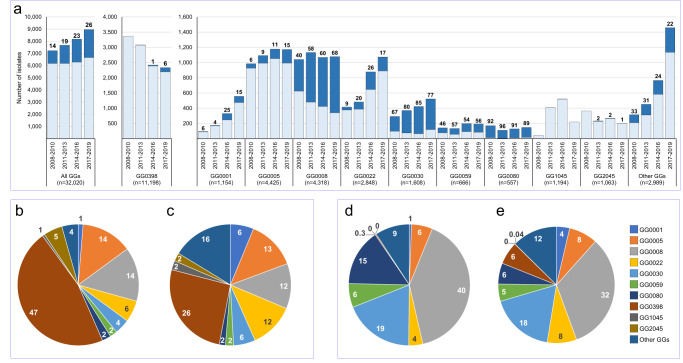
Methods: All 43,321 isolates from 36,520 persons, collected 2008-2019, were typed by multiple-locus variable number tandem repeats analysis (MLVA) with simultaneous PCR detection of the mecA, mecC and lukF-PV genes, indicative for PVL. Next-generation sequencing data of 4991 isolates from 4798 persons were used for whole genome multi-locus sequence typing (wgMLST) and identification of resistance and virulence genes.

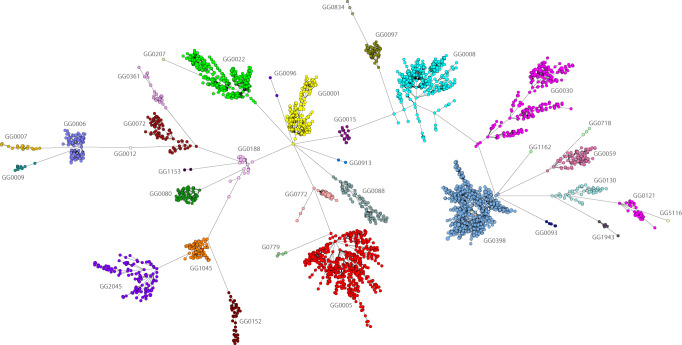
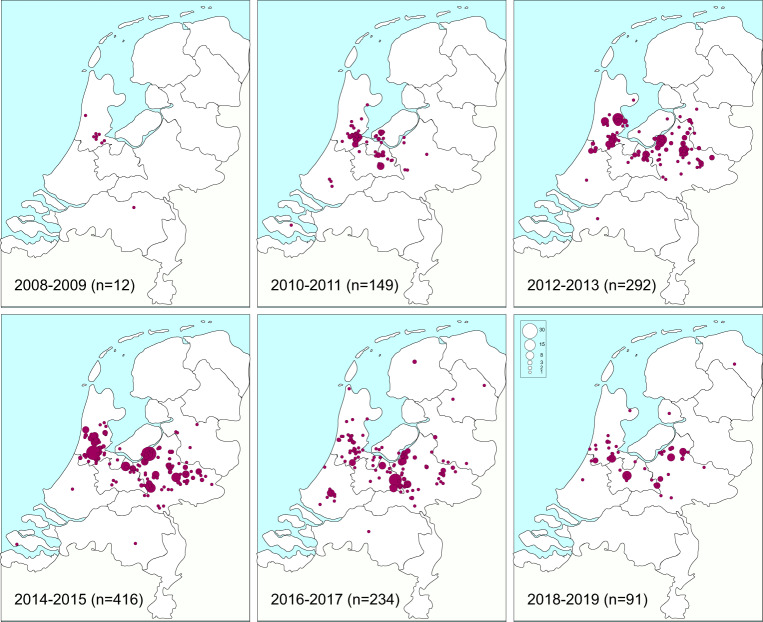
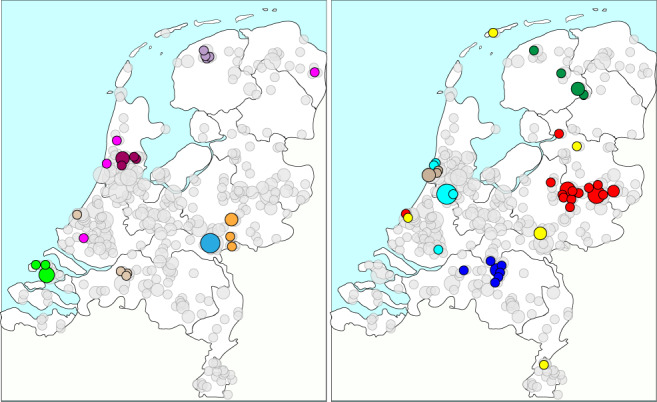
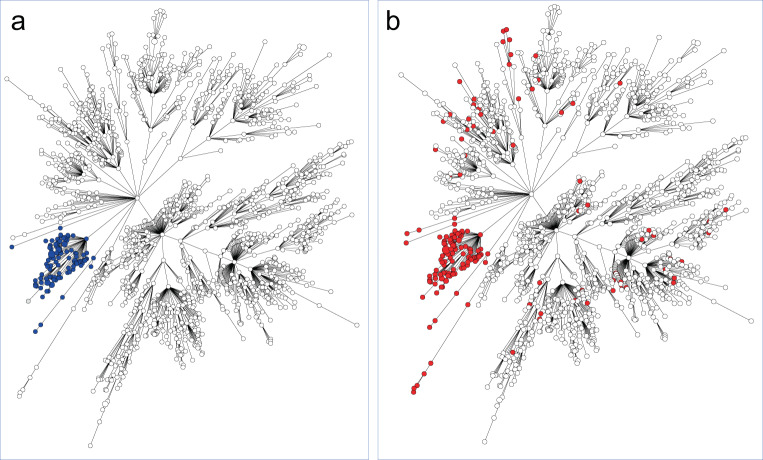
Results: We show temporal change in the molecular characteristics of the MRSA population with the proportion of PVL-positive isolates increasing from 15% in 2008-2010 to 25% in 2017-2019. In livestock-associated MRSA obtained from humans, PVL-positivity increases to 6% in 2017-2019 with isolates predominantly from regions with few pig farms. wgMLST reveals the presence of 35 genogroups with distinct resistance, virulence gene profiles and specimen origin. Typing shows prolonged persistent MRSA carriage with a mean carriage period of 407 days. There is a clear spatial and a weak temporal relationship between isolates that clustered in wgMLST, indicative for regional spread of MRSA strains.

Conclusions: Using molecular characterization, this exceptionally large study shows genomic changes in the MRSA population at the national level. It reveals waxing and waning of types and genogroups and an increasing proportion of PVL-positive MRSA.

Plain language summary

A group of bacteria that cause difficult-to-treat infections in humans is methicillin-resistant Staphylococcus aureus (MRSA). The aim of this study was to monitor changes in the spread of MRSA, their disease causing potential and resistance to antibiotics used to treat MRSA infections. MRSA from patients and their contacts in the Netherlands were collected over a period of 12 years and characterized. This revealed new types of MRSA emerged and others disappeared. An increasing number of MRSA produces a protein called PVL toxin, enabling MRSA to cause more severe infections. Also, some people appear to carry MRSA without any disease for more than a year. These findings suggest an increasing disease potential of MRSA and possible unnoticed sources of infection. Consequently, it is important to maintain monitoring of these infections to minimize MRSA spread.


Conflict of interest statement

The authors declare no competing interests.

Figures

Fig. 1
Fig. 1. Population structure of MRSA in the Netherlands.
The minimum spanning tree is based on categorical clustering of wgMLST data of 4798 MRSA isolates (first isolate per person). Each circle represents one or more MRSA isolates with the same wgMLST profile. Genogroups are indicated by colors and text. The distances between the genogroups, represented by the connecting lines, are at least 1000 wgMLST loci.
Fig. 2
Fig. 2. Temporal changes in the distribution of residential locations of persons from whom GG1045 were isolated (2008–2019, n = 1194, first isolate per person).
The first isolates were sampled in the Mid-West of the country, after which GG1045 appeared to spread to the Mid-Eastern part of the country but not in the Northern or Southern direction.
Fig. 3
Fig. 3. Plot of residential locations for the largest GG0005 genetic clusters on the map of the Netherlands.
The genetic clusters were assigned using the 21-loci cutoff. Cluster isolates (first isolate per person) are displayed in color, and the light gray circles display all GG0005 isolates. The circle size represents the number of persons in the 4-digit zip code. The clusters have been displayed in two separate panels to prevent cluttering of the figure.
Fig. 4
Fig. 4. Temporal changes in the composition of the MRSA population.
a The stacked dark blue bars represent the PVL-positive, and the light blue bars the PVL-negative isolates. The numbers above the bars denote the PVL-positive proportion (%) of the isolates. Pie charts of the distribution of all isolates in 2008–2010 (b) and 2017–2019 (c). Distribution of the PVL-positive isolates in 2008–2010 (d) and 2017–2019 (e). The numbers in and just outside the pie chart segments denote the proportions (%) of each GG.
Fig. 5
Fig. 5. Different geographic distribution of the residential location in the Netherlands of persons carrying PVL-positive and PVL-negative GG0398 MRSA.
a All 2017–2019 PVL-positive GG0398 MRSA (red circles, n = 140) and a random sample of PVL-negative GG0398 (green circles, n = 140) from the same period. The circle size indicates the number of sampled persons living in the same geographic location. The yellow circle on the West Coast denotes the city of The Hague. b The number of inhabitants of the 12 Dutch provinces (purple) and the number of pigs in pig farms per province (salmon). The circle sizes represent the number of inhabitants or pigs per province ×1000. In the province in the Mid-East (Gelderland), the number of inhabitants is nearly the same as the number of pigs.
Fig. 6
Fig. 6. wgMLST minimum spanning trees of 1516 GG0398 isolates (2008–2019, first isolate per person).
a 111 isolates carrying lukS-PV/lukF-PV are in dark blue. b 181 isolates carrying sak/scn genes are in red.

References

    1. Vos MC, et al. 5 years of experience implementing a methicillin-resistant Staphylococcus aureus search and destroy policy at the largest university medical center in the Netherlands. Infect. Control Hosp. Epidemiol. 2009;30:977–984. doi: 10.1086/605921. - DOI - PubMed
    1. Weterings V, Veenemans J, van Rijen M, Kluytmans J. Prevalence of nasal carriage of methicillin-resistant Staphylococcus aureus in patients at hospital admission in The Netherlands, 2010-2017: an observational study. Clin. Microbiol. Infect. 2019;25:1428 e1421–1428 e1425. doi: 10.1016/j.cmi.2019.03.012. - DOI - PubMed
    1. Bode LG, et al. Sustained low prevalence of meticillin-resistant Staphylococcus aureus upon admission to hospital in The Netherlands. J. Hosp. Infect. 2011;79:198–201. doi: 10.1016/j.jhin.2011.05.009. - DOI - PubMed
    1. Wertheim HF, et al. Low prevalence of methicillin-resistant Staphylococcus aureus (MRSA) at hospital admission in the Netherlands: the value of search and destroy and restrictive antibiotic use. J. Hosp. Infect. 2004;56:321–325. doi: 10.1016/j.jhin.2004.01.026. - DOI - PubMed
    1. Junie LM, Jeican II, Matros L, Pandrea SL. Molecular epidemiology of the community-associated methicillin-resistant Staphylococcus aureus clones: a synthetic review. Clujul Med. 2018;91:7–11. - PMC - PubMed