

Symmetry of gamma distribution data about the mean after processing with EWMA function
- PMID: 37700023
- PMCID: PMC10497503
- DOI: 10.1038/s41598-023-39763-6
Symmetry of gamma distribution data about the mean after processing with EWMA function
Abstract
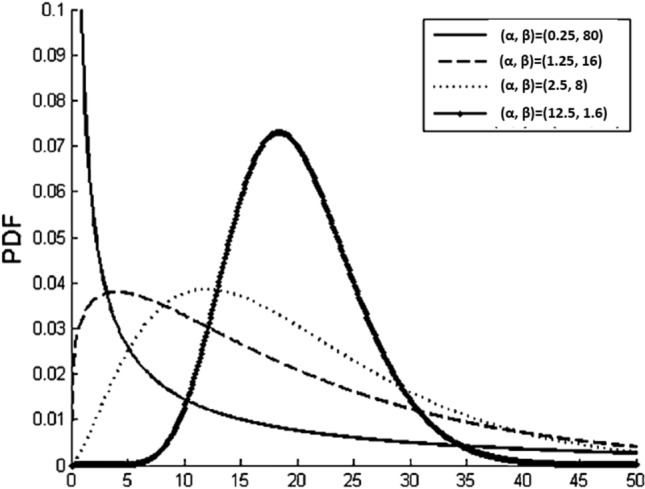
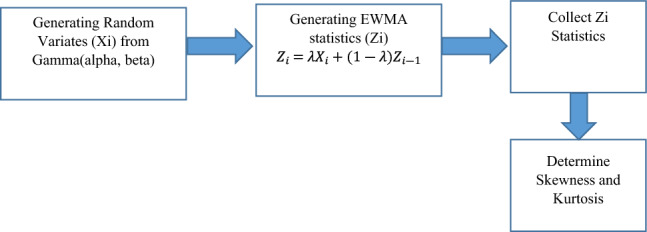
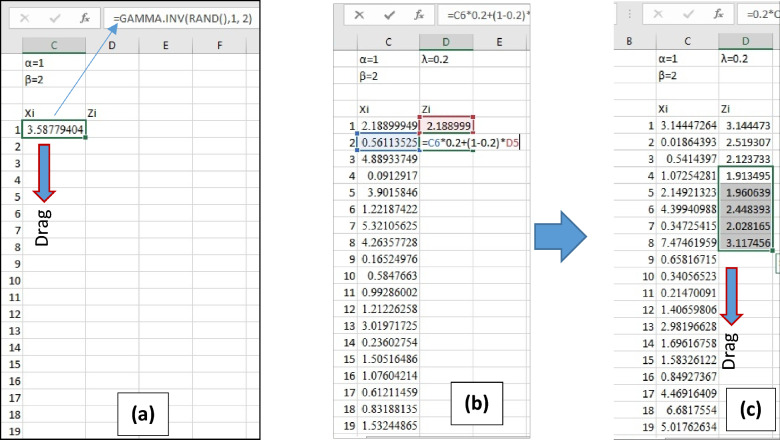
Statistical Process Control (SPC) plays a vital role in maintaining quality and reducing variability in manufacturing processes. Among SPC techniques, the Exponentially Weighted Moving Average (EWMA) stands out for its ability to detect small process shifts quickly, making it a valuable tool in ensuring product consistency and preventing quality issues. EWMA constructs control charts to monitor process mean shifts, tracks product/service quality by identifying variations, and monitors manufacturing process parameters for early detection of deviations and necessary adjustments. EWMA control chart has been proposed as an alternative to the Shewhart control chart. Sequential measurements are processed using the EWMA function before being placed on the control chart. One of the crucial concerns about the EWMA control chart is the asymmetry of the data around the mean. Although processing with the EWMA function reduces data skewness, the problem of asymmetric data may not be solved. The control chart is designed to leave in front of the upper control limit (UCL) α/2 of the data and behind the lower control limit (LCL) another α/2 of the data, and this does not occur in the case of symmetric data. α/2 represents the significance level for each tail in a two-tailed hypothesis test, indicating the probability of incorrectly rejecting the null hypothesis for each side of the distribution. Since many of the distributions in real life can be approximated by the Gamma distribution, the Gamma distribution was adopted in this study. The Monte Carlo simulation methodology was implemented to generate Gamma distributed data, process it with EWMA function and assess the skewness and kurtosis. The purpose of this paper is to evaluate the effect of EWMA parameters on the performance of the EWMA control chart. Moreover, it focuses on skewness and kurtosis reduction after data processing using the EWMA function. The findings help researchers and practitioners to select the best parameters. Further, the research investigates the effect of EWMA parameter on the shape of distribution.
© 2023. Springer Nature Limited.
Conflict of interest statement
The authors declare no competing interests.
Figures


References
-
- Roberts SW. Control-charts-tests based on geometric moving averages. Technometrics. 1959;1:239–250. doi: 10.1080/00401706.1959.10489860. - DOI
-
- Prabhu SS, Runger GC. Designing a multivariate EWMA control chart. J. Qual. Technol. 1997;29(1):8–15. doi: 10.1080/00224065.1997.11979720. - DOI
-
- Albin SL, Kang L, Shea G. An X and EWMA chart for individual observations. J. Qual. Technol. 1997;29(1):41–48. doi: 10.1080/00224065.1997.11979723. - DOI
-
- Abbas N, Riaz M, Does RJ. Enhancing the performance of EWMA charts. Qual. Reliab. Eng. Int. 2011;27(6):821–833. doi: 10.1002/qre.1175. - DOI
-
- Abujiya MAR, Riaz M, Lee MH. Enhancing the performance of combined Shewhart-EWMA charts. Qual. Reliab. Eng. Int. 2013;29(8):1093–1106. doi: 10.1002/qre.1461. - DOI
LinkOut - more resources
Full Text Sources
