

Isoliensinine Attenuates Renal Fibrosis and Inhibits TGF-β1/Smad2/3 Signaling Pathway in Spontaneously Hypertensive Rats
- PMID: 37701045
- PMCID: PMC10494865
- DOI: 10.2147/DDDT.S414179
Isoliensinine Attenuates Renal Fibrosis and Inhibits TGF-β1/Smad2/3 Signaling Pathway in Spontaneously Hypertensive Rats
Abstract
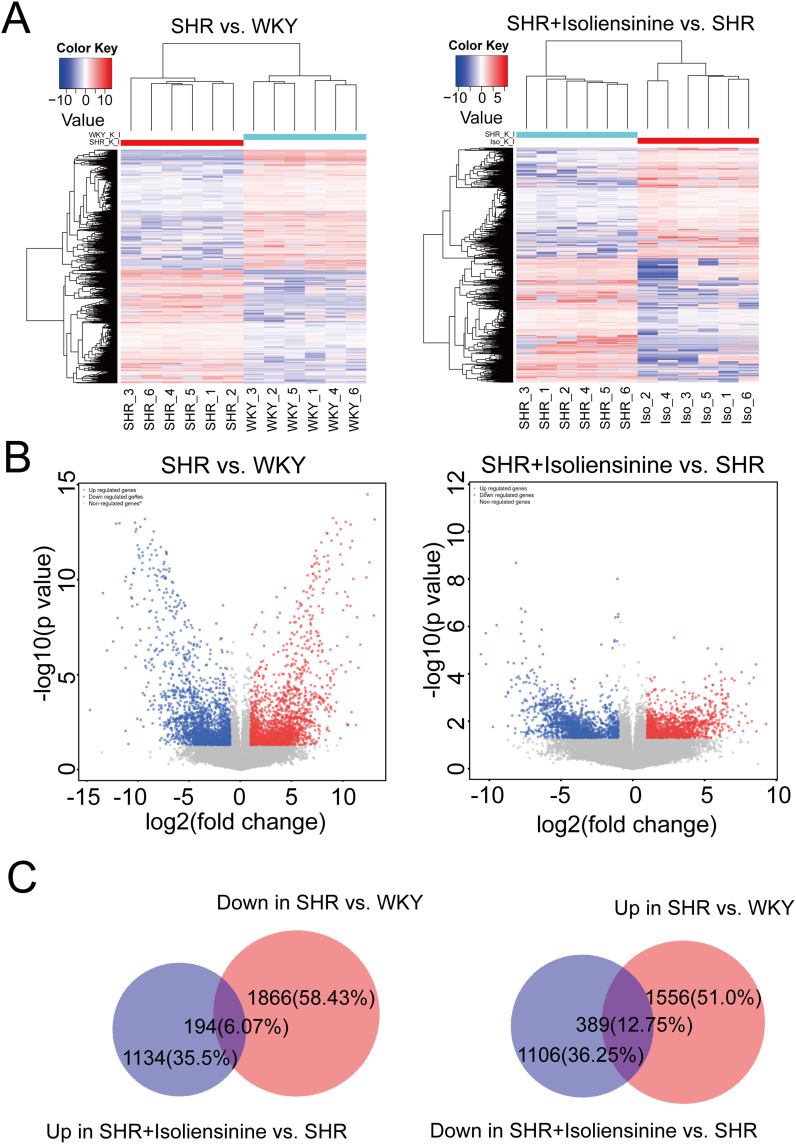
Purpose: This study aimed to investigate the molecular mechanisms of isoliensinine, a kind of bibenzyl isoquinoline alkaloid which isolated from a TCM named Lotus Plumule (Nelumbo nucifera Gaertn), in treating renal interstitial fibrosis (RIF) by using RNA sequencing, KEGG analysis and in vivo experimental approaches.
Methods: Spontaneous hypertension rats (SHRs) were randomly assigned into five groups, consisting of SHR, SHR+Isoliensinine-L (2.5 mg/kg/day), SHR+Isoliensinine-M (5 mg/kg/day), SHR+Isoliensinine-H (10 mg/kg/day), and SHR+Valsartan (10 mg/kg/day) groups (n = 6 for each group). A control group of Wistar Kyoto rats (n = 6) was also included. Rats were treated intragastrically with isoliensinine, valsartan, or double-distilled water of equal volume for 10 weeks. To examine the therapeutic impact on hypertensive renal injury, fibrosis, and its underlying mechanisms, multiple techniques were employed, including hematoxylin and eosin staining, Masson trichrome staining, RNA sequencing, gene ontology (GO) function and pathway enrichment analysis and immunohistochemistry.
Results: Resultantly, the use of isoliensinine at different concentrations or valsartan showed significant improvement in renal pathological injury in SHRs. RNA sequencing and KEGG analysis uncovered 583 differentially expressed transcripts and pathways enriched in collagen formation and ECM-receptor interaction after treatment with isoliensinine. There was also a reduction in the increase of collagen and upregulation of collagen I & III, TGF-β1, p-Smad2, and p-Smad3 in the renal tissue of SHRs. Thus, isoliensinine ameliorated renal injury and collagen deposition in hypertensive rats, and inhibiting the activation of the TGF-β1/Smad2/3 pathway might be one of the underlying mechanisms.
Conclusion: This study showed that treatment with isoliensinine effectively reduced the renal injury and fibrosis in SHRs. In addition, isoliensinine inhibited the TGF-β1/Smad2/3 signaling in-vivo. These findings provided strong evidence for the therapeutic benefits of isoliensinine in combating renal injury and fibrosis.
Keywords: RNA sequencing; TGF-β1/Smad2/3 pathway; collagen deposition; hypertension; isoliensinine; renal injury.
© 2023 Yao et al.
Conflict of interest statement
The authors report no conflicts of interest in this work.
Figures


Similar articles
-
Qingda granule ameliorates vascular remodeling and phenotypic transformation of adventitial fibroblasts via suppressing the TGF-β1/Smad2/3 pathway.J Ethnopharmacol. 2023 Sep 15;313:116535. doi: 10.1016/j.jep.2023.116535. Epub 2023 Apr 24. J Ethnopharmacol. 2023. PMID: 37100260
-
Gastrodin attenuates renal injury and collagen deposition via suppression of the TGF-β1/Smad2/3 signaling pathway based on network pharmacology analysis.Front Pharmacol. 2023 Jan 17;14:1082281. doi: 10.3389/fphar.2023.1082281. eCollection 2023. Front Pharmacol. 2023. PMID: 36733505 Free PMC article.
-
Neferine ameliorates hypertensive vascular remodeling modulating multiple signaling pathways in spontaneously hypertensive rats.Biomed Pharmacother. 2023 Feb;158:114203. doi: 10.1016/j.biopha.2022.114203. Epub 2023 Jan 4. Biomed Pharmacother. 2023. PMID: 36916429
-
Qingda granule attenuates cardiac fibrosis via suppression of the TGF-β1/Smad2/3 signaling pathway in vitro and in vivo.Biomed Pharmacother. 2021 May;137:111318. doi: 10.1016/j.biopha.2021.111318. Epub 2021 Feb 5. Biomed Pharmacother. 2021. PMID: 33556875
-
Upregulation of Transient Receptor Potential Canonical Type 3 Channel via AT1R/TGF-β1/Smad2/3 Induces Atrial Fibrosis in Aging and Spontaneously Hypertensive Rats.Oxid Med Cell Longev. 2019 Nov 23;2019:4025496. doi: 10.1155/2019/4025496. eCollection 2019. Oxid Med Cell Longev. 2019. PMID: 31871548 Free PMC article.
Cited by
-
JiangyaTongluo decoction ameliorates tubulointerstitial fibrosis via regulating the SIRT1/PGC-1α/mitophagy axis in hypertensive nephropathy.Front Pharmacol. 2024 Dec 12;15:1491315. doi: 10.3389/fphar.2024.1491315. eCollection 2024. Front Pharmacol. 2024. PMID: 39726785 Free PMC article.
-
Natural Compounds in Kidney Disease: Therapeutic Potential and Drug Development.Biomol Ther (Seoul). 2025 Jan 1;33(1):39-53. doi: 10.4062/biomolther.2024.142. Epub 2024 Dec 5. Biomol Ther (Seoul). 2025. PMID: 39632648 Free PMC article. Review.
-
Mechanism of Green Tea Peptides in Lowering Blood Pressure and Alleviating Renal Injury Induced by Hypertension Through the Ang II/TGF-β1/SMAD Signaling Pathway.Nutrients. 2025 Apr 8;17(8):1300. doi: 10.3390/nu17081300. Nutrients. 2025. PMID: 40284165 Free PMC article.
-
Traditional Chinese Medicine targeting the TGF-β/Smad signaling pathway as a potential therapeutic strategy for renal fibrosis.Front Pharmacol. 2025 May 20;16:1513329. doi: 10.3389/fphar.2025.1513329. eCollection 2025. Front Pharmacol. 2025. PMID: 40463902 Free PMC article. Review.
-
Renal Health Through Medicine-Food Homology: A Comprehensive Review of Botanical Micronutrients and Their Mechanisms.Nutrients. 2024 Oct 18;16(20):3530. doi: 10.3390/nu16203530. Nutrients. 2024. PMID: 39458524 Free PMC article. Review.
References
MeSH terms
Substances
LinkOut - more resources
Full Text Sources
Medical
Molecular Biology Databases
