. 2023 Aug 22:33:941-959.
doi: 10.1016/j.omtn.2023.08.023. eCollection 2023 Sep 12.

Inhibition of pro-inflammatory signaling in human primary macrophages by enhancing arginase-2 via target site blockers

Affiliations

Inhibition of pro-inflammatory signaling in human primary macrophages by enhancing arginase-2 via target site blockers

Stephen Fitzsimons et al. Mol Ther Nucleic Acids. .

Abstract

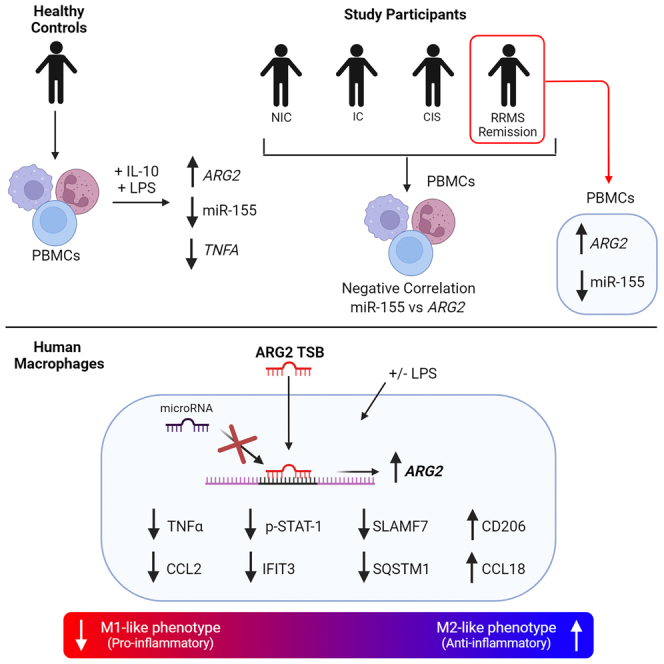
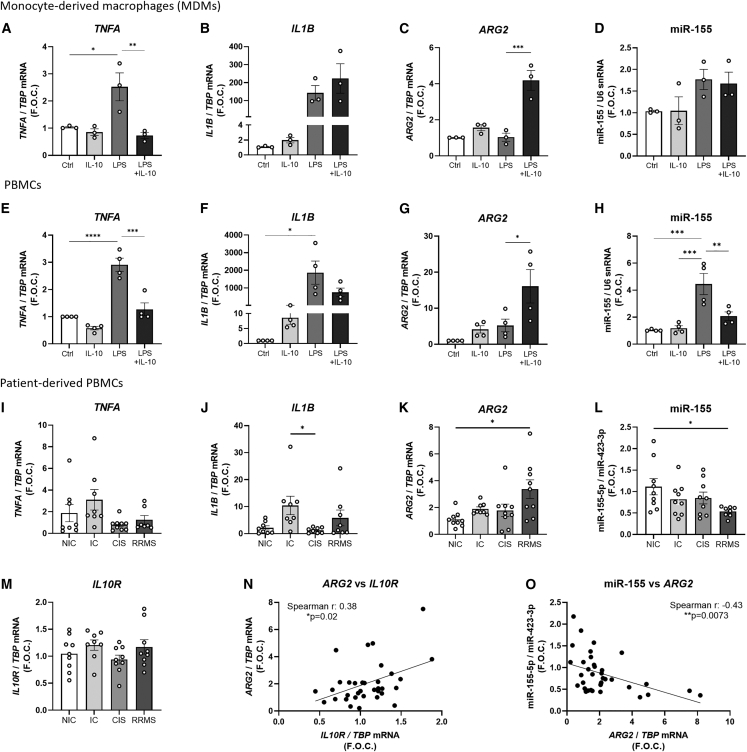
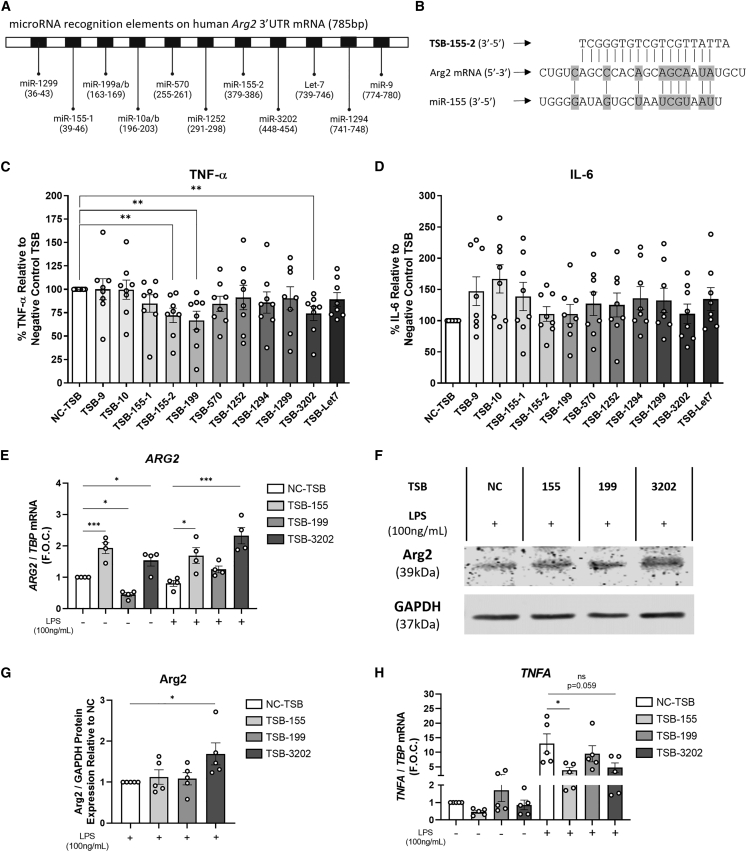
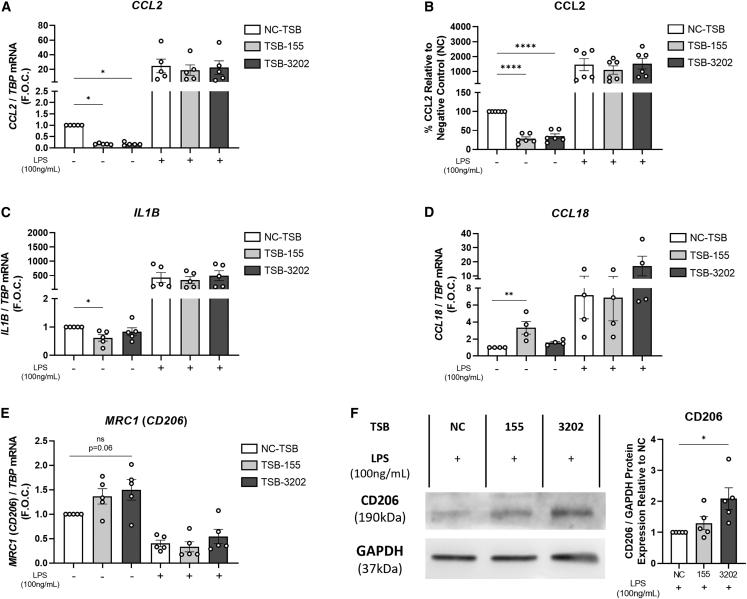
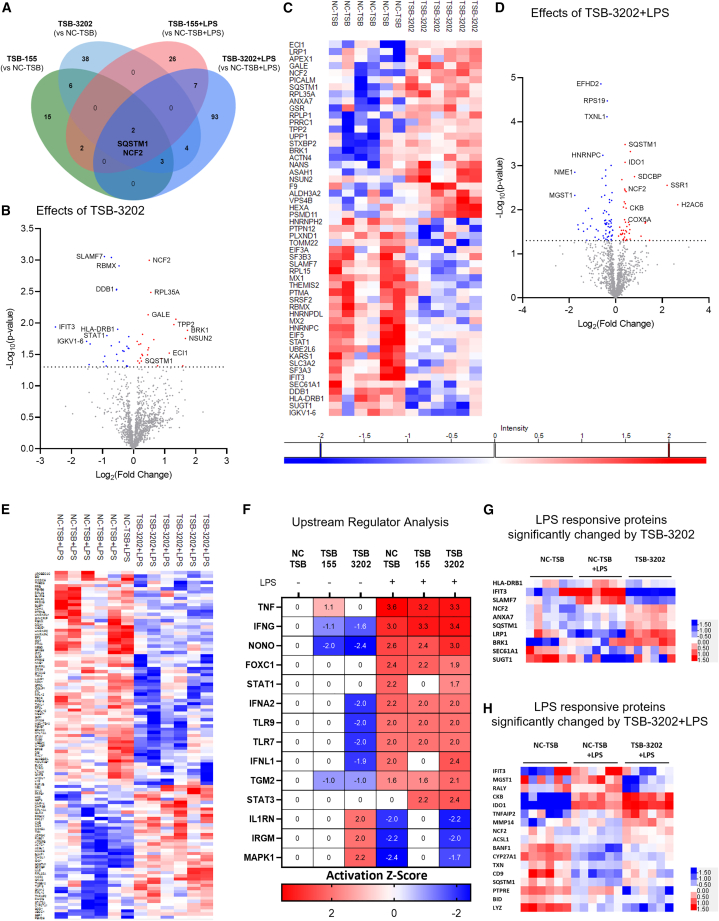
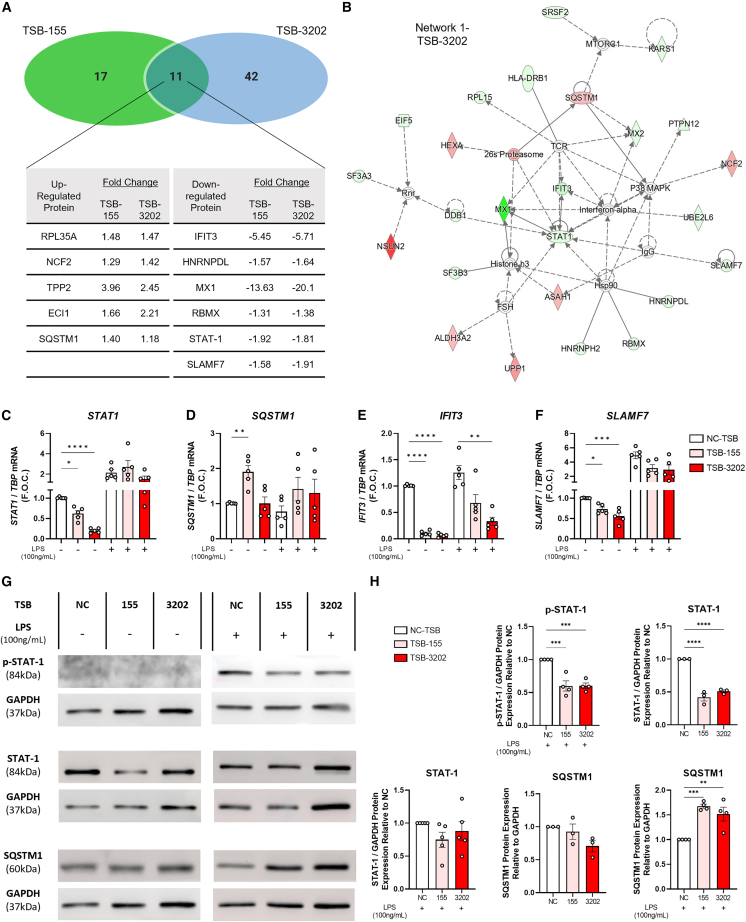
The modulation of macrophage phenotype from a pro-inflammatory to an anti-inflammatory state holds therapeutic potential in the treatment of inflammatory disease. We have previously shown that arginase-2 (Arg2), a mitochondrial enzyme, is a key regulator of the macrophage anti-inflammatory response. Here, we investigate the therapeutic potential of Arg2 enhancement via target site blockers (TSBs) in human macrophages. TSBs are locked nucleic acid antisense oligonucleotides that were specifically designed to protect specific microRNA recognition elements (MREs) in human ARG2 3' UTR mRNA. TSBs targeting miR-155 (TSB-155) and miR-3202 (TSB-3202) MREs increased ARG2 expression in human monocyte-derived macrophages. This resulted in decreased gene expression and cytokine production of TNF-α and CCL2 and, for TSB-3202, in an increase in the anti-inflammatory macrophage marker, CD206. Proteomic analysis demonstrated that a network of pro-inflammatory responsive proteins was modulated by TSBs. In silico bioinformatic analysis predicted that TSB-3202 suppressed upstream pro-inflammatory regulators including STAT-1 while enhancing anti-inflammatory associated proteins. Proteomic data were validated by confirming increased levels of sequestosome-1 and decreased levels of phosphorylated STAT-1 and STAT-1 upon TSB treatment. In conclusion, upregulation of Arg2 by TSBs inhibits pro-inflammatory signaling and is a promising novel therapeutic strategy to modulate inflammatory signaling in human macrophages.

Keywords: MT: Oligonucleotides: Therapies and Applications; arginase-2; inflammation; macrophages; miR-155; microRNA; multiple sclerosis; target site blockers.


Conflict of interest statement

The authors declare no competing interests.

Figures

None
Graphical abstract
Figure 1
Figure 1
Gene expression in stimulated human MDMs and PBMCs and in unstimulated patient-derived PBMCs Expression levels of (A) TNFA, (B) IL1B, (C) ARG2, and (D) miR-155 in stimulated MDMs (n = 3) and of (E) TNFA, (F) IL1B, (G) ARG2, and (H) miR-155 in PBMCs isolated from buffy coat bags donated by healthy donors (n = 4) are shown. TBP was used as the endogenous control while U6 snRNA was used as the control for microRNA analysis and graphed as fold over control (F.O.C.). Expression levels of (I) TNFA, (J) IL1B, (K) ARG2, (L) miR-155, and (M) IL10R in four different participant groups, i.e., non-inflammatory controls (NIC) (n = 9), inflammatory controls (IC) (n = 9), clinically isolated syndrome (CIS) (n = 9), and in patients with relapsing remitting multiple sclerosis (RRMS) (n = 9) where samples were taken during the remission phase, are shown. TBP was used as the endogenous control while miR-423-3p was used as the endogenous microRNA control. Results were graphed as F.O.C. A Spearman’s correlation analysis was performed to analyze the correlation between the expression of ARG2 and (N) IL10R and (O) miR-155 in all PBMC samples. Graphs (A–H) were analyzed using a one-way ANOVA and Tukey’s multiple comparisons test and graphs (I–N) were analyzed using a Kruskal-Wallis test and Dunn’s multiple comparisons test. Correlation analysis was performed using a nonparametric Spearman correlation. ∗p < 0.05, ∗∗p < 0.01, ∗∗∗p < 0.001, ∗∗∗∗p < 0.0001. Error bars are representative of the standard error of the mean (SEM).
Figure 2
Figure 2
Effects of human Arg2 TSBs on Arg2, TNF-α, and IL-6 in human MDMs (A) Schematic of ARG2 3′ UTR mRNA consisting of 785 base pairs (bp) and the predicted miRNA binding sites to the microRNA recognition elements. (B) Schematic illustrating complimentary base pairing of TSB-155-2 and miR-155 with a region in of the 3′ UTR of ARG2 mRNA. Pro-inflammatory cytokine secretion by MDMs transfected with TSBs (100 nM) and stimulated with LPS was analyzed for (C) TNF-α and (D) IL-6 by ELISA and graphed as a percentage relative to the negative control TSB (NC-TSB) stimulated with LPS (n = 8 donors, using experimental triplicates). (E) ARG2 was analyzed by qRT-PCR using TBP as the endogenous control (n = 4). (F) Arg2 protein was analyzed in TSB and LPS stimulated cells by western blot using glyceraldehyde 3-phosphate dehydrogenase (GAPDH) as the control. (G) Densitometry analysis was performed on the Arg2 western blots and normalized to GAPDH and graphed as relative expression to the NC-TSB with LPS (n = 5). Pro-inflammatory gene expression of (H) TNFA was analyzed by RT-PCR using TBP as the control (n = 5). Error bars are representative of the standard error of the mean (SEM). Statistical analysis was performed using multiple independent unpaired t tests for (C and D) and using a one-way ANOVA with Dunnett’s multiple comparison test for (E–H). ns, not statistically significant, ∗p < 0.05, ∗∗p < 0.01, ∗∗∗p < 0.001, ∗∗∗∗p < 0.0001.
Figure 3
Figure 3
Effects of Arg2 TSBs in human MDMs on pro- and anti-inflammatory markers (A) CCL2 was analyzed by RT-PCR using TBP as the control and graphed as F.O.C. in MDMs transfected with TSB-NC, TSB-155, and TSB-3202, in the presence or absence of LPS stimulation (n = 5). (B) Supernatants were analyzed by ELISA for CCL2 and graphed as a percentage relative to NC-TSB (n = 6). (C) IL1B pro-inflammatory gene expression was analyzed by RT-PCR using TBP as the control and graphed as F.O.C. (n = 5). The anti-inflammatory associated genes (D) CCL18 and (E) MRC1 (CD206) were analyzed by RT-PCR using TBP as the control and graphed as F.O.C. (4 ≤ n ≤ 5). (F) CD206 was analyzed in TSB-treated cells stimulated with LPS by western blot using GAPDH as the loading control. Densitometry analysis was performed on CD206 western blots and normalized to GAPDH and graphed as relative expression to the NC-TSB with LPS (n = 5). Error bars are representative of the SEM. Statistical analysis was performed on using a one-way ANOVA with Dunnett’s multiple comparison test on all graphs. ns, not statistically significant; ∗p < 0.05, ∗∗p < 0.01, ∗∗∗p < 0.001, ∗∗∗∗p < 0.0001.
Figure 4
Figure 4
Mass spectrometry-based proteomic analysis of the effects of Arg2 TSBs in human MDMs (A) A Venn diagram was used to illustrate the number and overlap of significantly differentially expressed proteins in MDMs transfected with TSB-NC, TSB-155, and TSB-3202, in the presence or absence of LPS stimulation (n = 3 independent experiments, performed in duplicate). Group comparisons made were included on the Venn diagram. (B) Volcano plot showing the effects of TSB-3202 compared with NC-TSB based on a Log2 (fold change) and –Log10 (p value). Proteins with a significant p value of <0.05 (–Log10 p > 1.3) are highlighted in red (increased fold change) and blue (decreased fold change). (C) Heatmap representing the effects of TSB-3202 compared with NC-TSB, where LFQ intensities of significantly changed proteins are represented as Z scores. (D) Volcano plot showing the effects of TSB-3202 + LPS compared with NC-TSB + LPS based on a Log2 (fold change) and –Log10 (p value). Proteins with a significant p value of <0.05 (-Log10 p value of >1.3) were highlighted in red and blue. (E) Heatmap representing the effects of TSB-3202 + LPS compared with NC-TSB + LPS (n = 3 independent experiments, performed in duplicate). (F) All treatment conditions were compared with NC-TSB and the lists of significantly changed proteins were analyzed by Ingenuity Pathway Analysis software (QIAGEN) to determine the upstream regulators and their activation Z scores (p < 0.01). Upstream regulators with an activation Z score ≥1.6 or ≤ −1.6 modulated by NC-TSB + LPS were graphed alongside STAT-3 to highlight the upstream regulators of LPS. The corresponding activation Z scores of TSB-3202 and TSB-155 with and without LPS were included, the p value of overlap was p < 0.01. Comparison of the NC-TSB with NC-TSB + LPS was used to generate a list of LPS-responsive proteins, which was intersected with the proteins that were significantly changed by (G) TSB-3202 treatment (vs. TSB-NC) and (H) TSB-3202 + LPS treatment (vs. NC-TSB + LPS). Z scores were used to generate heatmaps. Error bars are representative of the standard error of the mean (SEM). Statistical analysis was performed on proteomic data using a Student’s t test to identify the significantly changed proteins.
Figure 5
Figure 5
Validation of the effects of Arg2 TSBs on inflammatory signaling targets identified by mass spectrometry analysis (A) Venn diagram representing the overlap between the effects of TSB-155 and TSB-3202 on protein expression with a table showing the signed fold change of significantly upregulated and downregulated proteins altered by TSB-155 and TSB-3202 as analyzed by mass spectrometry. (B) Interactive IPA network of the effects of TSB-3202. Genes with red (upregulated) nodes and green (downregulated) nodes are the significantly changed proteins in the TSB-3202 dataset, others (clear nodes) are generated/predicted through the network analysis from the IPA QIAGEN Knowledge Base. (C) STAT1, (D) SQSTM1, (E) IFIT3, and (F) SLAMF7 were analyzed by RT-PCR using TBP as the endogenous control and graphed as F.O.C. in MDMs transfected with TSB-NC, TSB-155, and TSB-3202, in the presence or absence of LPS stimulation (n = 5). (G) Phosphorylated STAT-1 (p-STAT-1), STAT-1, and SQSTM1 were analyzed by western blot using GAPDH as the endogenous control in MDMs transfected with TSB-NC, TSB-155, and TSB-3202, in the presence or absence of LPS stimulation (n = 3–5). (H) Densitometry analysis was performed on the protein of interest and normalized to GAPDH and graphed as relative expression to the NC-TSB with and without LPS. Please note that in the absence of LPS, membranes were re-probed for SQSTM1 hence the same GAPDH western blot was used as the control for both p-STAT-1 and SQSTM1. Error bars are representative of the SEM. Statistical analysis was performed using a one-way ANOVA with Dunnett’s multiple comparison test. ∗p < 0.05, ∗∗p < 0.01, ∗∗∗p < 0.001, ∗∗∗∗p < 0.0001.

Similar articles

Cited by

References

    1. Schultze J.L., Schmieder A., Goerdt S. Macrophage activation in human diseases. Semin. Immunol. 2015;27:249–256. - PubMed
    1. Parisi L., Gini E., Baci D., Tremolati M., Fanuli M., Bassani B., Farronato G., Bruno A., Mortara L. Macrophage Polarization in Chronic Inflammatory Diseases: Killers or Builders? J. Immunol. Res. 2018;2018:8917804. - PMC - PubMed
    1. Chu F., Shi M., Zheng C., Shen D., Zhu J., Zheng X., Cui L. The roles of macrophages and microglia in multiple sclerosis and experimental autoimmune encephalomyelitis. J. Neuroimmunol. 2018;318:1–7. - PubMed
    1. Peterson K.R., Cottam M.A., Kennedy A.J., Hasty A.H. Macrophage-Targeted Therapeutics for Metabolic Disease. Trends Pharmacol. Sci. 2018;39:536–546. - PMC - PubMed
    1. Ponzoni M., Pastorino F., Di Paolo D., Perri P., Brignole C. Targeting Macrophages as a Potential Therapeutic Intervention: Impact on Inflammatory Diseases and Cancer. Int. J. Mol. Sci. 2018;19:1953. - PMC - PubMed