

Altered brain network organization in adults with Asperger's syndrome: decreased connectome transitivity and assortativity with increased global efficiency
- PMID: 37701094
- PMCID: PMC10494541
- DOI: 10.3389/fpsyt.2023.1223147
Altered brain network organization in adults with Asperger's syndrome: decreased connectome transitivity and assortativity with increased global efficiency
Abstract
Introduction: Autism spectrum disorder (ASD) is a neurodevelopmental disorder that persists into adulthood with both social and cognitive disturbances. Asperger's syndrome (AS) was a distinguished subcategory of autism in the DSM-IV-TR defined by specific symptoms including difficulties in social interactions, inflexible thinking patterns, and repetitive behaviour without any delay in language or cognitive development. Studying the functional brain organization of individuals with these specific symptoms may help to better understand Autism spectrum symptoms.
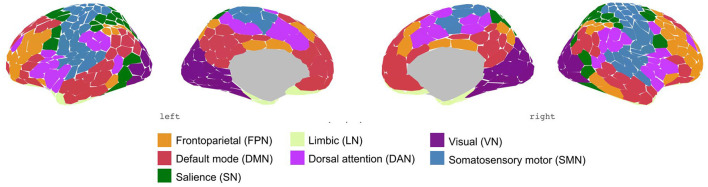
Methods: The aim of this study is therefore to investigate functional connectivity as well as functional network organization characteristics using graph-theory measures of the whole brain in male adults with AS compared to healthy controls (HC) (AS: n = 15, age range 21-55 (mean ± sd: 39.5 ± 11.6), HC: n = 15, age range 22-57 [mean ± sd: 33.5 ± 8.5]).
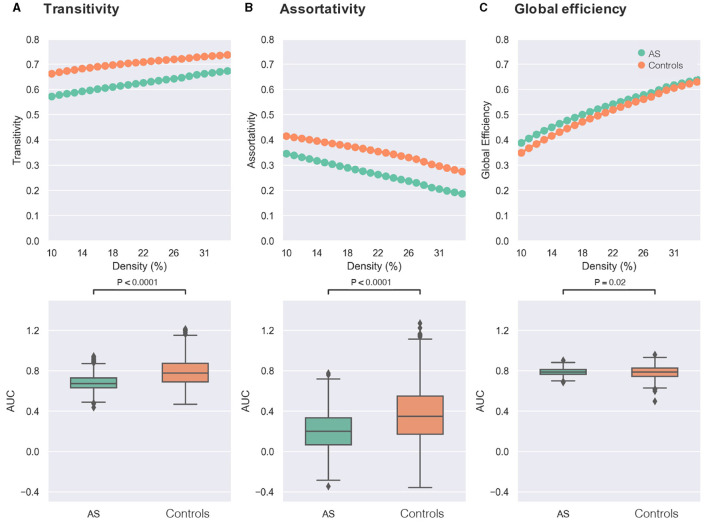
Results: No significant differences were found when comparing the region-by-region connectivity at the whole-brain level between the AS group and HC. However, measures of "transitivity," which reflect local information processing and functional segregation, and "assortativity," indicating network resilience, were reduced in the AS group compared to HC. On the other hand, global efficiency, which represents the overall effectiveness and speed of information transfer across the entire brain network, was increased in the AS group.
Discussion: Our findings suggest that individuals with AS may have alterations in the organization and functioning of brain networks, which could contribute to the distinctive cognitive and behavioural features associated with this condition. We suggest further research to explore the association between these altered functional patterns in brain networks and specific behavioral traits observed in individuals with AS, which could provide valuable insights into the underlying mechanisms of its symptomatology.
Keywords: Asperger's syndrome (AS); autism spectrum disorder (ASD); autism spectrum traits; graph theory; resting-state functional magnetic resonance imaging (rs-fMRI).
Copyright © 2023 Javaheripour, Wagner, de la Cruz, Walter, Szycik and Tietze.
Conflict of interest statement
MW is a member of the following advisory boards and gave presentations to the following companies: Bayer AG, Germany; Boehringer Ingelheim, Germany; and Biologische HeilmittelHeel GmbH, Germany, conducted studies with institutional research support from HEEL and Janssen Pharmaceutical Research for a clinical trial (IIT) on ketamine in patients with MDD, unrelated to this investigation, and did not receive any financial compensation from the companies mentioned above. The remaining authors declare that the research was conducted in the absence of any commercial or financial relationships that could be construed as a potential conflict of interest.
Figures
References
-
- American Psychiatric Association, American Psychiatric Association. Diagnostic and Statistical Manual of Mental Disorders: DSM-5. 5th ed. Washington, DC: American Psychiatric Association; (2013). p. 947.
-
- American Psychiatric Association, American Psychiatric Association. Diagnostic and Statistical Manual of Mental Disorders: DSM-IV-TR. 4th ed. Washington, DC: American Psychiatric Association; (2000). p. 943.
-
- World Health Organization . The ICD-10 Classification of Mental and Behavioural Disorders: Clinical Descriptions and Diagnostic Guidelines. Geneva: World Health Organization; (1992). p. 362.
LinkOut - more resources
Full Text Sources