

Exploring prognostic markers for patients with acute myeloid leukemia based on cuproptosis related genes
- PMID: 37701119
- PMCID: PMC10493802
- DOI: 10.21037/tcr-23-85
Exploring prognostic markers for patients with acute myeloid leukemia based on cuproptosis related genes
Abstract
Background: Acute myeloid leukemia (AML), a common form of acute leukemia, is due to tumor changes and clonal proliferation caused by genetic variants. Cuproptosis is a novel form of regulated cell death. This study aimed to explore the role of cuproptosis-related genes (CRGs) in AML.
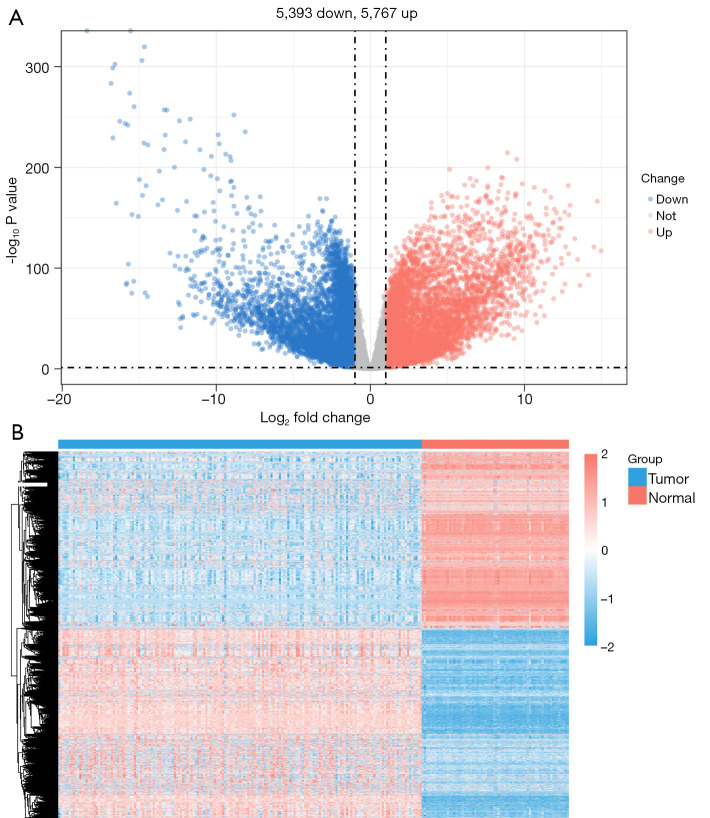
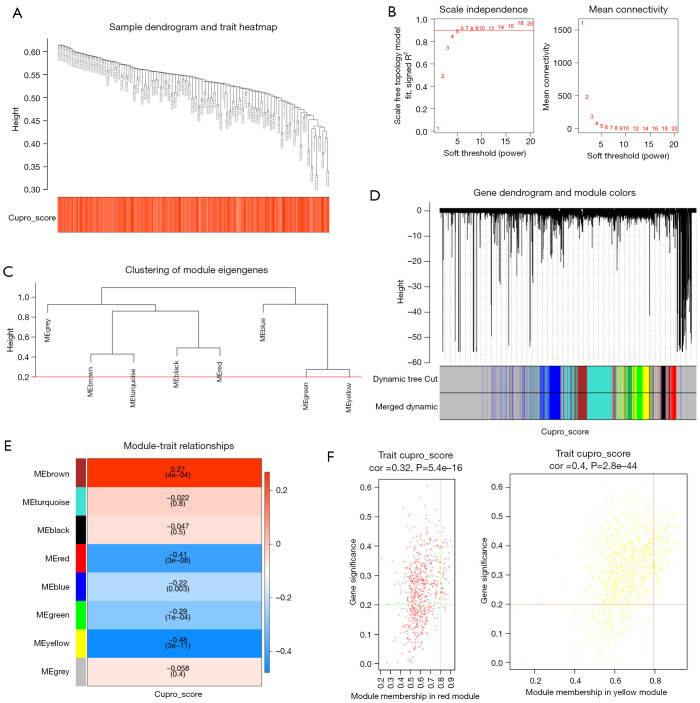
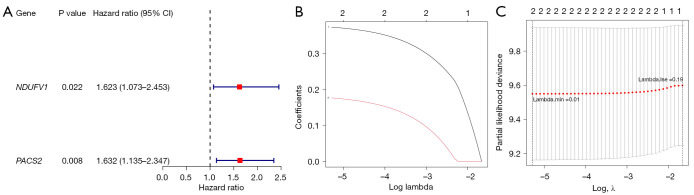
Methods: Initially, differentially expressed genes (DEGs) between AML samples and normal samples were obtained by differential analysis, which were further intersected with the cuproptosis score-related genes (CSRGs) acquired by weighted gene co-expression network analysis (WGCNA) to obtain cuproptosis score-related differentially expressed genes (CS-DEGs). Then, a risk model was constructed by Cox analysis and least absolute shrinkage and selection operator (LASSO) analysis. Finally, immune infiltration analysis was performed and the functions and pathways of model genes were explored by single sample gene set enrichment analysis (ssGSEA).
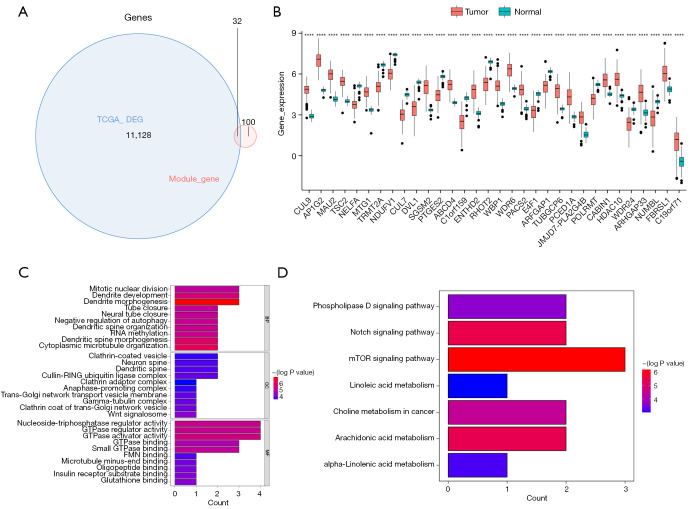
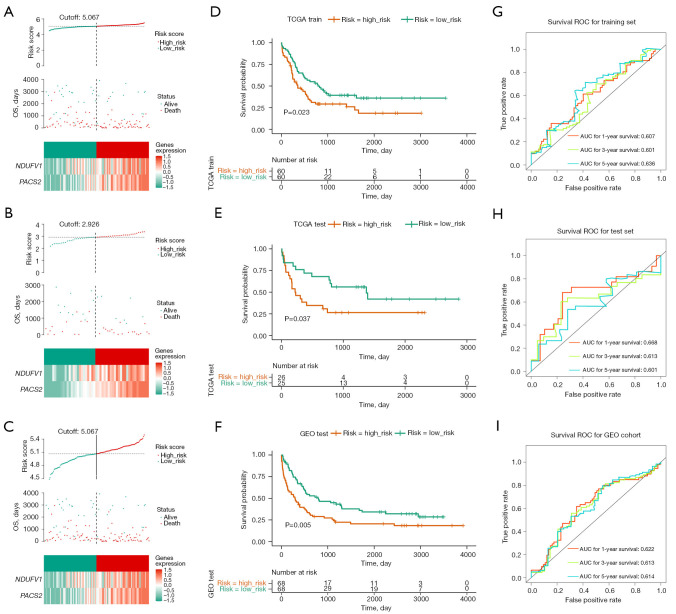
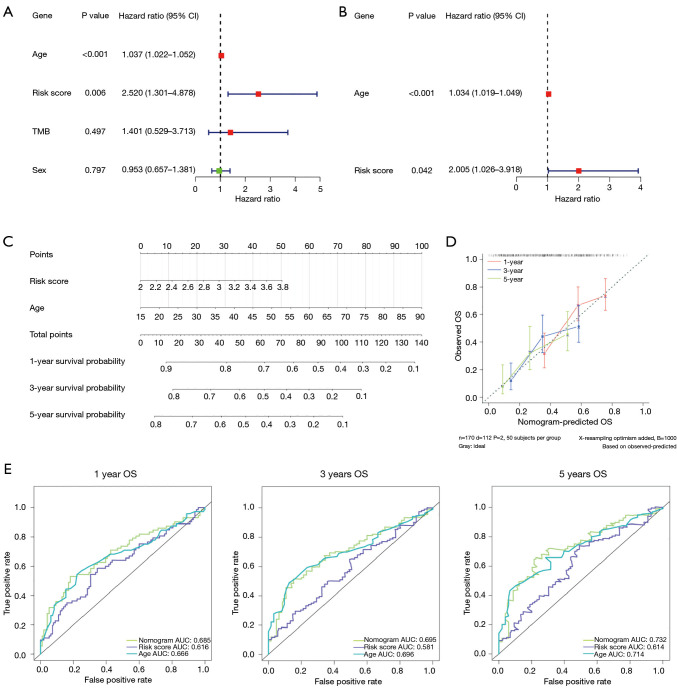
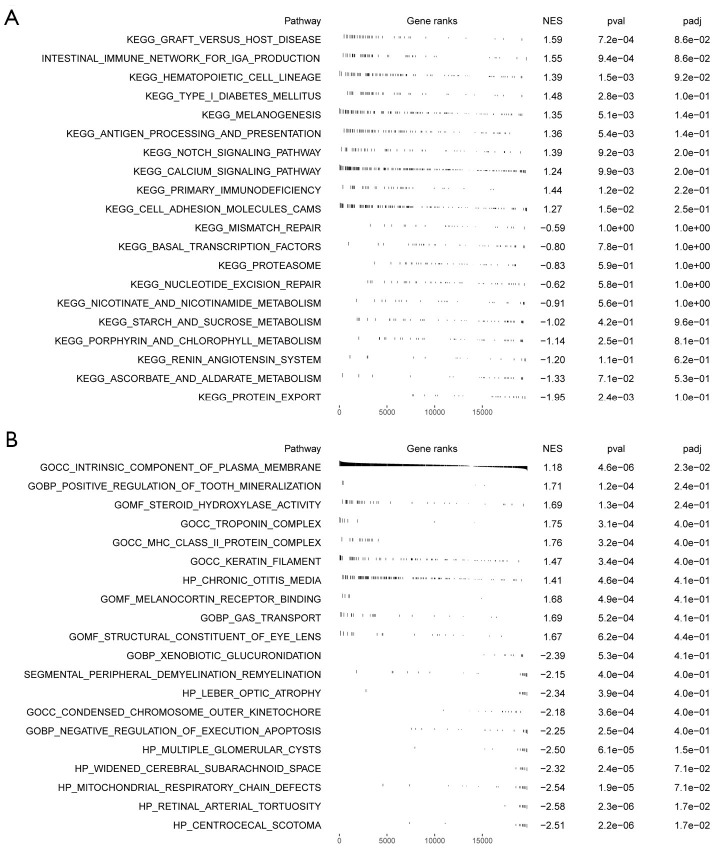
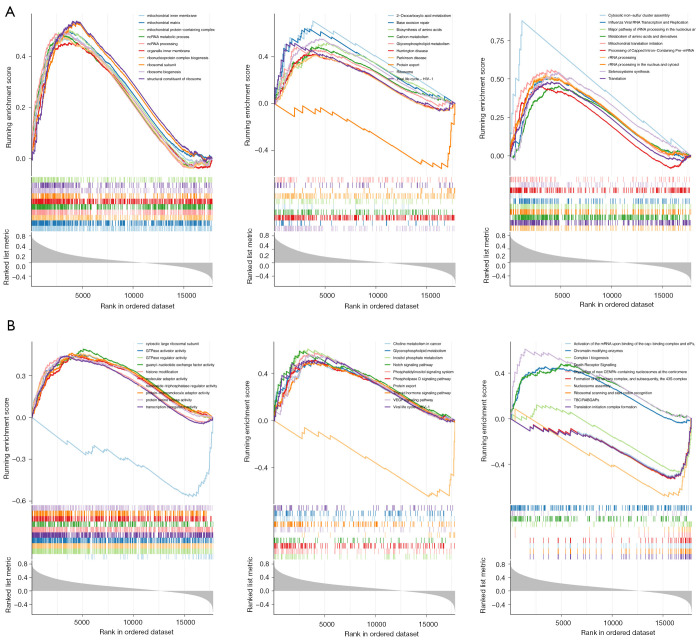
Results: Thirty-two CS-DEGs were obtained by overlapping 11,160 DEGs and 132 CSRGs. These 32 CS-DEGs were mainly enriched to cytoplasmic microtubule organization, RNA methylation, mTOR signaling pathway, and notch signaling pathway. Two model genes, PACS2 and NDUFV1, were finally screened for the construction of the risk model. In addition, PACS2 and NDUFV1 were significantly positively correlated with activated B cells, CD56dim natural killer (NK) cells, and negatively correlated with effector memory CD4 T cells and activated CD4 T cells. PACS2 gene was significantly enriched to inositol phosphate metabolism, histone modification, etc. NDUFV1 was mainly enriched to ncRNA metabolic process, 2-oxocarboxylic acid metabolism, and other pathways.
Conclusions: A cuproptosis-related risk model consisting of PACS2 and NDUFV1 was built, which provided a new direction for the diagnosis and treatment of AML.
Keywords: Acute myeloid leukemia (AML); bioinformatics; cuproptosis; prognostic markers; risk model.
2023 Translational Cancer Research. All rights reserved.
Conflict of interest statement
Conflicts of Interest: Both authors have completed the ICMJE uniform disclosure form (available at https://tcr.amegroups.com/article/view/10.21037/tcr-23-85/coif). LX reports the funding from the Social Development Project of Shanxi Province (No. 201703D321014-3), Research Project Supported by Shanxi Scholarship Council of China (No. 2020-189), and Fund Program for the Scientific Activities of Selected Returned Overseas Professionals in Shanxi Province (No. 20210007). The other author has no conflicts of interest to declare.
Figures
Similar articles
-
Identification of cuproptosis-related subtypes, construction of a prognosis model, and tumor microenvironment landscape in gastric cancer.Front Immunol. 2022 Nov 21;13:1056932. doi: 10.3389/fimmu.2022.1056932. eCollection 2022. Front Immunol. 2022. PMID: 36479114 Free PMC article.
-
Characterization of cuproptosis identified immune microenvironment and prognosis in acute myeloid leukemia.Clin Transl Oncol. 2023 Aug;25(8):2393-2407. doi: 10.1007/s12094-023-03118-4. Epub 2023 Feb 24. Clin Transl Oncol. 2023. PMID: 36826709
-
A novel cuproptosis-related LncRNA signature: Prognostic and therapeutic value for acute myeloid leukemia.Front Oncol. 2022 Oct 7;12:966920. doi: 10.3389/fonc.2022.966920. eCollection 2022. Front Oncol. 2022. PMID: 36276132 Free PMC article.
-
Identification of Key Genes and Immunological Features Associated with Copper Metabolism in Parkinson's Disease by Bioinformatics Analysis.Mol Neurobiol. 2024 Feb;61(2):799-811. doi: 10.1007/s12035-023-03565-8. Epub 2023 Sep 2. Mol Neurobiol. 2024. PMID: 37659036
-
Comprehensive analysis of a cuproptosis-related ceRNA network implicates a potential endocrine therapy resistance mechanism in ER-positive breast cancer.BMC Med Genomics. 2023 May 5;16(1):96. doi: 10.1186/s12920-023-01511-0. BMC Med Genomics. 2023. PMID: 37143115 Free PMC article.
Cited by
-
Identifying key genes and functionally enriched pathways in acute myeloid leukemia by weighted gene co-expression network analysis.J Appl Genet. 2025 May;66(2):347-362. doi: 10.1007/s13353-024-00881-0. Epub 2024 Jul 9. J Appl Genet. 2025. PMID: 38977582
References
LinkOut - more resources
Full Text Sources
Research Materials
Miscellaneous