

A Retrospective Cohort Study: Predicting 90-Day Mortality for ICU Trauma Patients with a Machine Learning Algorithm Using XGBoost Using MIMIC-III Database
- PMID: 37701177
- PMCID: PMC10493110
- DOI: 10.2147/JMDH.S416943
A Retrospective Cohort Study: Predicting 90-Day Mortality for ICU Trauma Patients with a Machine Learning Algorithm Using XGBoost Using MIMIC-III Database
Abstract
Objective: The aim of this study was to develop and validate a machine learning-based predictive model that predicts 90-day mortality in ICU trauma patients.
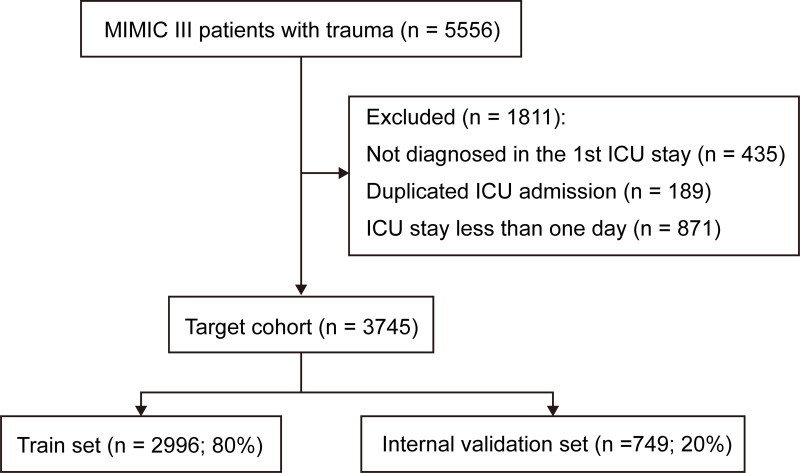
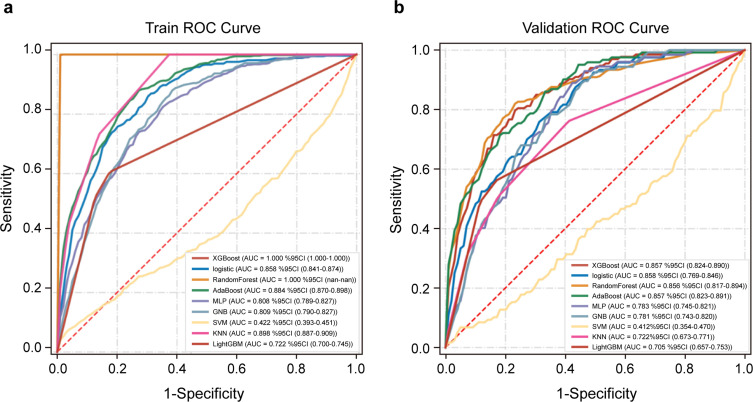
Methods: Data of patients with severe trauma were extracted from the Medical Information Mart for Intensive Care III (MIMIC-III) database. The performances of mortality prediction models generated using nine machine learning extreme gradient boosting (XGBoost), logistic regression, random forest, AdaBoost, multilayer perceptron (MLP) neural networks, support vector machine (SVM), light gradient boosting machine (GBM), k nearest neighbors (KNN) and gaussian naive bayes (GNB). The performance of the model was evaluated in terms of discrimination, calibration and clinical application.
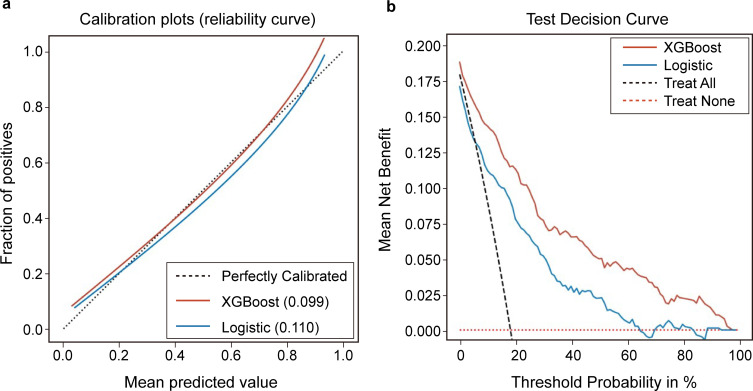
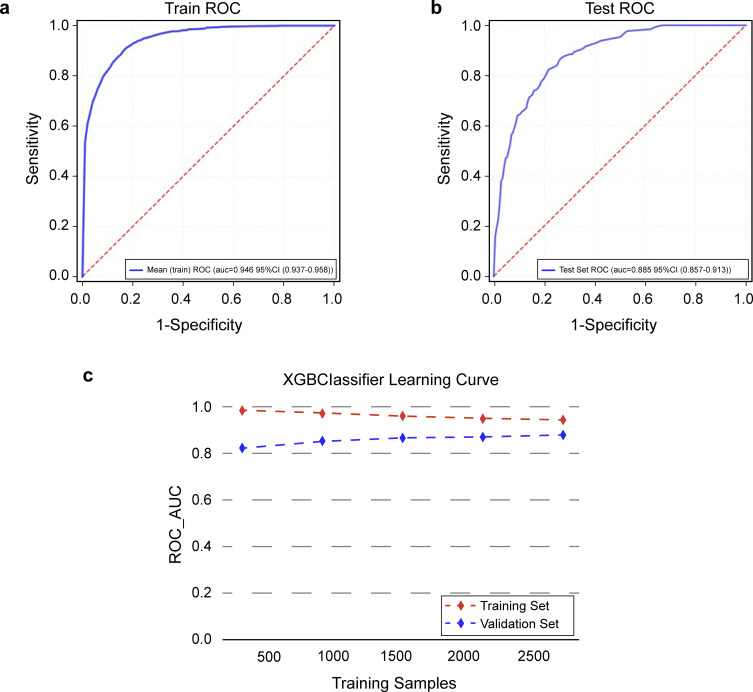
Results: We found that the accuracy, sensitivity, specificity, PPV, NPV and F1 score of our proposed XGBoost model were 82.8%, 79.7%, 77.6%, 51.2%, 91.5% and 0.624, respectively. Among the nine models, the XGBoost model performed best. Compared with traditional logistic regression, the calibration curves of the XGBoost model and decision curve analysis (DCA) performed well.
Conclusion: Our study shows that the XGBoost model outperforms other machine learning models in predicting 90-day mortality in trauma patients. It can be used to assist clinicians in the early identification of mortality risk factors and early intervention to reduce mortality.
Keywords: MIMIC-III; XGBoost; intensive care unit; mortality; prediction model; severe trauma patient.
© 2023 Yang et al.
Conflict of interest statement
All authors have no competing interests in this work.
Figures
Similar articles
-
Machine learning for the prediction of acute kidney injury in patients with sepsis.J Transl Med. 2022 May 13;20(1):215. doi: 10.1186/s12967-022-03364-0. J Transl Med. 2022. PMID: 35562803 Free PMC article.
-
Early prediction of sepsis associated encephalopathy in elderly ICU patients using machine learning models: a retrospective study based on the MIMIC-IV database.Front Cell Infect Microbiol. 2025 Apr 17;15:1545979. doi: 10.3389/fcimb.2025.1545979. eCollection 2025. Front Cell Infect Microbiol. 2025. PMID: 40313459 Free PMC article.
-
[Construction of a predictive model for in-hospital mortality of sepsis patients in intensive care unit based on machine learning].Zhonghua Wei Zhong Bing Ji Jiu Yi Xue. 2023 Jul;35(7):696-701. doi: 10.3760/cma.j.cn121430-20221219-01104. Zhonghua Wei Zhong Bing Ji Jiu Yi Xue. 2023. PMID: 37545445 Chinese.
-
Artificial intelligence in clinical care amidst COVID-19 pandemic: A systematic review.Comput Struct Biotechnol J. 2021;19:2833-2850. doi: 10.1016/j.csbj.2021.05.010. Epub 2021 May 7. Comput Struct Biotechnol J. 2021. PMID: 34025952 Free PMC article. Review.
-
Predicting sepsis onset in ICU using machine learning models: a systematic review and meta-analysis.BMC Infect Dis. 2023 Sep 27;23(1):635. doi: 10.1186/s12879-023-08614-0. BMC Infect Dis. 2023. PMID: 37759175 Free PMC article.
Cited by
-
Validation of the China mortality prediction model in trauma based on the ICD-10-CM codes.Medicine (Baltimore). 2024 Jun 21;103(25):e38537. doi: 10.1097/MD.0000000000038537. Medicine (Baltimore). 2024. PMID: 38905411 Free PMC article.
-
Predicting 30-day mortality in severely injured elderly patients with trauma in Korea using machine learning algorithms: a retrospective study.J Trauma Inj. 2024 Sep;37(3):201-208. doi: 10.20408/jti.2024.0024. Epub 2024 Aug 8. J Trauma Inj. 2024. PMID: 39428729 Free PMC article.
References
LinkOut - more resources
Full Text Sources
