. 2023 Aug 28:14:1231898.
doi: 10.3389/fimmu.2023.1231898. eCollection 2023.

Identification and validation of key biomarkers based on RNA methylation genes in sepsis

Affiliations

Identification and validation of key biomarkers based on RNA methylation genes in sepsis

Qianqian Zhang et al. Front Immunol. .

Abstract

Background: RNA methylation is closely involved in immune regulation, but its role in sepsis remains unknown. Here, we aim to investigate the role of RNA methylation-associated genes (RMGs) in classifying and diagnosing of sepsis.

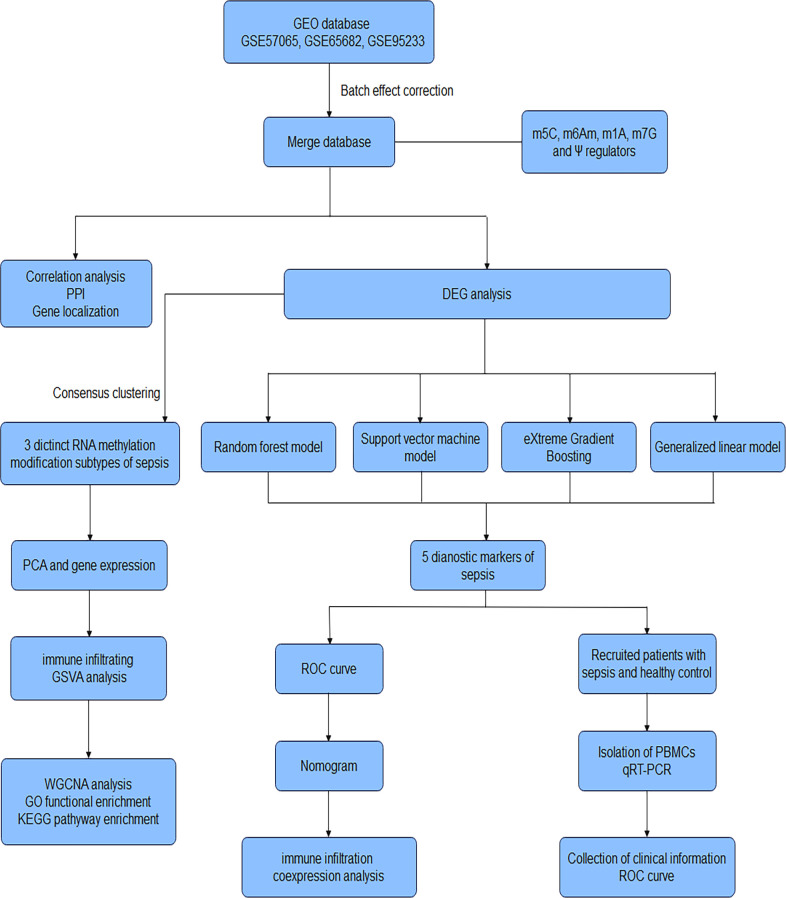
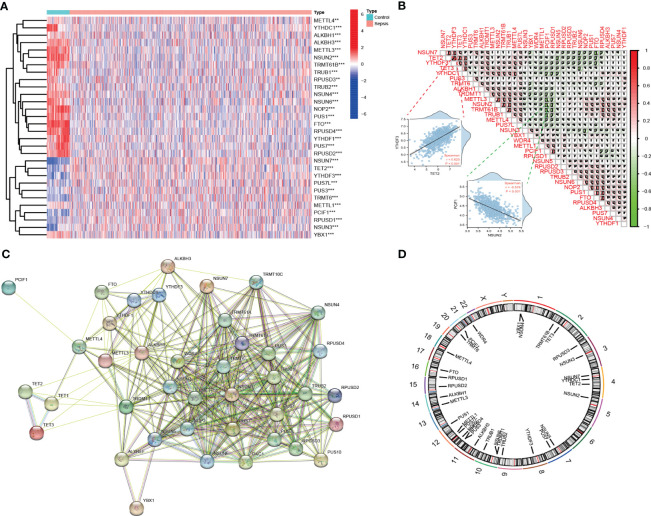
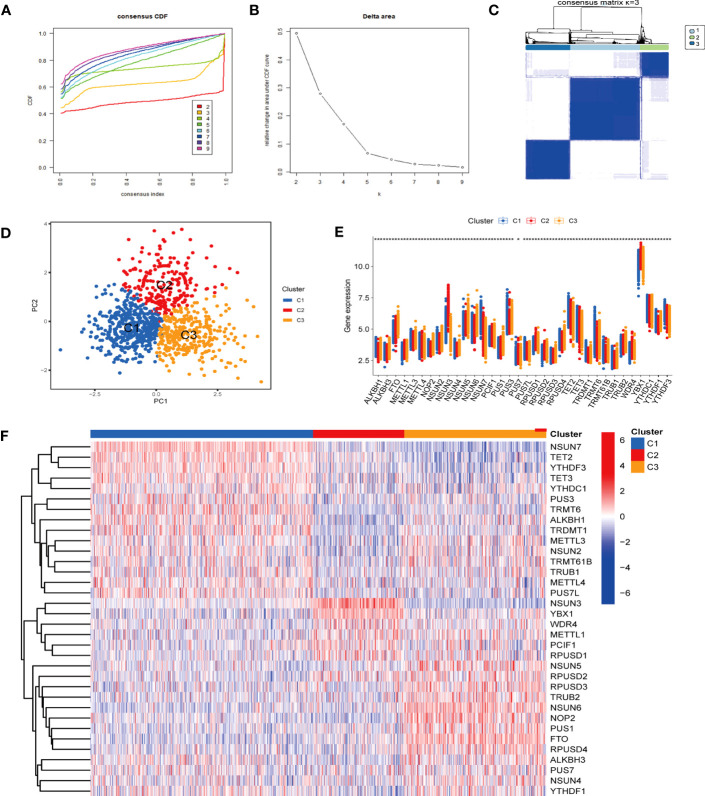
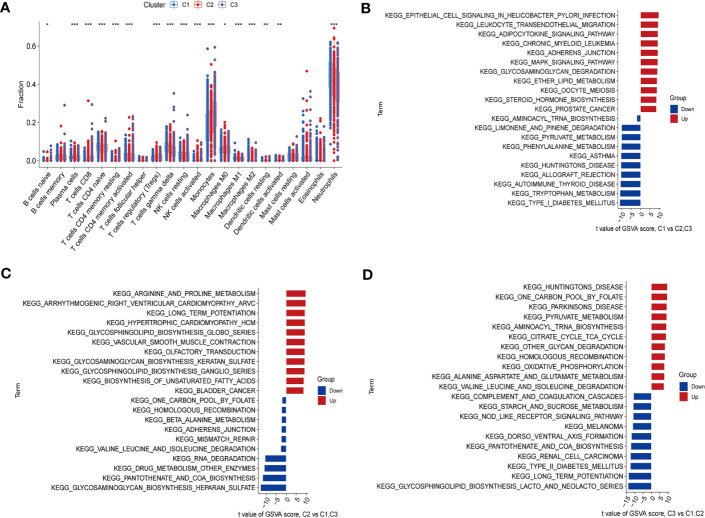
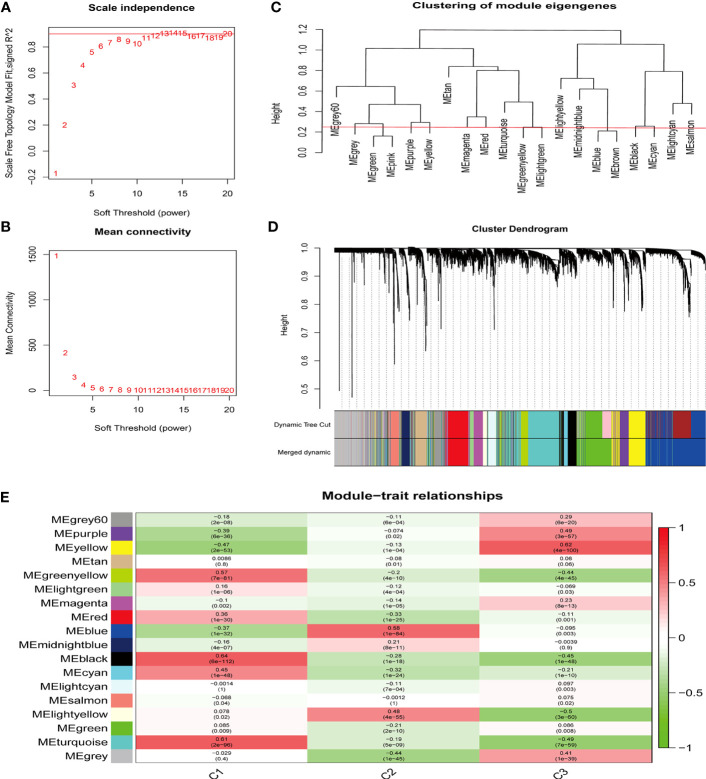
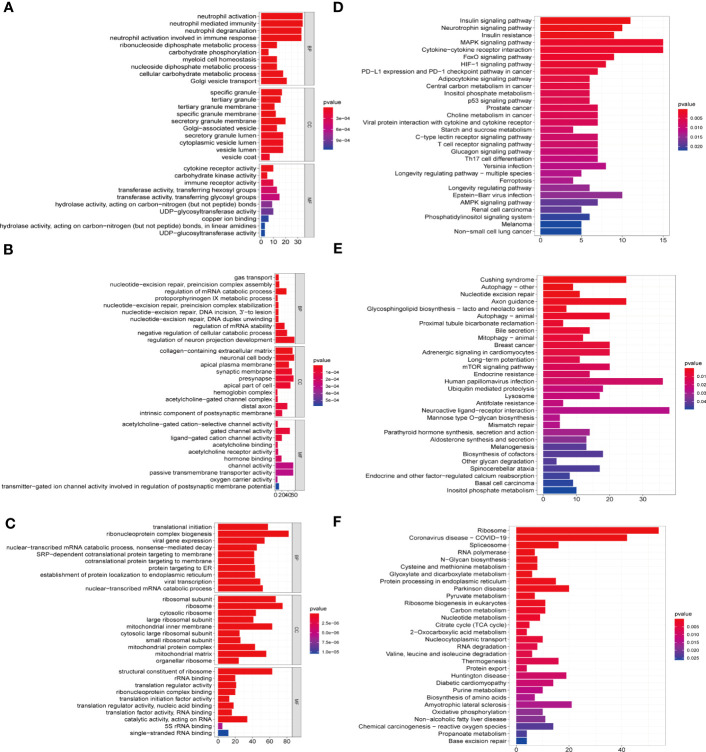
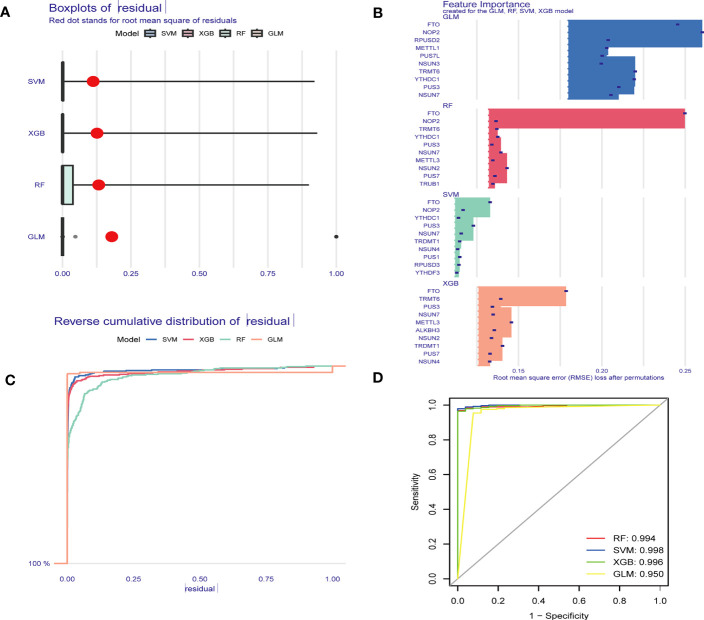
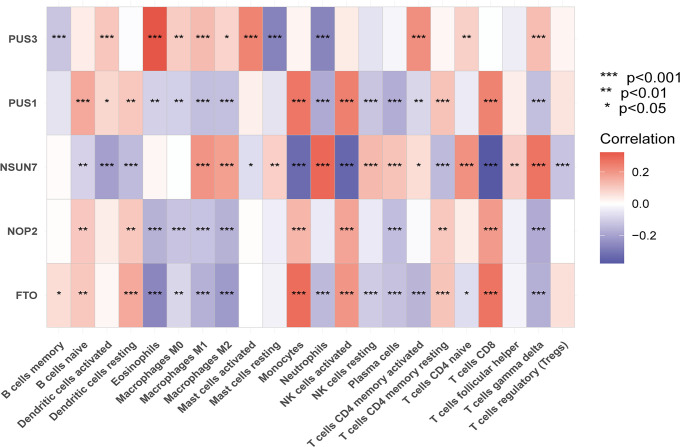
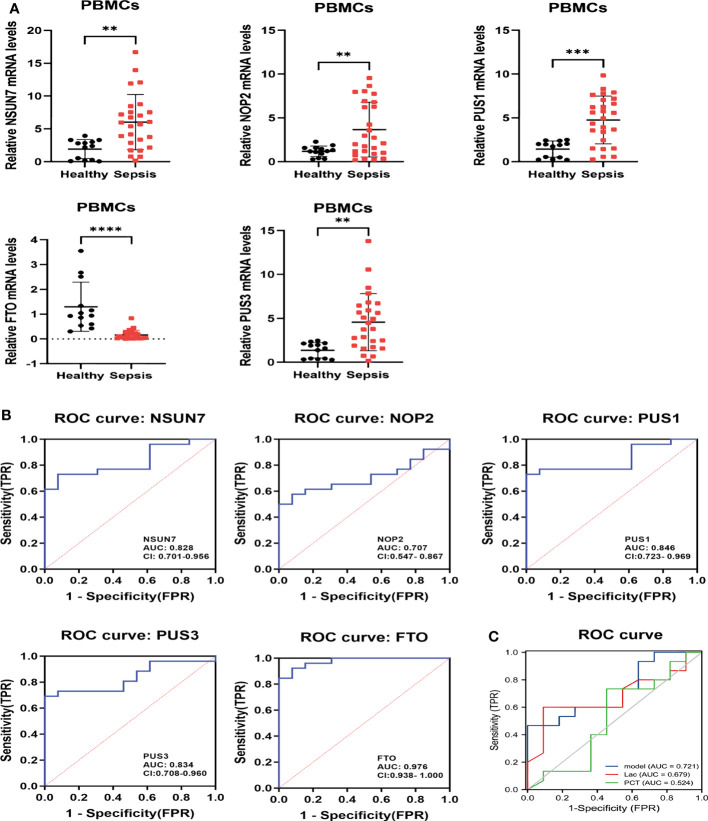
Methods: Five types of RMGs (m1A, m5C, m6Am, m7G and Ψ) were used to identify sepsis subgroups based on gene expression profile data obtained from the GEO database (GSE57065, GSE65682, and GSE95233). Unsupervised clustering analysis was used to identify distinct RNA modification subtypes. The CIBERSORT, WGCNA, GO and KEGG analysis were performed to explore immune infiltration pattern and biological function of each cluster. RF, SVM, XGB, and GLM algorithm were applied to identify the diagnostic RMGs in sepsis. Finally, the expression levels of the five key RMGs were verified by collecting PBMCs from septic patients using qRT-PCR, and their diagnostic efficacy for sepsis was verified in combination with clinical data using ROC analysis.

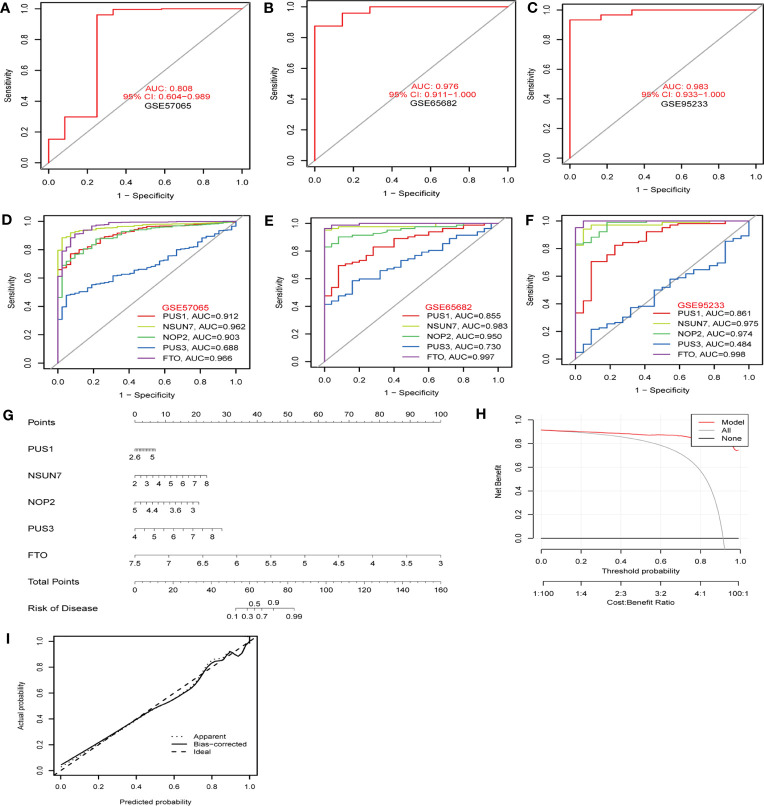
Results: Sepsis was divided into three subtypes (cluster 1 to 3). Cluster 1 highly expressed NSUN7 and TRMT6, with the characteristic of neutrophil activation and upregulation of MAPK signaling pathways. Cluster 2 highly expressed NSUN3, and was featured by the regulation of mRNA stability and amino acid metabolism. NSUN5 and NSUN6 were upregulated in cluster 3 which was involved in ribonucleoprotein complex biogenesis and carbohydrate metabolism pathways. In addition, we identified that five RMGs (NSUN7, NOP2, PUS1, PUS3 and FTO) could function as biomarkers for clinic diagnose of sepsis. For validation, we determined that the relative expressions of NSUN7, NOP2, PUS1 and PUS3 were upregulated, while FTO was downregulated in septic patients. The area under the ROC curve (AUC) of NSUN7, NOP2, PUS1, PUS3 and FTO was 0.828, 0.707, 0.846, 0.834 and 0.976, respectively.

Conclusions: Our study uncovered that dysregulation of RNA methylation genes (m1A, m5C, m6Am, m7G and Ψ) was closely involved in the pathogenesis of sepsis, providing new insights into the classification of sepsis endotypes. We also revealed that five hub RMGs could function as novel diagnostic biomarkers and potential targets for treatment.

Keywords: RNA methylation; biomarkers; machine learning; sepsis; unsupervised clustering.


Conflict of interest statement

The authors declare that the research was conducted in the absence of any commercial or financial relationships that could be construed as a potential conflict of interest.

Figures

Figure 1
Figure 1
Workflow of the research. GEO Gene Expression Omnibus, m5C 5-methylcytosine, m6Am 2’-O-dimethyladenosine, m1A N1-methyladenosine, m7G N7-methylguanosine, Ψ Pseudouridine, PPI protein-protein interaction, DEG Differentially expressed gene, PCA Principal Component Analysis, GSVA Gene Set Variation Analysis, WGCNA Weighted gene co-expression network analysis, GO Gene Ontology, KEGG Kyoto Encyclopedia of Genes and Genomes, ROC receiver operating characteristic curve, qRT-PCR Quantitative reverse-transcription polymerase chain reaction, PBMCs peripheral blood mononuclear cells.
Figure 2
Figure 2
Landscape of expression and genetic variation of RNA methylation regulators in sepsis. (A) The heatmap shows the expression of RMGs obtained from integrated gene expression matrix. In the heatmap, rows represent transcripts, and columns represent samples (Medium Turquoise represents normal profiles, LightPink represents disease profiles). Red represents significantly upregulated genes and blue represents significantly downregulated genes in the samples. **P < 0.01, and ***P < 0.001 vs. The healthy group. (B) Spearman correlation analysis of the studied RMGs, the two scatter plots displayed the most positively or negatively correlated RMGs. (C) The protein-protein interaction between RMGs. (D) The chromosomal locations of RMGs across 23 chromosomes.
Figure 3
Figure 3
Identification of optimal sepsis subtypes based on the expression of RMGs. (A) The CDF curves based on different subtype numbers (k=2, 3, 4, 5, 6, 7, 8, 9) are represented, and each curve is associated with a unique color. CDF, cumulative distribution function curves. (B) The CDF Delta area curve of all samples. (C) Consensus heatmaps show a relativeiy stable partitioning of the samples at k = 3. (D) PCA is performed on different groups, where blue represents cluster 1, red represents cluster 2, and yellow represents cluster 3. PCA, principal component analysis. (E) The expression of RMGs among subtypes. *P < 0.05, **P < 0.01, ***P < 0.001. (F) The heatmap of the expression of RMGs between the C1, C2 and C3 groups.
Figure 4
Figure 4
Immune cell infiltration and biological characteristics of three clusters. (A) Differences in infiltrating immune cells between the C1, C2 and C3 clusters. The upper and lower ends of the boxes indicate the interquartile range of values, with the lines in the boxes representing the median value and the dots indicating outliers. *P < 0.05; **P < 0.01; ***P < 0.001. (B–D) GSVA analysis conducted on different subtypes of sepsis. (B) Representative barplot showing the 11 relatively up-regulated and 10 down-regulated signaling pathways in C1 compared to C2 and C3. (C) Representative barplot showing the 11 relatively up-regulated and 10 down-regulated signaling pathways in C2 compared to C1 and C3. (D) Representative barplot showing the 11 relatively up-regulated and 10 down-regulated signaling pathways in C3 compared to C1 and C2.
Figure 5
Figure 5
Identification of the key module by WGCNA. (A, B) The analysis of network topology for various soft thresholding powers of WGCNA. (C) Clustering dendrogram of module eigengenes. The red line indicates the cut height (0.25). (D) Hierarchical clustering dendrograms of co-expressed genes in identified modules are shown. Both dynamic and merged modules were identified. (E) WGCNA in the three sepsis subtypes. The 18 modules were validated and are designated by the different colors. The heatmap displays the correlation between feature vectors of 18 modules and three subtypes. The correlation coefficient in each cell represented the correlation between the gene module and the clusters, which decreases in size from red to green. The corresponding P-value is also annotated.
Figure 6
Figure 6
GO and KEGG enrichment analysis of eigengenes from the key module in C1-C3. GO functional enrichment analysis of the intersecting genes with the top 10, including molecular functions(MF), biological processes (BP) and cellular components (CC) terms and KEGG pathways. The horizontal axis shows the number of genes and the vertical shows the GO and KEGG terms. The color depth of the barplots represents the p-value. (A, D) GO and KEGG enrichment analysis of genes from MEblack module in cluster 1. (B, E) GO and KEGG enrichment analysis of genes from the MEblue module in cluster 2. (C, F) GO and KEGG enrichment analysis of genes from the MEyellow module in cluster 3.
Figure 7
Figure 7
Construction and assessment of RF, GLM, SVM and XGB model. (A) Boxplots displaying the residuals of the sample, with the red dot indicating the root mean square of the residuals. (B) The feature importance of the variables in the RF, GLM, SVM and XGB model. (C) Cumulative residual distribution map of the sample. (D) ROC evaluation of the performance of the RF, GLM, SVM and XGB models. RF Random Forest, SVM Support Vector Machine, XGB eXtreme Gradient Boosting, GLM generalized linear models, ROC receiver operating characteristic.
Figure 8
Figure 8
The diagnostic efficacy of hub RMGs. (A–C) The diagnostic efficacy of the SVM model in the discovery cohorts. (A) GSE57065 datasets. (B) GSE65682 datasets. (C) GSE95233 datasets. (D–F) ROC curves show the sepsis diagnostic efficacy of NSUN7, FTO, NOP2, PUS1, PUS3 respectively. (D) GSE57065 datasets. (E) GSE65682 datasets. (F) GSE95233 datasets. (G) Nomogram to predict the occurrence of sepsis. (H) Decision curve analysis was applied to evaluate the clinical value of the nomogram model. The Y-axis represents the net benefit. The black line represents the hypothesis that no patients die. The X-axis represents the threshold probability, where the expected benefit of treatment equals the expected benefit of avoiding treatment. (I) Calibration curve indicates the predictive power of the nomogram model.
Figure 9
Figure 9
The correlation between hub RMGs and infiltrating immune cells in GEO datasets. *P < 0.01, **P < 0.001 and ***P < 0.0001.
Figure 10
Figure 10
The relative expressions and ROC of hub RMGs in patients. (A) The concentrations of NSUN7, NOP2, PUS1, PUS3 and FTO mRNA in PBMCs were measured by qRT-PCR from septic patients and healthy controls at day 1 after enrollment. **P < 0.01, ***P < 0.001, and ****P < 0.0001 vs. Healthy. (B) ROC curves of NSUN7, NOP2, PUS1, PUS3 and FTO for diagnostic at admission in healthy and septic patients. (C) ROC curves illustrating the diagnostic performance of the integrated hub RMGs, Lac and PCT in sepsis and septic shock patients. Model the combined of NSUN7, NOP2, PUS1, PUS3 and FTO. Lac Lactic acid. PCT procalcitonin.

Similar articles

Cited by

References

    1. Singer M, Deutschman CS, Seymour CW, Shankar-Hari M, Annane D, Bauer M, et al. . The third international consensus definitions for sepsis and septic shock (Sepsis-3). JAMA (2016) 315:801–10. doi: 10.1001/jama.2016.0287 - DOI - PMC - PubMed
    1. Liu V, Escobar GJ, Greene JD, Soule J, Whippy A, Angus DC, et al. . Hospital deaths in patients with sepsis from 2 independent cohorts. JAMA (2014) 312:90–2. doi: 10.1001/jama.2014.5804 - DOI - PubMed
    1. Ferrer R, Martin-Loeches I, Phillips G, Osborn TM, Townsend S, Dellinger RP, et al. . Empiric antibiotic treatment reduces mortality in severe sepsis and septic shock from the first hour: results from a guideline-based performance improvement program. Crit Care Med (2014) 42:1749–55. doi: 10.1097/ccm.0000000000000330 - DOI - PubMed
    1. Vincent JL. The clinical challenge of sepsis identification and monitoring. PloS Med (2016) 13:e1002022. doi: 10.1371/journal.pmed.1002022 - DOI - PMC - PubMed
    1. de Grooth HJ, Postema J, Loer SA, Parienti JJ, Oudemans-van Straaten HM, Girbes AR. Unexplained mortality differences between septic shock trials: a systematic analysis of population characteristics and control-group mortality rates. Intensive Care Med (2018) 44:311–22. doi: 10.1007/s00134-018-5134-8 - DOI - PMC - PubMed

Publication types