. 2023 Aug 23:14:1227024.
doi: 10.3389/fimmu.2023.1227024. eCollection 2023.

Microbiome dysbiosis occurred in hypertrophic scars is dominated by S. aureus colonization

Affiliations

Microbiome dysbiosis occurred in hypertrophic scars is dominated by S. aureus colonization

Jiarong Yu et al. Front Immunol. .

Abstract

Background: The mechanisms of hypertrophic scar formation and its tissue inflammation remain unknown.

Methods: We collected 33 hypertrophic scar (HS) and 36 normal skin (NS) tissues, and detected the tissue inflammation and bacteria using HE staining, Gram staining, and transmission electronic microscopy (TEM), in situ hybridization and immunohistochemistry for MCP-1, TNF-α, IL-6 and IL-8. In addition, the samples were assayed by 16S rRNA sequencing to investigate the microbiota diversity in HS, and the correlation between the microbiota and the indices of Vancouver Scar Scale(VSS)score.

Results: HE staining showed that a dramatically increased number of inflammatory cells accumulated in HS compared with NS, and an enhanced number of bacteria colonies was found in HS by Gram staining, even individual bacteria could be clearly observed by TEM. In situ hybridization demonstrated that the bacteria and inflammation cells co-localized in the HS tissues, and immunohistochemistry indicated the expression of MCP-1, TNF-α, IL-6, and IL-8 were significantly upregulated in HS than that in NS. In addition, there was a significantly different microbiota composition between HS and NS. At the phylum level, Firmicutes was significantly higher in HS than NS. At the genus level, S. aureus was the dominant species, which was significantly higher in HS than NS, and was strongly correlated with VSS indices.

Conclusion: Microbiome dysbiosis, dominated by S. aureus, occurred in HS formation, which is correlated with chronic inflammation and scar formation, targeting the microbiome dysbiosis is perhaps a supplementary way for future scar management.

Keywords: S. aureus; Vancouver Scar Score; hypertrophic scar; inflammation; microbiome dysbiosis.


Conflict of interest statement

The authors declare that the research was conducted in the absence of any commercial or financial relationships that could be construed as a potential conflict of interest.

Figures
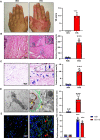
Figure 1
Figure 1
High bacterial content and inflammation in HS tissues. (A) Representative image of NS (left) and HS(right). HS appears red and has elevated shape compared to the NS. (B) H&E staining of tissue sections from NS and HS. Areas enclosed by the black box are magnified and shown in the top right corner. Scale bar: 20μm.The images are representative of three experiments with similar results. Data are shown as mean ± SD. ***P<0.001. (C) Gram staining of tissue sections from NS and HS. Scale bar: 20μm.The images are representative of three experiments with similar results. The area of gram positive staining was calculated by image J and shown as mean ± SD. ***P<0.001. (D) High-resolution transmission electron microscopy (HR-TEM) image of NS and HS tissue section. Macrophages (red line and green line) were engulfing bacteria(yellow arrow). A bacterium enclosed by the black box is magnified and shown in the top right corner. Scale bar: 500 nm. The number of bacteria was calculated by image J and shown as mean ± SD. ***P<0.001. (E) $ Representative immunofluorent double-staining of NS and HS tissue. Staining: CD11b (green), inflammatory cell marker; 16s (red), bacteria marker; DAPI (blue). Scale bar: 20μm. The images are representative of three experiments with similar results. The area of positive staining was calculated by image J and shown as mean ± SD. ***P<0.001.
Figure 2
Figure 2
α-diversity and β-diversity of bacterial community in HS and NS. (A) α-diversity comparison with Shannon index showed there was no difference between HS and NS (P=0.210) (B) β-diversity comparison with PCoA showed a clear separation between HS and NS (R=0.4970, P=0.001). (C) The pie chart showed the bacteria community composition at genus level in two groups.
Figure 3
Figure 3
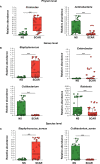
Different levels of microbiota abundance between HS and NS. (A) On Phylum level, the major difference of microbiota abundance between two groups. ***P<0.001 (B) On Genus level, the major difference of microbiota abundance between two groups. ***P<0.001 (C) On Species level, the major difference of microbiota abundance between two groups(the unclassified species were not listed). ***P<0.001.
Figure 4
Figure 4
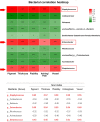
The correlation between microbiota and scar indices. *** indicates P<0.001, ** indicates P<0.01, * indicates P<0.05.

Similar articles

Cited by

References

    1. Ruppert DS, Mohammed MM, Ibrahim MM, Bachtiar EO, Erning K, Ansari K, et al. Poly(lactide-co-ϵ-caprolactone) scaffold promotes equivalent tissue integration and supports skin grafts compared to a predicate collagen scaffold. Wound Repair Regen (2021) 29(6):1035–50. doi: 10.1111/wrr.12951 - DOI - PubMed
    1. Zhang T, Wang XF, Wang ZC, Lou D, Fang QQ, Hu YY, et al. Current potential therapeutic strategies targeting the TGF-β/Smad signaling pathway to attenuate keloid and hypertrophic scar formation. BioMed Pharmacother (2020) 129:110287. doi: 10.1016/j.biopha.2020.110287 - DOI - PubMed
    1. Saulis AS, Mogford JH, Mustoe TA. Effect of Mederma on hypertrophic scarring in the rabbit ear model. Plast Reconstr Surg (2002) 110(1):177–83; discussion 184-6. doi: 10.1097/00006534-200207000-00029 - DOI - PubMed
    1. Singer AJ, McClain SA. Persistent wound infection delays epidermal maturation and increases scarring in thermal burns. Wound Repair Regen (2002) 10(6):372–7. doi: 10.1046/j.1524-475X.2002.10606.x - DOI - PubMed
    1. Zheng J, Song F, Lu SL, Wang XQ. Dynamic hypoxia in scar tissue during human hypertrophic scar progression. Dermatol Surg (2014) 40(5):511–8. doi: 10.1111/dsu.12474 - DOI - PubMed

Publication types