. 2023 Sep 6:16:3045-3060.
doi: 10.2147/JPR.S418458. eCollection 2023.

Bibliometric Analysis of Research Trends on Manual Therapy for Low Back Pain Over Past 2 Decades

Affiliations

Bibliometric Analysis of Research Trends on Manual Therapy for Low Back Pain Over Past 2 Decades

Lele Huang et al. J Pain Res. .

Abstract

Purpose: Low back pain (LBP) is a prevalent musculoskeletal disorder, and manual therapy (MT) is frequently employed as a non-pharmacological treatment for LBP. This study aims to explore the research hotspots and trends in MT for LBP. MT has gained widespread acceptance in clinical practice due to its proven safety and effectiveness. The study aims to analyze the developments in the field of MT for LBP over the past 23 years, including leading countries, institutions, authoritative authors, journals, keywords, and references. It endeavors to provide a comprehensive summary of the existing research foundation and to analyze the current cutting-edge research trends.

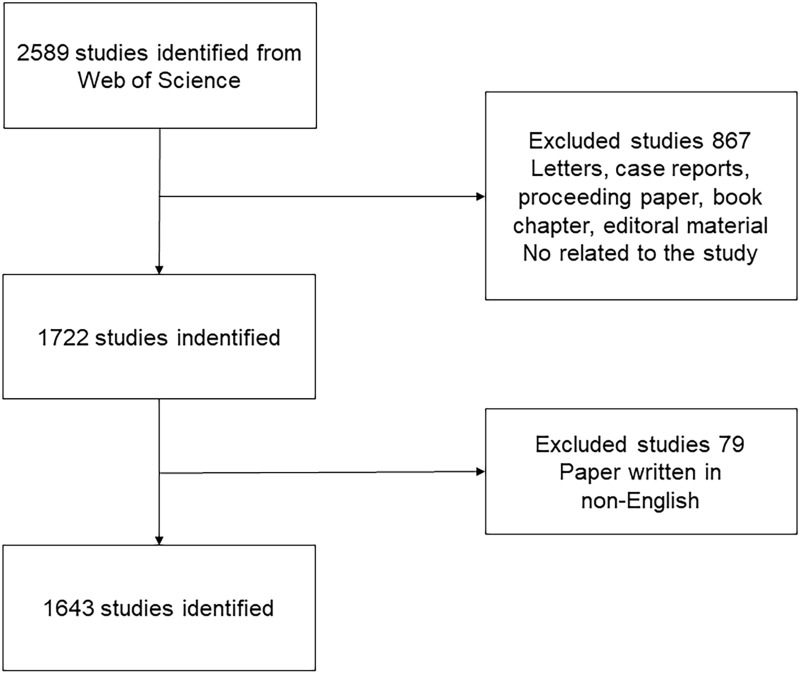
Methods: Relevant articles between 2000 and 2023 were retrieved from the Web of Science Core Collection (WOSCC) database. We used the software VOSviewer and CiteSpace to perform the analysis and summarize current research hotspots and emerging trends.

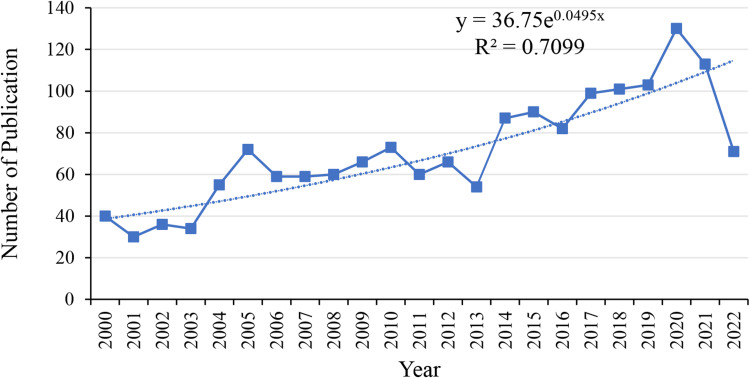
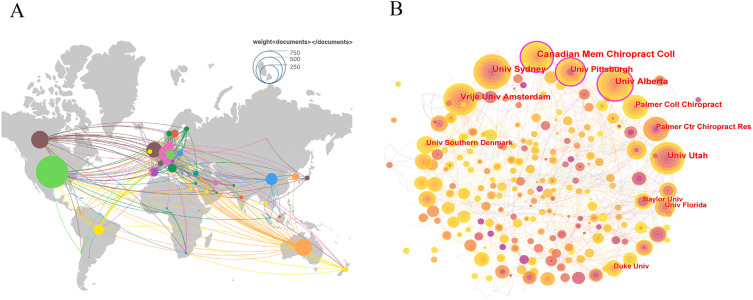
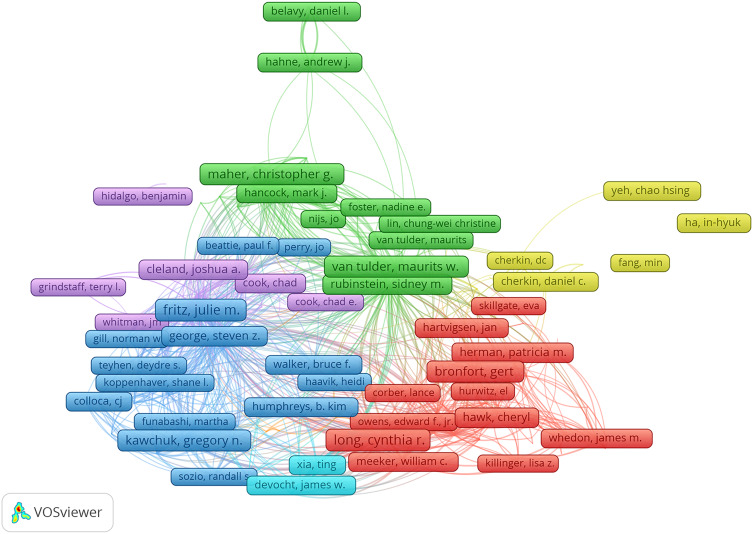
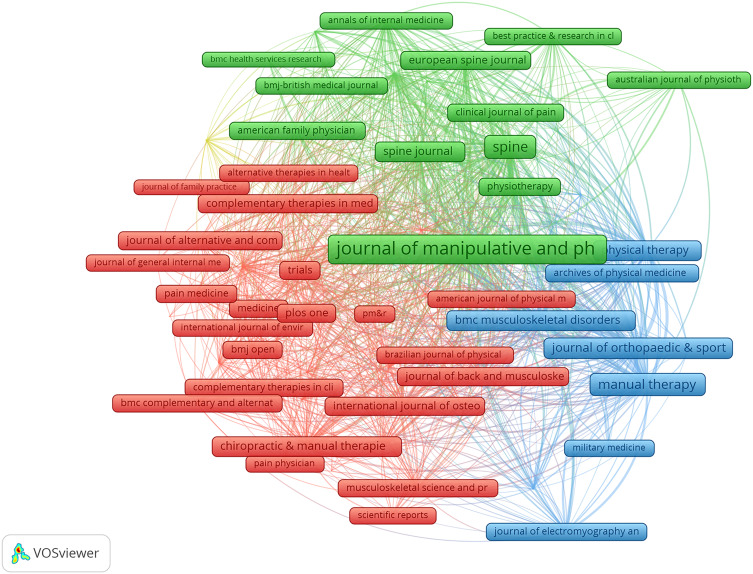
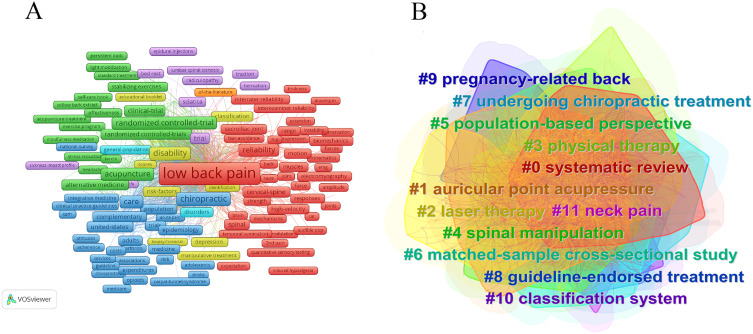
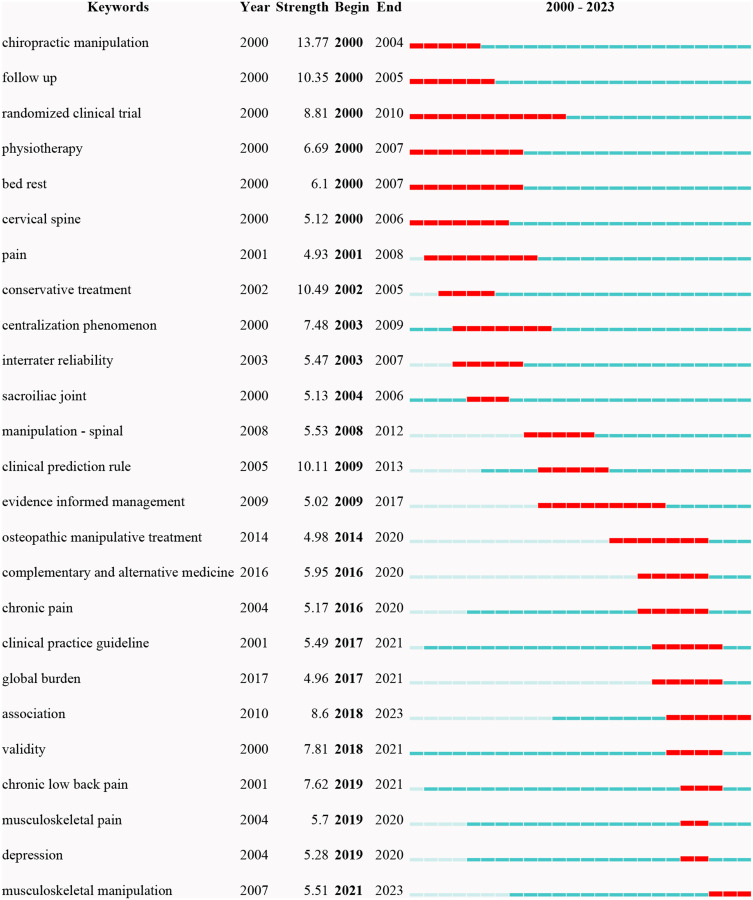
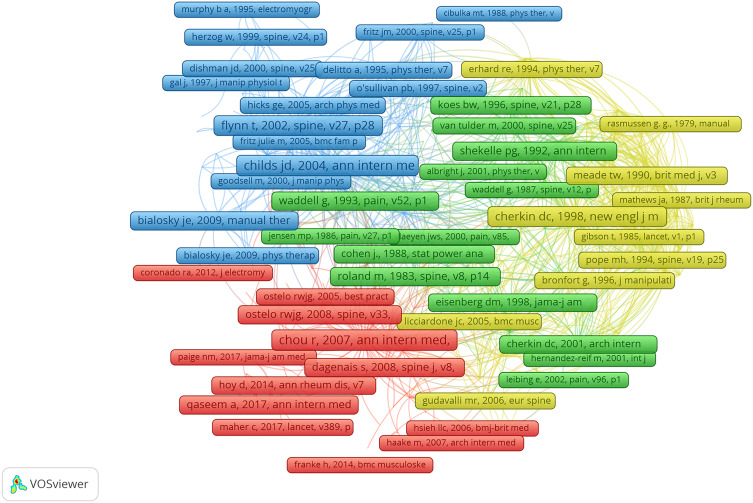
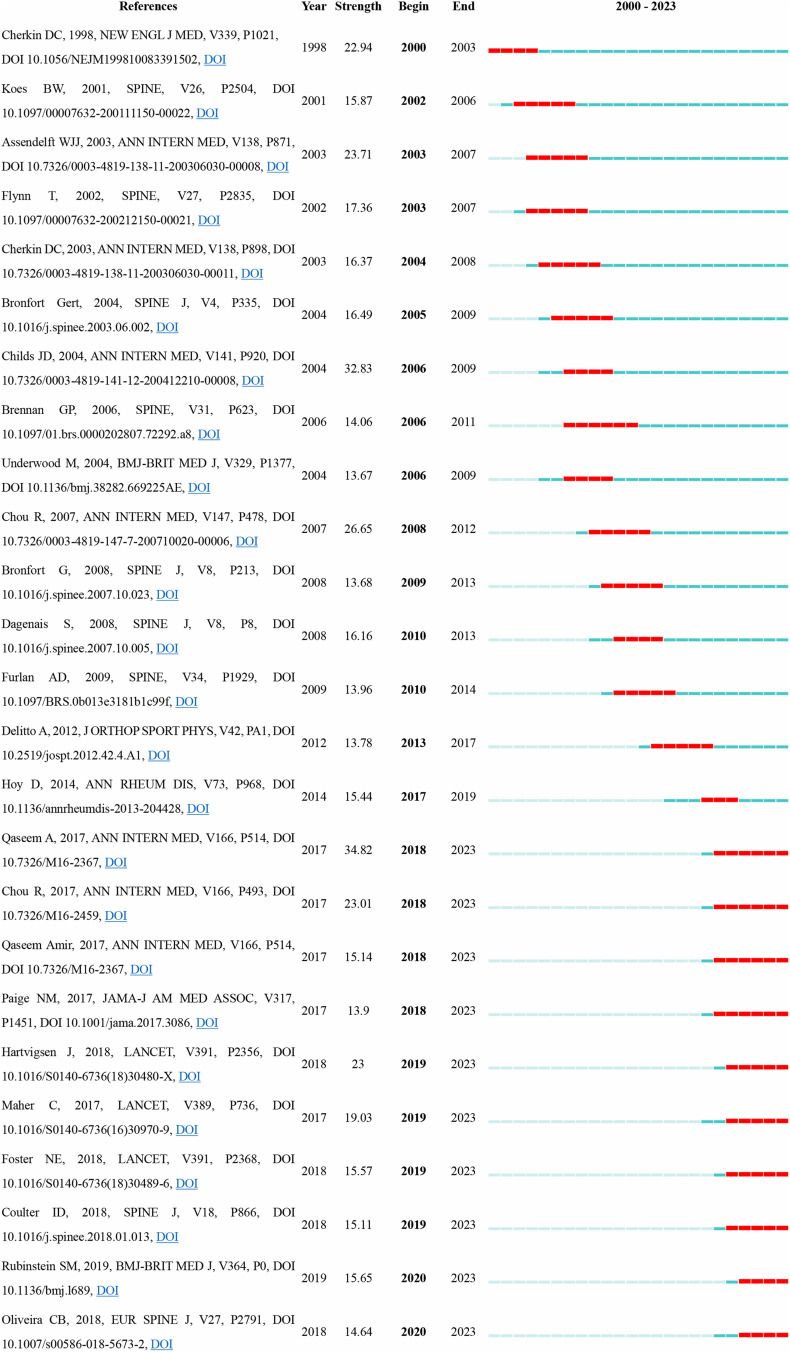
Results: Through screening, we included 1643 papers from 2000 to 2023. In general, the number of articles published each year showed an upward trend. The United States had the highest number of publications and citations. Canadian Memorial Chiropractic College was the most published research institution. The University of Pittsburgh in the United States had the most collaboration with other research institutions. Long, Cynthia R. was the active author. Journal of Manipulative and Physiological Therapeutics was the most prolific journal with 234 publications.

Conclusion: This study provides an overview of the current status and trends of clinical studies on MT for LBP in the past 23 years using the visualization software, which may help researchers identify potential collaborators and collaborating institutions, hot topics, and new perspectives in research frontiers, while providing new clinical practice ideas for the treatment of LBP.

Keywords: CiteSpace; VOSviewer; back pain; bibliometric analysis; manual therapy.


Conflict of interest statement

The authors report no conflicts of interest in this work.

Figures

Figure 1
Figure 1
Flow chart of this study.
Figure 2
Figure 2
Annual publication outputs and growth prediction from 2000 to 2022. The number of published documents increases exponentially, and conforms to the formula: y = 36.75e0.0495x, R2 is 0.7099, showing that the curve was well fitted.
Figure 3
Figure 3
The analysis of countries and institutions. (A) Cooperation map of countries in MT from 2000–2023. The circle represents the country, the higher the number of articles, the larger the circle; Connections represent cooperation and communication, and the more connections, the closer cooperation and communication. (B) Cooperation map of institutions from 2000–2023. The circle represents the research institution, and the higher the number of publications, the larger the circle. The connection represents the number of cooperation and exchanges between research units, and the more connections, the closer the cooperation and exchanges. The outermost purple circle represents centrality, and the higher the centrality, the more important the node.
Figure 4
Figure 4
Cooperation map of authors from 2000 to 2023. Nodes represent authors, and the size of nodes is proportional to the number of publications. The connections represent the number of cooperative exchanges between authors, and the more connections, the closer the cooperation and exchanges.
Figure 5
Figure 5
Bibliographic coupling analysis highly cited journals, weighted by citations, visualized map. Nodes represent journals, and the larger the node, the greater the number of citations.
Figure 6
Figure 6
The analysis of keywords. (A) Co-occurrence analysis of keywords by overlay visualization. Nodes represent keywords, and the larger the node, the more times it appears. (B) Cluster analysis of keywords. The # in the figure represents clustering, and the keyword clustering map is generated according to LLR method. There are 12 clusters in total.
Figure 7
Figure 7
Top 25 Keywords with the Strongest Citation Bursts. The left end of the red line represents the time when the keyword appears, and the right end represents the time when it ends.
Figure 8
Figure 8
A network diagram of co-cited references. Nodes in the figure represent references, and the larger the number of citations, the higher. Wired representatives are cited in the same literature.
Figure 9
Figure 9
Top 25 References with the Strongest Citation Bursts. The left end of the red line represents the time when the reference appears, and the right end represents the time when it ends.

Similar articles

Cited by

References

    1. Hartvigsen J, Hancock MJ, Kongsted A, et al. What low back pain is and why we need to pay attention. Lancet. 2018;391(10137):2356–2367. doi:10.1016/S0140-6736(18)30480-X - DOI - PubMed
    1. Knezevic NN, Candido KD, Vlaeyen JWS, et al. Low back pain. Lancet. 2021;398(10294):78–92. doi:10.1016/S0140-6736(21)00733-9 - DOI - PubMed
    1. Itz CJ, Geurts JW, van Kleef M, et al. Clinical course of non-specific low back pain: a systematic review of prospective cohort studies set in primary care. Eur J Pain. 2013;17(1):5–15. doi:10.1002/j.1532-2149.2012.00170.x - DOI - PubMed
    1. Hoy D, March L, Woolf A, et al. The global burden of neck pain: estimates from the global burden of disease 2010 study. Ann Rheum Dis. 2014;73(7):1309–1315. doi:10.1136/annrheumdis-2013-204431 - DOI - PubMed
    1. Mokdad AH, Ballestros K, Echko M, et al; Collaborators USBoD. The state of US health, 1990–2016: burden of diseases, injuries, and risk factors among US states. JAMA. 2018;319(14):1444–1472. doi:10.1001/jama.2018.0158 - DOI - PMC - PubMed