. 2023 Sep 6:10:1479-1495.
doi: 10.2147/JHC.S415318. eCollection 2023.

N6-Methyladenosine-Modified ATP8B1-AS1 Exerts Oncogenic Roles in Hepatocellular Carcinoma via Epigenetically Activating MYC

Affiliations

N6-Methyladenosine-Modified ATP8B1-AS1 Exerts Oncogenic Roles in Hepatocellular Carcinoma via Epigenetically Activating MYC

Chuan Tan et al. J Hepatocell Carcinoma. .

Abstract

Purpose: N6-methyladenosine (m6A) modification has shown critical roles in regulating mRNA fate. Non-coding RNAs also have important roles in various diseases, including hepatocellular carcinoma (HCC). However, the potential influences of m6A modification on non-coding RNAs are still unclear. In this study, we identified a novel m6A-modified ATP8B1-AS1 and aimed to investigate the effects of m6A on the expression and role of ATP8B1-AS1 in HCC.

Methods: qPCR was performed to measure the expression of related genes. The correlation between gene expression and prognosis was analyzed using public database. m6A modification level was measured using MeRIP and single-base elongation- and ligation-based qPCR amplification method. The roles of ATP8B1-AS1 in HCC were investigated using in vitro and in vivo functional assays. The mechanisms underlying the roles of ATP8B1-AS1 were investigated by ChIRP and ChIP assays.

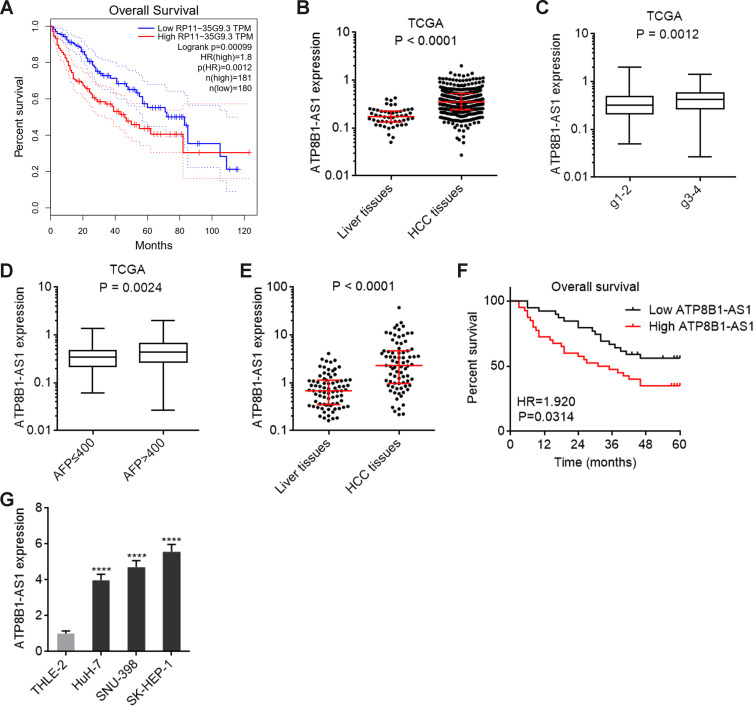
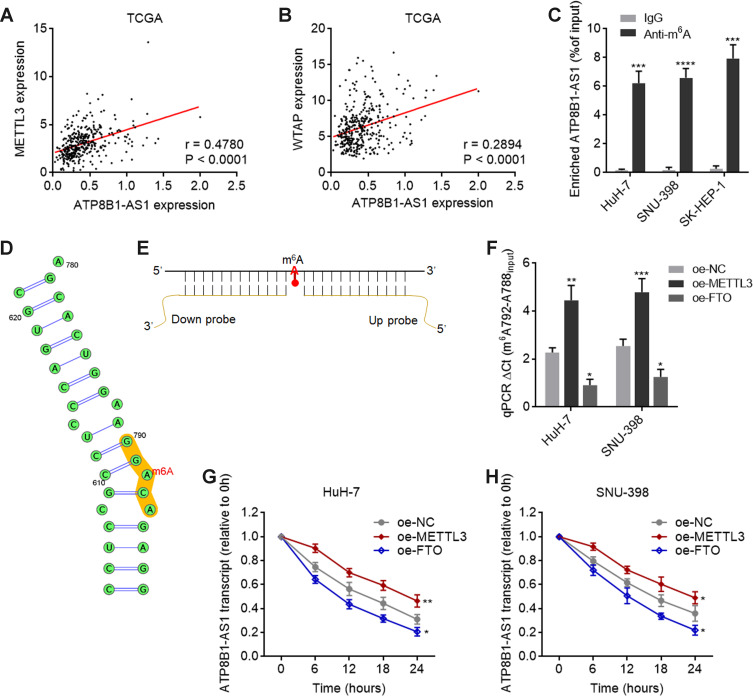
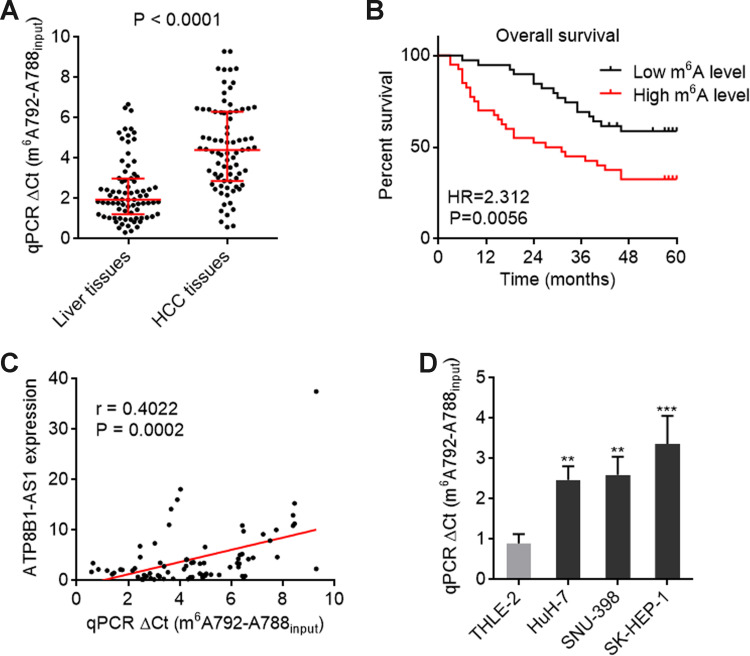
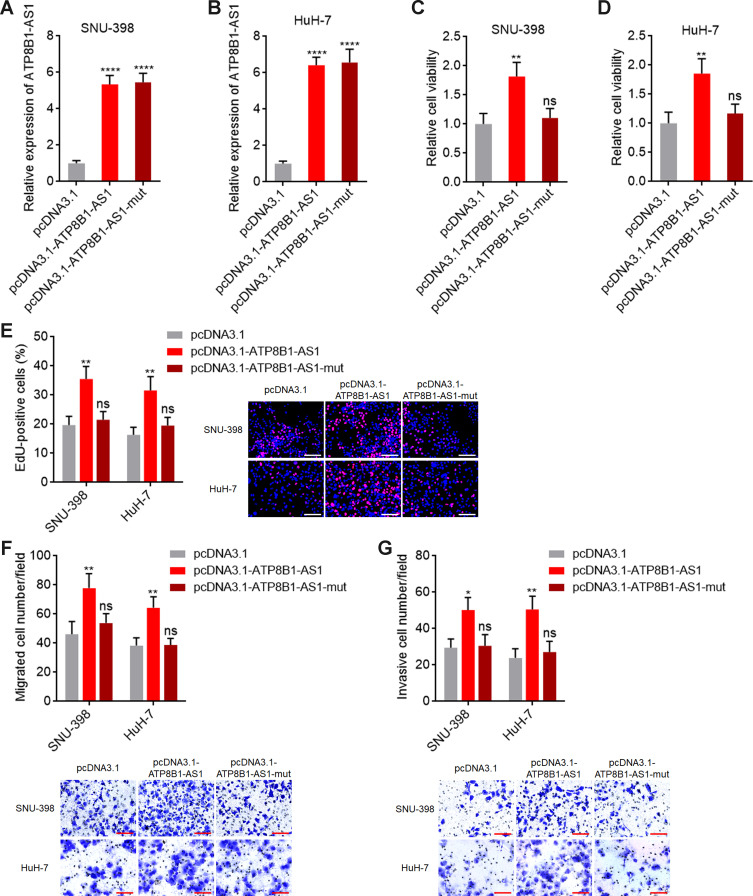
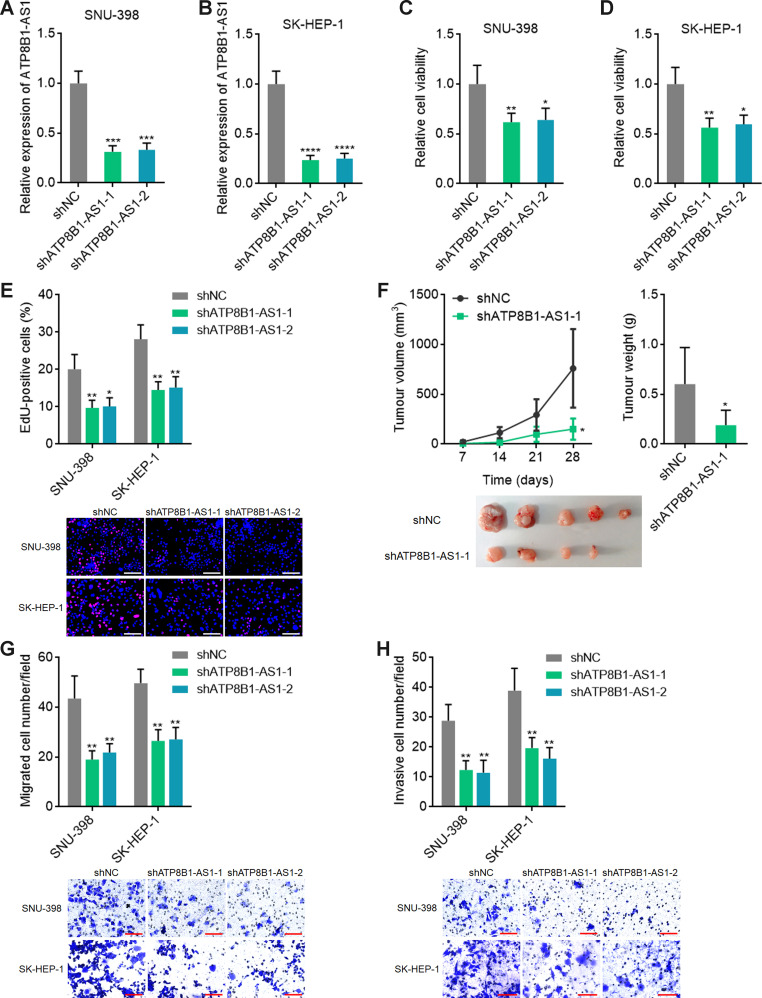
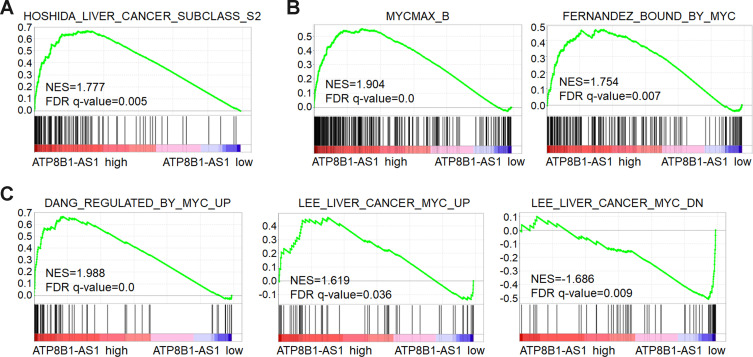
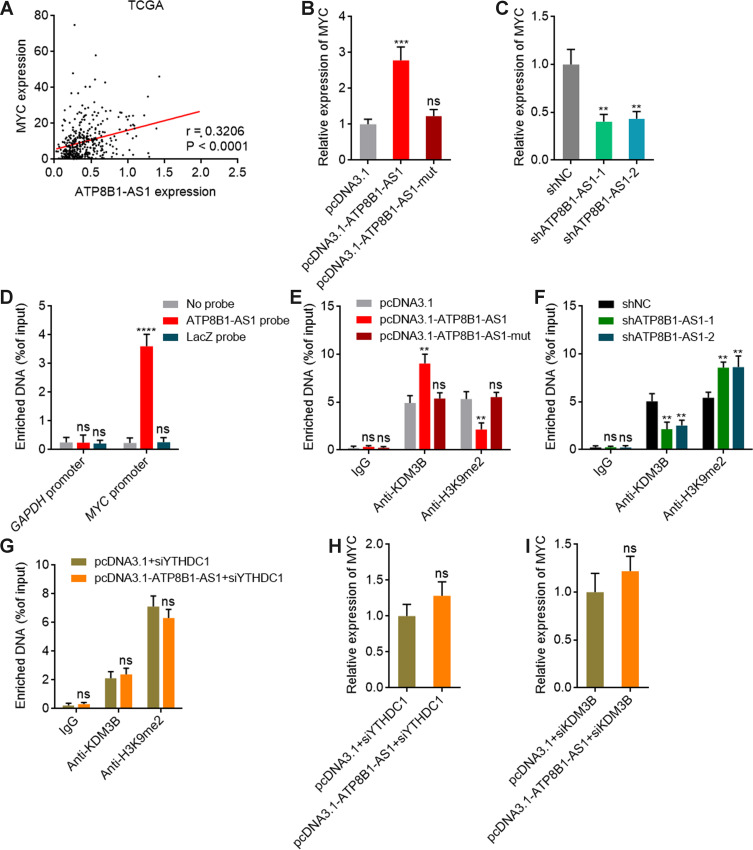
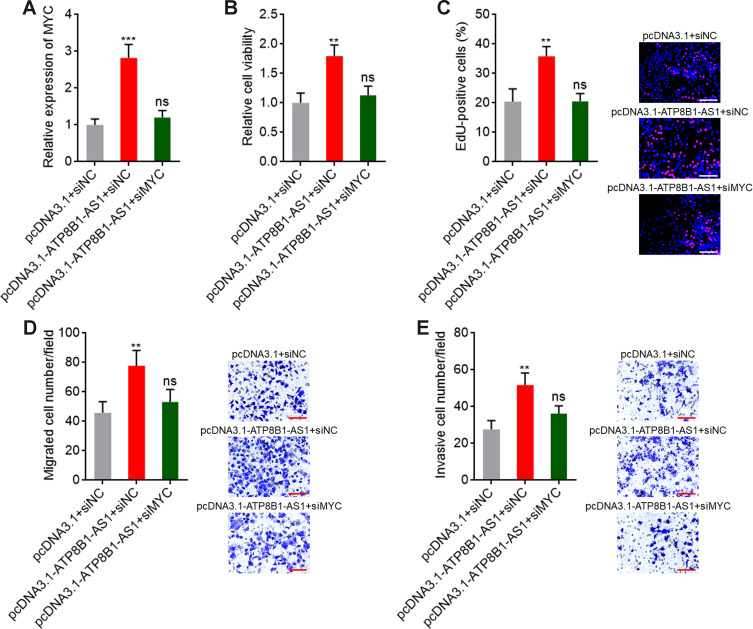
Results: ATP8B1-AS1 is highly expressed in HCC tissues and cell lines. High expression of ATP8B1-AS1 is correlated with poor overall survival of HCC patients. ATP8B1-AS1 is m6A modified and the 792 site of ATP8B1-AS1 is identified as an m6A modification site. m6A modification increases the stability of ATP8B1-AS1 transcript. m6A modification level of ATP8B1-AS1 is increased in HCC tissues and cell lines, and correlated with poor overall survival of HCC patients. ATP8B1-AS1 promotes HCC cell proliferation, migration, and invasion, which were abolished by the mutation of m6A-modified 792 site. Mechanistic investigation revealed that m6A-modified ATP8B1-AS1 interacts with and recruits m6A reader YTHDC1 and histone demethylase KDM3B to MYC promoter region, leading to the reduction of H3K9me2 level at MYC promoter region and activation of MYC transcription. Functional rescue assays showed that depletion of MYC largely abolished the oncogenic roles of ATP8B1-AS1.

Conclusion: m6A modification level of ATP8B1-AS1 is increased and correlated with poor prognosis in HCC. m6A-modified ATP8B1-AS1 exerts oncogenic roles in HCC via epigenetically activating MYC expression.

Keywords: MYC signaling; N6-methyladenosine; hepatocellular carcinoma; histone methylation; noncoding RNA.


Conflict of interest statement

The authors report no conflicts of interest in this work.

Figures

Figure 1
Figure 1
ATP8B1-AS1 is upregulated and correlated with poor overall survival in HCC. (A) The correlation between ATP8B1-AS1 (RP11-35G9.3) expression and overall survival in HCC based on TCGA-LIHC RNA-seq data, analyzed by GEPIA. (B) ATP8B1-AS1 expression in HCC tissues (n = 371) and normal liver tissues (n = 50), based on TCGA-LIHC RNA-seq data. (C) ATP8B1-AS1 expression in HCC tissues with grade 1–2 (n = 232) or grade 3–4 (n = 134), based on TCGA-LIHC RNA-seq data. (D) ATP8B1-AS1 expression in HCC tissues with AFP level ≤ 400 (n = 213) or > 400 (n = 65), based on TCGA-LIHC RNA-seq data. For (BD), P values were calculated by Mann–Whitney test. (E) ATP8B1-AS1 expression in 79 pairs of HCC tissues and matched adjacent liver tissues was measured by qPCR. P values were calculated by Wilcoxon matched-pairs signed rank test. (F) Kaplan-Meier survival curve of our HCC cohort stratified by ATP8B1-AS1 expression level. Median ATP8B1-AS1 expression level was used as cut-off. n = 79, HR = 1.920, P = 0.0314 by Log rank test. (G) ATP8B1-AS1 expression in immortalized liver cell line THLE-2 and HCC cell lines HuH-7, SNU-398, and SK-HEP-1 was detected by qPCR. Results are presented as mean ± SD based on three independent experiments. ****P < 0.0001 by one-way ANOVA followed by Dunnett’s multiple comparisons test.
Figure 2
Figure 2
m6A modification increases the stability of ATP8B1-AS1 transcript. (A) The correlation between ATP8B1-AS1 expression and METTL3 expression, based on TCGA-LIHC RNA-seq data. r = 0.4780, P < 0.0001 by Spearman correlation analysis. (B) The correlation between ATP8B1-AS1 expression and WTAP expression, based on TCGA-LIHC RNA-seq data. r = 0.2894, P < 0.0001 by Spearman correlation analysis. (C) MeRIP assays using m6A specific antibody, followed by qPCR to detect m6A-modified ATP8B1-AS1. (D) The m6A modification site of ATP8B1-AS1, predicted by SRAMP. (E) Schematic of SELECT to detect m6A modification level. (F) The m6A modification level of ATP8B1-AS1 in METTL3 or FTO overexpressed HuH-7 and SNU-398 cells was detected by SELECT. (G and H) The stability of ATP8B1-AS1 transcript over time in METTL3 or FTO overexpressed HuH-7 (G) and SNU-398 (H) cells was detected after blocking new RNA synthesis using α-amanitin (50 µM) and normalized to 18S rRNA (a product of RNA polymerase I that is unchanged by α-amanitin). For (C) and (FH), results are presented as mean ± SD based on three independent experiments. *P < 0.05, **P < 0.01, ***P < 0.001, ****P < 0.0001 by one-way ANOVA followed by Dunnett’s multiple comparisons test.
Figure 3
Figure 3
m6A modification level of ATP8B1-AS1 is upregulated and correlated with poor overall survival in HCC. (A) m6A modification level of ATP8B1-AS1 in 79 pairs of HCC tissues and matched adjacent liver tissues was detected by SELECT. P < 0.0001 by Wilcoxon matched-pairs signed rank test. (B) Kaplan-Meier survival curve of our HCC cohort stratified by m6A modification level of ATP8B1-AS1. Median m6A modification level of ATP8B1-AS1 was used as cut-off. n = 79, HR = 2.312, P = 0.0056 by Log rank test. (C) The correlation between m6A modification level of ATP8B1-AS1 and ATP8B1-AS1 expression level in HCC tissues, n = 79, r = 0.4022, P = 0.0002 by Spearman correlation analysis. (D) m6A modification level of ATP8B1-AS1 in immortalized liver cell line THLE-2 and HCC cell lines HuH-7, SNU-398, and SK-HEP-1 was detected by SELECT. Results are presented as mean ± SD based on three independent experiments. **P < 0.01, ***P < 0.001 by one-way ANOVA followed by Dunnett’s multiple comparisons test.
Figure 4
Figure 4
ATP8B1-AS1 exerts oncogenic roles in HCC in an m6A dependent manner. (A and B) ATP8B1-AS1 expression in SNU-398 (A) and HuH-7 (B) cells with wild-type or m6A-modified 792 site mutated ATP8B1-AS1 overexpression was measured by qPCR. (C and D) Cell proliferation of SNU-398 (C) and HuH-7 (D) cells with wild-type or mutated ATP8B1-AS1 overexpression was measured by Glo cell viability assay. (E) Cell proliferation of SNU-398 and HuH-7 cells with wild-type or mutated ATP8B1-AS1 overexpression was measured by EdU incorporation assays. Red color represents EdU-positive and proliferative cells. Scale bars = 100 µm. (F) Cell migration of SNU-398 and HuH-7 cells with wild-type or mutated ATP8B1-AS1 overexpression was measured by transwell migration assays. Scale bars = 100 µm. (G) Cell invasion of SNU-398 and HuH-7 cells with wild-type or mutated ATP8B1-AS1 overexpression was measured by transwell invasion assays. Scale bars = 100 µm. Results are presented as mean ± SD based on three independent experiments. *P < 0.05, **P < 0.01, ****P < 0.0001, by one-way ANOVA followed by Dunnett’s multiple comparisons test.
Figure 5
Figure 5
Depletion of ATP8B1-AS1 exerts tumor suppressive roles in HCC. (A and B) ATP8B1-AS1 expression in SNU-398 (A) and SK-HEP-1 (B) cells with ATP8B1-AS1 depletion was measured by qPCR. (C and D) Cell proliferation of SNU-398 (C) and SK-HEP-1 (D) cells with ATP8B1-AS1 depletion was measured by Glo cell viability assay. (E) Cell proliferation of SNU-398 and SK-HEP-1 cells with ATP8B1-AS1 depletion was measured by EdU incorporation assays. Red color represents EdU-positive and proliferative cells. Scale bars = 100 µm. (F) Tumor volume, weight, and photograph of subcutaneous tumors formed by SNU-398 cells with ATP8B1-AS1 depletion. (G) Cell migration of SNU-398 and SK-HEP-1 cells with ATP8B1-AS1 depletion was measured by transwell migration assays. Scale bars = 100 µm. (H) Cell invasion of SNU-398 and SK-HEP-1 cells with ATP8B1-AS1 depletion was measured by transwell invasion assays. Scale bars = 100 µm. Results are presented as mean ± SD based on three independent experiments (AE, G and H) or n=5 mice in each group (F). *P < 0.05, **P < 0.01, ***P < 0.001, ****P < 0.0001 by one-way ANOVA followed by Dunnett’s multiple comparisons test (AE, G and H) or Mann–Whitney test (F).
Figure 6
Figure 6
GSEA shows the correlation between ATP8B1-AS1 expression and MYC signaling activation. TCGA-LIHC samples were divided into ATP8B1-AS1 high expression and low expression group according to median ATP8B1-AS1 expression level. GSEA shows the positive correlation between ATP8B1-AS1 high expression and liver cancer subclass S2 gene signatures (A). MYC-bound genes were enriched in ATP8B1-AS1 high expression group (B). Genes upregulated by MYC were enriched in ATP8B1-AS1 high expression group, and genes downregulated by MYC were enriched in ATP8B1-AS1 low expression group (C).
Figure 7
Figure 7
ATP8B1-AS1 epigenetically activates MYC expression in an m6A dependent manner. (A) The correlation between ATP8B1-AS1 and MYC expression, based on TCGA-LIHC RNA-seq data. r = 0.3206, P < 0.0001 by Spearman correlation analysis. (B) MYC expression in SNU-398 cells with wild-type or m6A-modified 792 site mutated ATP8B1-AS1 overexpression was measured by qPCR. (C) MYC expression in SNU-398 cells with ATP8B1-AS1 depletion was measured by qPCR. (D) ChIRP assays with ATP8B1-AS1 antisense probes or control probes were conducted in SNU-398 cells to measure the binding of ATP8B1-AS1 to MYC promoter or GAPDH promoter. GAPDH promoter was used as negative control. (E) ChIP assays with KDM3B or H3K9me2 specific antibodies were conducted in SNU-398 cells with wild-type or m6A-modified 792 site mutated ATP8B1-AS1 overexpression to measure the binding of KDM3B to MYC promoter and H3K9me2 level at MYC promoter. (F) ChIP assays with KDM3B or H3K9me2 specific antibodies were conducted in SNU-398 cells with ATP8B1-AS1 depletion to measure the binding of KDM3B to MYC promoter and H3K9me2 level at MYC promoter. (G) ChIP assays with KDM3B or H3K9me2 specific antibodies were conducted in SNU-398 cells with wild-type ATP8B1-AS1 overexpression and YTHDC1 silencing to measure the binding of KDM3B to MYC promoter and H3K9me2 level at MYC promoter. (H) MYC expression in SNU-398 cells with wild-type ATP8B1-AS1 overexpression and YTHDC1 silencing was measured by qPCR. (I) MYC expression in SNU-398 cells with wild-type ATP8B1-AS1 overexpression and KDM3B silencing was measured by qPCR. Results are presented as mean ± SD based on three independent experiments. **P < 0.01, ***P < 0.001, ****P < 0.0001, by one-way ANOVA followed by Dunnett’s multiple comparisons test (BF) or two-tailed unpaired t-test (GI).
Figure 8
Figure 8
Depletion of MYC reverses the oncogenic roles of ATP8B1-AS1 in HCC. (A) MYC expression in SNU-398 cells with ATP8B1-AS1 overexpression and MYC silencing was measured by qPCR. (B) Cell proliferation of SNU-398 cells with ATP8B1-AS1 overexpression and MYC silencing was measured by Glo cell viability assay. (C) Cell proliferation of SNU-398 cells with ATP8B1-AS1 overexpression and MYC silencing was measured by EdU incorporation assays. Red color represents EdU-positive and proliferative cells. Scale bars = 100 µm. (D) Cell migration of SNU-398 cells with ATP8B1-AS1 overexpression and MYC silencing was measured by transwell migration assays. Scale bars = 100 µm. (E) Cell invasion of SNU-398 cells with ATP8B1-AS1 overexpression and MYC silencing was measured by transwell invasion assays. Scale bars = 100 µm. Results are presented as mean ± SD based on three independent experiments. **P < 0.01, ***P < 0.001, by one-way ANOVA followed by Dunnett’s multiple comparisons test.

Similar articles

Cited by

References

    1. Jemal A, Ward EM, Johnson CJ, et al. Annual report to the nation on the status of cancer, 1975–2014, featuring survival. J Natl Cancer Inst. 2017;109. doi:10.1093/jnci/djx030 - DOI - PMC - PubMed
    1. Sung H, Ferlay J, Siegel RL, et al. Global cancer statistics 2020: GLOBOCAN estimates of incidence and mortality worldwide for 36 cancers in 185 countries. CA Cancer J Clin. 2021;71:209–249. doi:10.3322/caac.21660 - DOI - PubMed
    1. Llovet JM, Kelley RK, Villanueva A, et al. Hepatocellular carcinoma. Nat Rev Dis Primers. 2021;7:6. doi:10.1038/s41572-020-00240-3 - DOI - PubMed
    1. Villanueva A. Hepatocellular Carcinoma. N Engl J Med. 2019;380:1450–1462. doi:10.1056/NEJMra1713263 - DOI - PubMed
    1. Baretti M, Kim AK, Anders RA. Expanding the immunotherapy roadmap for hepatocellular carcinoma. Cancer Cell. 2022;40:252–254. doi:10.1016/j.ccell.2022.02.017 - DOI - PMC - PubMed