. 2023 Aug 25;26(10):107712.
doi: 10.1016/j.isci.2023.107712. eCollection 2023 Oct 20.

A single-cell landscape of pre- and post-menopausal high-grade serous ovarian cancer ascites

Affiliations

A single-cell landscape of pre- and post-menopausal high-grade serous ovarian cancer ascites

Wenying Chen et al. iScience. .

Abstract

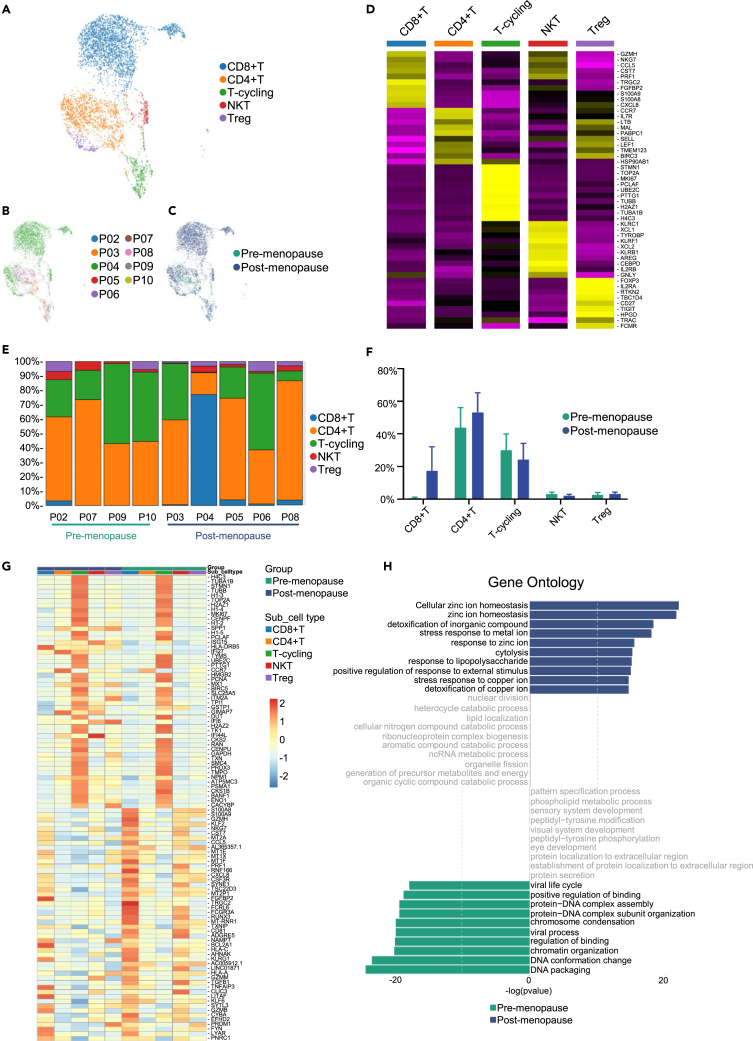
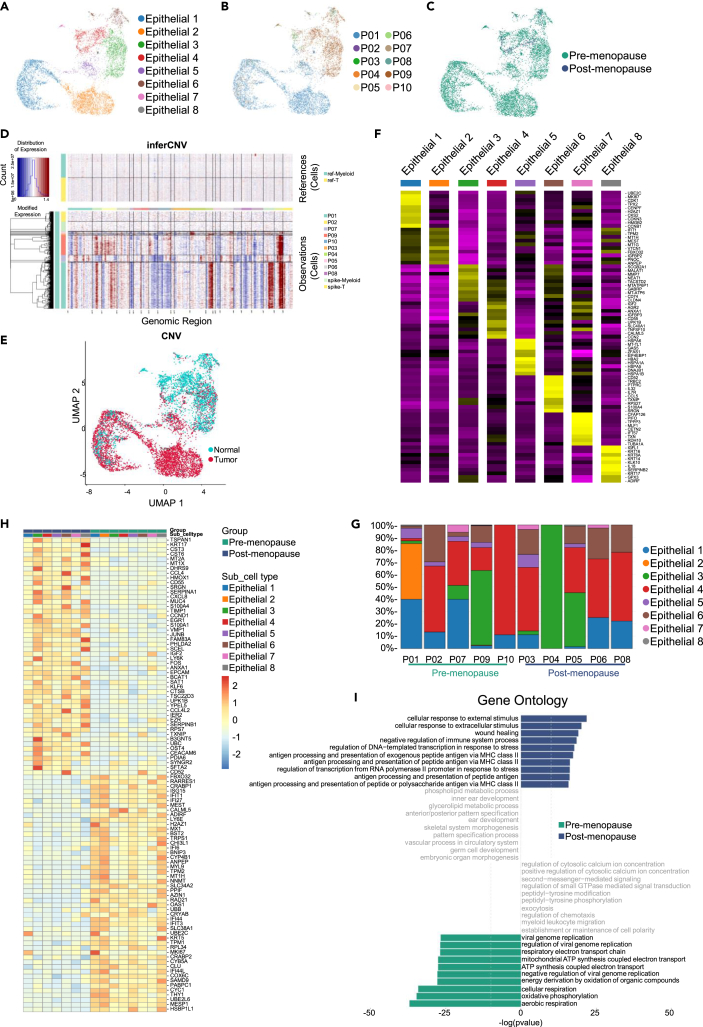
High-grade serous ovarian cancer (HGSOC) is a hormone-related cancer with high mortality and poor prognosis. Based on the transcriptome of 57,444 cells in ascites from 10 patients with HGSOC (including 5 pre-menopausal and 5 post-menopausal patients), we identified 14 cell clusters which were further classified into 6 cell types, including T cells, B cells, NK cells, myeloid cells, epithelial cells, and stromal cells. We discovered an increased proportion of epithelial cells and a decreased proportion of T cells in pre-menopausal ascites compared with post-menopausal ascites. GO analysis revealed the pre-menopausal tumor microenvironments (TME) are closely associated with viral infection, while the post-menopausal TME are mostly related to the IL-17 immune pathway. SPP1/CD44-mediated crosstalk between myeloid cells and B cells, NK cells, and stromal cells mainly present in the pre-menopausal group, while SPP1/PTGER4 -mediated crosstalk between myeloid cells and epithelial cells mostly present in the post-menopausal group.

Keywords: Cancer; Microenvironment.


Conflict of interest statement

The authors declare that they have no competing interests.

Figures

None
Graphical abstract
Figure 1
Figure 1
ScRNA-seq profiling of the pre- and post-menopausal HGSOC ascites environments (A) Overall survival (OS) of ovarian serous adenocarcinoma between pre- and post-menopausal (50-year-old cutoff value) in the cBioPortal database, and Schematic representation of the experimental strategy. (B) Uniform Manifold Approximation and Projection (UMAP) plot, showing the annotation and color codes for cell types in the HGSOC ecosystem. and 6 cell types and 14 clusters are shown in (B). (C) UMAP plot showing patient origins by color. (D) UMAP plot showing pre- and post-menopause origins by color. (E) Violin plot showing specific gene expression in various cell types. (F) Heatmap showing the expression of marker genes in the indicated cell types. (G) Histogram indicating the proportion of cells in ascites of each analyzed patient. (H) Histogram showing the fraction of cells in pre-menopausal (green) and post-menopausal (blue) ascites. Data are represented as mean ± SEM.
Figure 2
Figure 2
Myeloid-derived cell components in pre- and post-menopausal HGSOC ascites (A) UMAP plot showing the subtypes of myeloid-derived cells derived from HGSOC ascites. Each cluster is color-coded according to cell type. Cluster annotations are indicated in the figure. (B) UMAP plot showing HGSOC ascites myeloid cells, clustered and color-coded, according to patient. Data are represented as mean ± SEM. (C) UMAP plot, showing pre- and post-menopausal myeloid cells by color. (D) Heatmap showing the expression of marker genes in each subtype of myeloid-derived cells. (E) Histogram indicating the proportion of myeloid subgroups in ascites of pre- and post-menopausal patients. (F and G) Representative images of IF staining in Formalin-fixed paraffin-embedded (FFPE) ascites cells, indicating CD68+ and CD163+ cells (F), and SPP1+ CD163+ cells (G) in paired pre- and post-menopausal ascites. Scale bar, 10 μm. Bar chart based on IF staining results shows the relative fluorescence intensity of CD163, CD68, and SPP1 in cells. Data are represented as mean ± SEM. All statistical analyses were conducted using paired t-test. n represents the number of cells. (H) Gene ontology (GO) analysis of pre- (green) and post-menopausal (blue) myeloid cells. (I) The heatmap indicating the gene expression in the myeloid cell subtypes of pre- and post-menopausal HGSOC ascites.
Figure 3
Figure 3
T cells in pre- and post-menopausal HGSOC ascites (A) UMAP plot showing the subtypes of T cells derived from HGSOC ascites. Each cluster is color-coded according to cell type. Cluster annotations are indicated in the figure. (B) UMAP plot showing HGSOC ascites T cells, clustered and color-coded, according to patient. (C) UMAP plot, showing pre- and post-menopausal T cells by color. (D) Heatmap showing the expression of marker genes in each subtype of T cells. (E) Histogram indicating the proportion of T cell subgroups in ascites of each analyzed patient. (F) Histogram of the proportion of T cell subgroups in pre- and post-menopausal HGSOC ascites. Data are represented as mean ± SEM. (G) The heatmap indicating the gene expression in the T cell subtypes of pre- and post-menopausal HGSOC ascites. (H) Gene ontology (GO) analysis of pre- (green) and post-menopausal (blue) T cells.
Figure 4
Figure 4
B cells and NK cells in pre- and post-menopausal HGSOC ascites (A) UMAP plot showing the subtypes of B cells derived from HGSOC ascites. Each cluster is color-coded according to cell type. Cluster annotations are indicated in the figure. (B) UMAP plot, showing pre- and post-menopausal B cells by color. (C) Histogram indicating the proportion of B cell subgroups in ascites of each analyzed patient. (D) Gene ontology (GO) analysis of pre- (green) and post-menopausal (blue) B cells. (E) Heatmap showing the expression of marker genes in each subtype of B cells. (F) UMAP plot showing the subtypes of NK cells derived from HGSOC ascites. Each cluster is color-coded according to cell type. Cluster annotations are indicated in the figure. (G) UMAP plot, showing pre- and post-menopausal NK cells by color. (H) Histogram indicating the proportion of NK cell subgroups in ascites of each analyzed patient. (I) Heatmap showing the expression of marker genes in each subtype of NK cells. (J) Gene ontology (GO) analysis of pre- (green) and post-menopausal (blue) NK cells.
Figure 5
Figure 5
Epithelial cells in pre- and post-menopausal HGSOC ascites (A) UMAP plot showing the subtypes of epithelial cells derived from HGSOC ascites. Each cluster is color-coded according to cell type. Cluster annotations are indicated in the figure. (B) UMAP plot showing HGSOC ascites epithelial cells, clustered and color-coded, according to patient. (C) UMAP plot, showing pre- and post-menopausal epithelial cells by color. (D) The expression value of normal cells is drawn in the top heatmap, and that of ascites cells is drawn in the bottom heatmap. Genes are arranged from left to right on the whole chromosome. The expansion of the chromosome region is shown as red block, while the deletion of the chromosome region is shown as blue block. (E) InferCNV score shows in UMAP plot and define 0.5 as cutoff judgment, define Normal (blue) and Tumor (red) groups in UMAP plot. (F) Heatmap showing the expression of marker genes in each subtype of epithelial cells. (G) Histogram indicating the proportion of epithelial cell subgroups in ascites of each analyzed patient. (H) The heatmap indicating the gene expression in the epithelial cell subtypes of pre- and post-menopausal HGSOC ascites. (I) Gene ontology (GO) analysis of pre- (green) and post-menopausal (blue) epithelial cells.
Figure 6
Figure 6
Stromal cells in pre- and post-menopausal HGSOC ascites (A) UMAP plot showing the subtypes of stromal cells derived from HGSOC ascites. Each cluster is color-coded according to cell type. Cluster annotations are indicated in the figure. (B) UMAP plot showing HGSOC ascites stromal cells, clustered and color-coded, according to patient. (C) UMAP plot, showing pre- and post-menopausal stromal cells by color. (D) Heatmap showing the expression of marker genes in each subtype of stromal cells. (E) Histogram indicating the proportion of stromal cell subgroups in pre- and post-menopausal HGSOC ascites. Data are represented as mean ± SEM. (F) Gene ontology (GO) analysis of pre- (green) and post-menopausal (blue) stromal cells. (G) The heatmap indicating the gene expression in the stromal cell subtypes of pre- and post-menopausal HGSOC ascites.
Figure 7
Figure 7
Intercellular communication in pre- and post-menopausal HGSOC ascites (A–C) The number of acceptor ligand pairs for intercellular communication in pre- (A) and post-menopausal (B) HGSOC ascites cells, and shows the difference between the two groups (post-menopausal minus pre-menopausal) (C). (D) SPP1-related ligand pairs and their expression differences in pre- and post-menopausal HGSOC ascites. (E) Violin plot showing the average expression level of differentially expressed ligand genes in pre- and post-menopausal ascites cells. (F) TNM-plot analysis showing the expression levels of SPP1, PTGER4, ITGA4, ITGB1, and CD44 in ovarian cancer and normal patients. (G) KM-plot analysis showing the overall survival rate of patients in TCGA RNA-seq (left) and TCGA gene chip of stage Ⅲc-Ⅳ(right) database, characterized by either low (black) or high (red) expression of SPP1. Significance was calculated using the log rank test.

Similar articles

Cited by

References

    1. Siegel R.L., Miller K.D., Wagle N.S., Jemal A. Cancer statistics, 2023. CA A Cancer J. Clin. 2023;73:17–48. - PubMed
    1. Miller K.D., Nogueira L., Devasia T., Mariotto A.B., Yabroff K.R., Jemal A., Kramer J., Siegel R.L. Cancer treatment and survivorship statistics, 2022. CA A Cancer J. Clin. 2022;72:409–436. - PubMed
    1. Xia C., Dong X., Li H., Cao M., Sun D., He S., Yang F., Yan X., Zhang S., Li N., Chen W. Cancer statistics in China and United States, 2022: profiles, trends, and determinants. Chin. Med. J. 2022;135:584–590. - PMC - PubMed
    1. Lheureux S., Braunstein M., Oza A.M. Epithelial ovarian cancer: Evolution of management in the era of precision medicine. CA A Cancer J. Clin. 2019;69:280–304. - PubMed
    1. Sisodia R.C., Del Carmen M.G. Lesions of the Ovary and Fallopian Tube. N. Engl. J. Med. 2022;387:727–736. - PubMed