. 2023 Aug 25;26(10):107714.
doi: 10.1016/j.isci.2023.107714. eCollection 2023 Oct 20.

Enhanced cell viscosity: A new phenotype associated with lamin A/C alterations

Affiliations

Enhanced cell viscosity: A new phenotype associated with lamin A/C alterations

Cécile Jebane et al. iScience. .

Abstract

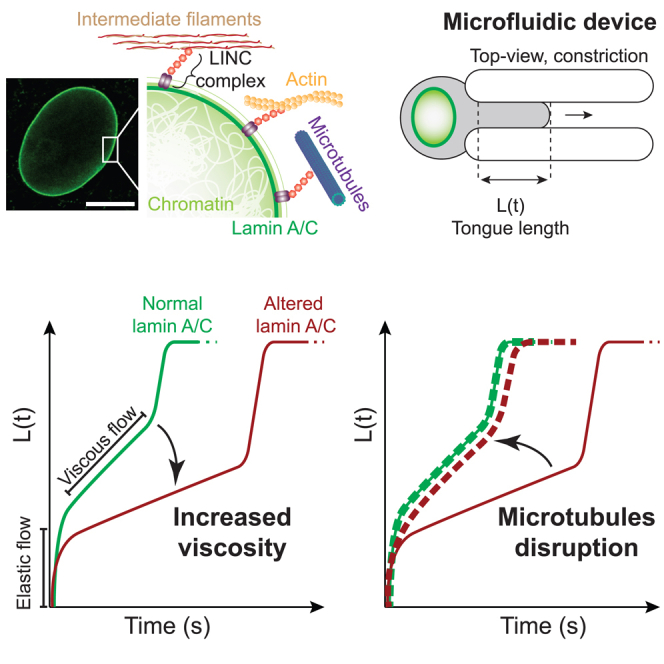
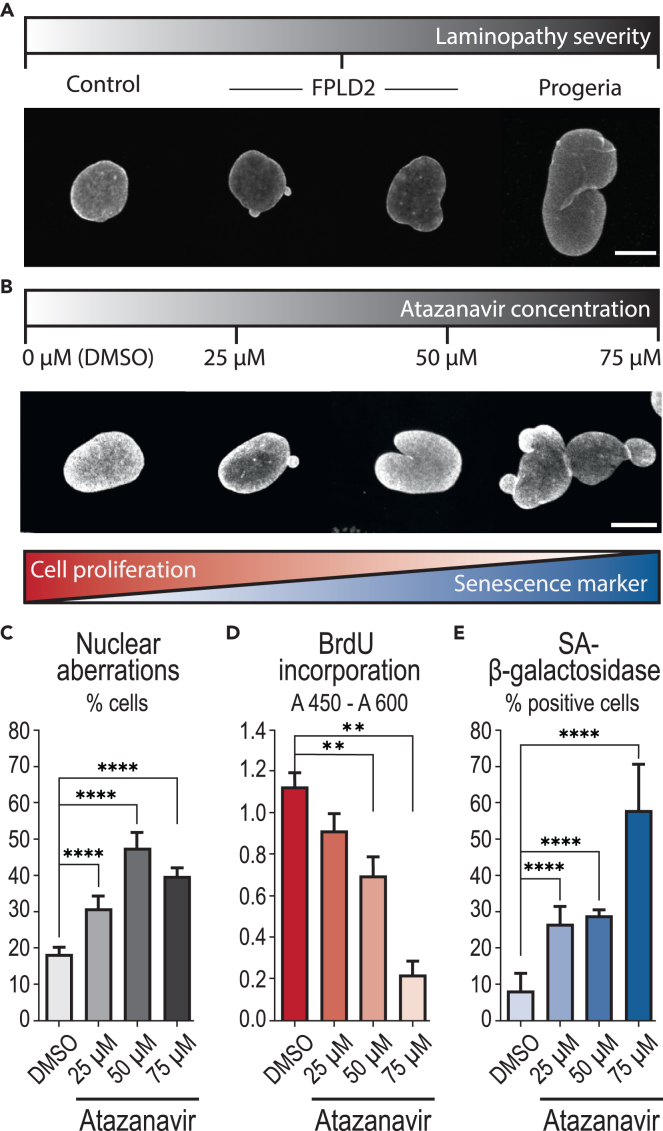
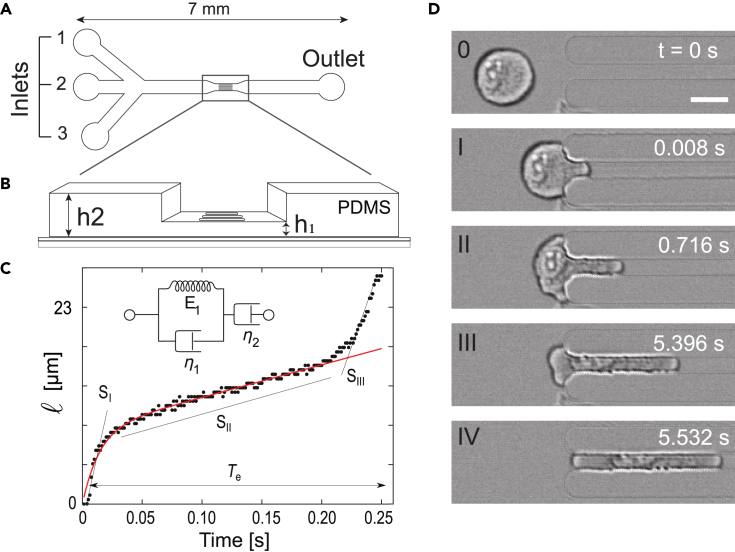
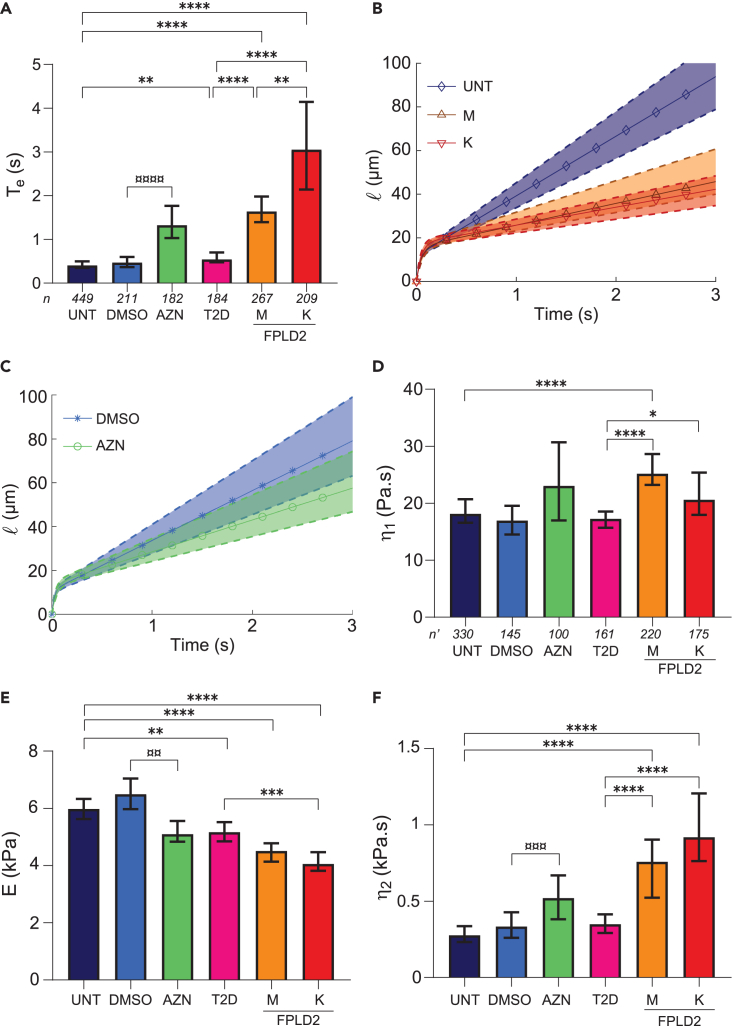
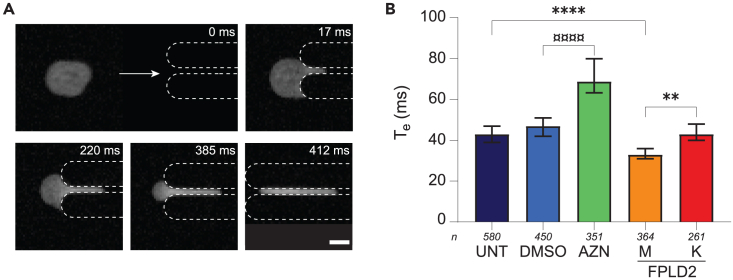
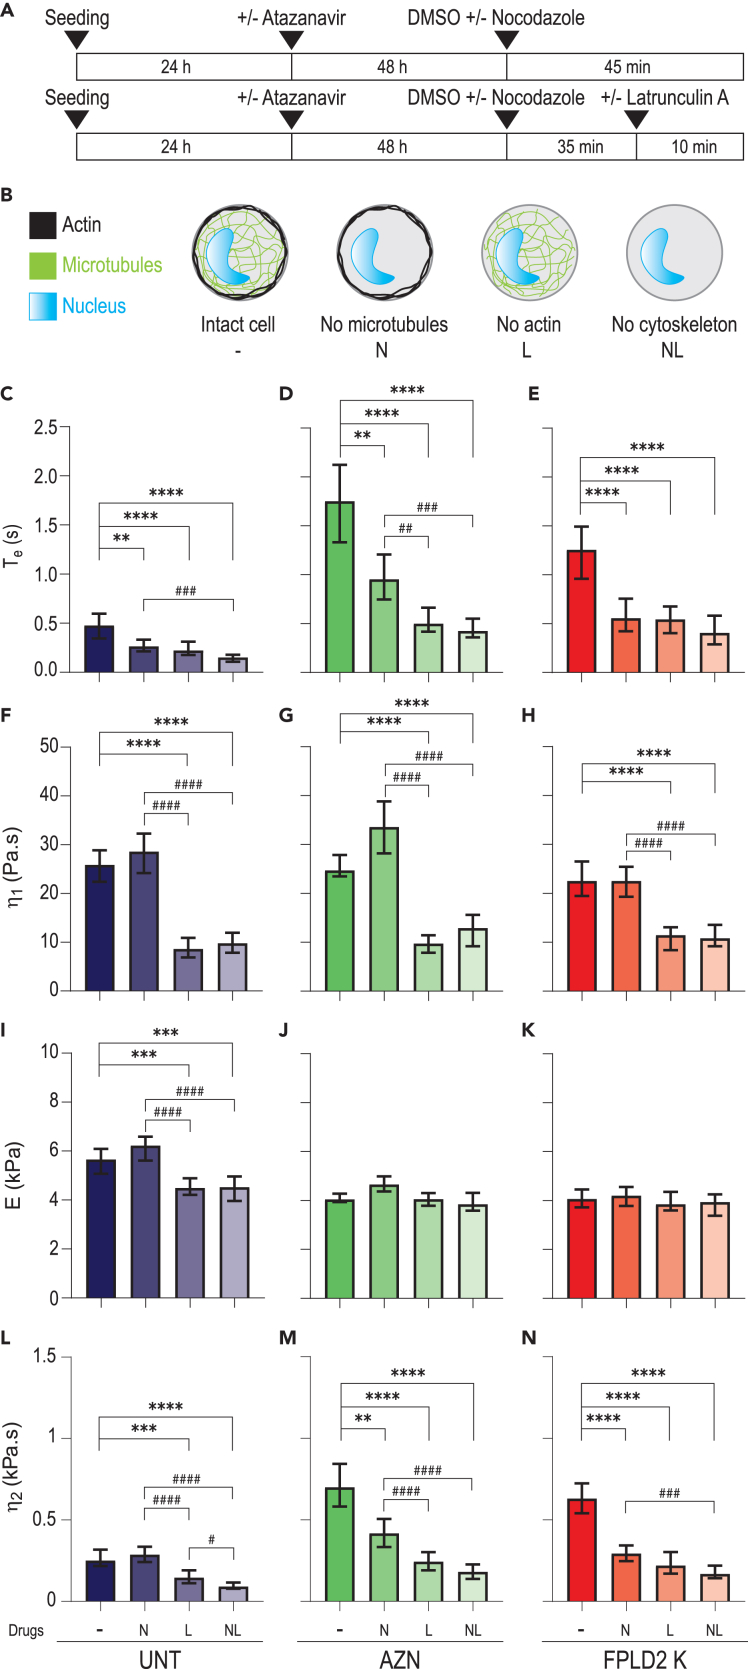
Lamin A/C is a well-established key contributor to nuclear stiffness and its role in nucleus mechanical properties has been extensively studied. However, its impact on whole-cell mechanics has been poorly addressed, particularly concerning measurable physical parameters. In this study, we combined microfluidic experiments with theoretical analyses to quantitatively estimate the whole-cell mechanical properties. This allowed us to characterize the mechanical changes induced in cells by lamin A/C alterations and prelamin A accumulation resulting from atazanavir treatment or lipodystrophy-associated LMNA R482W pathogenic variant. Our results reveal a distinctive increase in long-time viscosity as a signature of cells affected by lamin A/C alterations. Furthermore, they show that the whole-cell response to mechanical stress is driven not only by the nucleus but also by the nucleo-cytoskeleton links and the microtubule network. The enhanced cell viscosity assessed with our microfluidic assay could serve as a valuable diagnosis marker for lamin-related diseases.

Keywords: Biological sciences; Biotechnology; Cell biology.


Conflict of interest statement

The authors declare no competing financial interests.

Figures

None
Graphical abstract
Figure 1
Figure 1
Atazanavir treatment induces cellular phenotypes associated with premature senescence Control fibroblasts were treated for 48 h with increasing doses of atazanavir or incubated with DMSO as a control. (A and B) Representative images of nuclear aberrations (abnormal size or shape) observed in (A) control fibroblasts, fibroblasts from patients with FPLD2 carrying the LMNA R482W mutation, or from a patient with progeria, and (B) control fibroblasts treated with atazanavir. Nuclear envelope is stained using a lamin A/C-specific antibody. Scale bars: 10 μm. (C) Percentage of cells displaying nuclear aberrations. (D) Bromodeoxyuridine (BrdU) incorporation reporting cell proliferation ability. (E) Percentage of SA-beta-galactosidase-positive cells identified as senescent. Data in (C–E) are represented as mean ± SD (standard deviation). Number of experiments: N ≥ 3 (C–E); number of analyzed cells: n ≥ 1000 (C) and ≥500 (E).
Figure 2
Figure 2
Microfluidic device, data processing, and analysis (A) Top-view schematics of the microfluidic device made of polydimethylsiloxane (PDMS). Inlets (1) and (3) are used for injecting buffer solutions while cells are injected through inlet (2). Controlled pressure drop is applied between inlets and outlet to push cells through constrictions. (B) Zoomed 3D view of the constriction zone, with two different heights: h2 for the main 300-μm wide channel and h1 for the constrictions (length l, width w). l = 100 μm, w = h1 = 6 μm, h2 = 10 μm. The low-height region is 500 μm long in total, including the constrictions. (C) Typical time evolution of the cell tongue length l(t). The curve is analyzed using two methods: i) It is decomposed into three linear parts, of slopes SI to SIII, which correspond to the cell entry time Te; ii) The first two parts of the curve are fitted (in red) using a rheological model which combines a Kelvin–Voigt solid (a spring of constant E1 in parallel with a dashpot of viscosity η1) in series with a dashpot of viscosity η2 (see inset). (D) Time-lapse of a 24-μm cell entering a constriction of width w. Scale bar: 15 μm.
Figure 3
Figure 3
Atazanavir treatment and lamin A/C R482W mutation alter cell rheological behavior UNT: untreated control cells (control); DMSO: control cells incubated with DMSO (AZN control); AZN: control cells treated with atazanavir; T2D: cells from a patient with type 2 diabetes; M,K: cells from patients with FPLD2 carrying the LMNA R482W mutation. (A) Entry time in 6x6-μm2 constrictions Te (median ±95% CI, Confidence Interval). (B and C) Fits of tongue length l as a function of time t (t = 0 defined at cell contact with constriction), for (B) UNT, M and K cells, and (C) DMSO and AZN cells. Solid curves with symbols indicate the median fits; dashed upper and lower curves delineate the 95% CIs; the curves are plotted using median and CI values from Table 1 in Equation 1. (D–F) Fit-extracted rheological parameters: long-time viscosity η2 (D), short-time elastic modulus E (E), and viscosity η1 (F). Medians ±95% CI are displayed. Significant differences: AZN vs. DMSO cells (¤), FPLD2 and T2D vs. UNT cells (∗). Number of experiments: N ≥ 3; n: number of analyzed cells (A); n': number of fitted curves (D–F).
Figure 4
Figure 4
Nucleus response differs from whole-cell response (A) Time-lapse of a 20-μm nucleus entering (I–III) and transiting (IV) through a 3x3-μm2 constriction. Nucleus is labeled with Hoechst. Scale bar: 10 μm. (B) Entry time of isolated nuclei in constrictions Te (median ±95% CI). Nuclei from UNT: untreated control cells (control); DMSO: control cells incubated with DMSO; AZN: control cells treated with atazanavir; M,K: cells from patients with FPLD2. Significant differences: AZN vs. DMSO nuclei (¤), FPLD2 and T2D vs. UNT nuclei (∗). Number of experiments: N ≥ 4; n: number of analyzed isolated nuclei.
Figure 5
Figure 5
Actin and microtubule network destabilization accelerates cell entry into constrictions and decreases long-time viscosity in senescent cells (A) Timeline protocol for cytoskeletal drug treatments: 72 h after seeding, cells, treated or not with atazanavir, are treated with nocodazole (45 min), latrunculin A (10 min), or both (35 min with nocodazole, then 10 min with both drugs). (B) Sketched effect of drug treatments on cells, with nocodazole and/or latrunculin A leading to microtubule and/or actin destabilization. Control condition is incubation with drug solvent, DMSO. (C–N) (C–E) Entry time in constrictions Te and (F–N) fit-extracted rheological parameters of untreated control cells (UNT, dark blue), atazanavir-treated cells (AZN, green), and FPLD2 cells (FPLD2 K, red) upon drug treatments. Medians ±95% CIs are displayed. Significant differences: drug treatments vs. DMSO control (∗), and between drug treatments (#). Number of experiments: N ≥ 3; number of analyzed cells: n ≥ 100 (C–E); number of fitted curves: n' ≥ 60 (F–N).

Similar articles

Cited by

References

    1. Isermann P., Lammerding J. Nuclear mechanics and mechanotransduction in health and disease. Curr. Biol. 2013;23:R1113–R1121. doi: 10.1016/j.cub.2013.11.009. - DOI - PMC - PubMed
    1. Hah J., Kim D.H. Deciphering Nuclearmechanobiology in Laminopathy. Cells. 2019;8:231. doi: 10.3390/cells8030231. - DOI - PMC - PubMed
    1. Kalukula Y., Stephens A.D., Lammerding J., Gabriele S. Mechanics and functional consequences of nuclear deformations. Nat. Rev. Mol. Cell Biol. 2022;23:583–602. - PMC - PubMed
    1. Zuela-Sopilniak N., Lammerding J. Can’t handle the stress? Mechanobiology and disease. Trends Mol. Med. 2022;28:710–725. doi: 10.1016/j.molmed.2022.05.010. - DOI - PMC - PubMed
    1. Dechat T., Pfleghaar K., Sengupta K., Shimi T., Shumaker D.K., Solimando L., Goldman R.D. Nuclear lamins: Major factors in the structural organization and function of the nucleus and chromatin. Genes Dev. 2008;22:832–853. doi: 10.1101/gad.1652708. - DOI - PMC - PubMed

LinkOut - more resources