. 2023 Aug 28:14:1225486.
doi: 10.3389/fendo.2023.1225486. eCollection 2023.

The effect of forskolin and the role of Epac2A during activation, activity, and deactivation of beta cell networks

Affiliations

The effect of forskolin and the role of Epac2A during activation, activity, and deactivation of beta cell networks

Maša Skelin Klemen et al. Front Endocrinol (Lausanne). .

Abstract

Beta cells couple stimulation by glucose with insulin secretion and impairments in this coupling play a central role in diabetes mellitus. Cyclic adenosine monophosphate (cAMP) amplifies stimulus-secretion coupling via protein kinase A and guanine nucleotide exchange protein 2 (Epac2A). With the present research, we aimed to clarify the influence of cAMP-elevating diterpene forskolin on cytoplasmic calcium dynamics and intercellular network activity, which are two of the crucial elements of normal beta cell stimulus-secretion coupling, and the role of Epac2A under normal and stimulated conditions. To this end, we performed functional multicellular calcium imaging of beta cells in mouse pancreas tissue slices after stimulation with glucose and forskolin in wild-type and Epac2A knock-out mice. Forskolin evoked calcium signals in otherwise substimulatory glucose and beta cells from Epac2A knock-out mice displayed a faster activation. During the plateau phase, beta cells from Epac2A knock-out mice displayed a slightly higher active time in response to glucose compared with wild-type littermates, and stimulation with forskolin increased the active time via an increase in oscillation frequency and a decrease in oscillation duration in both Epac2A knock-out and wild-type mice. Functional network properties during stimulation with glucose did not differ in Epac2A knock-out mice, but the presence of Epac2A was crucial for the protective effect of stimulation with forskolin in preventing a decline in beta cell functional connectivity with time. Finally, stimulation with forskolin prolonged beta cell activity during deactivation, especially in Epac2A knock-out mice.

Keywords: Epac2A KO; amplifying pathway; beta cells; calcium imaging; forskolin; intercellular network; pancreas; tissue slices.


Conflict of interest statement

The authors declare that the research was conducted in the absence of any commercial or financial relationships that could be construed as a potential conflict of interest.

Figures

Figure 1
Figure 1
A typical beta cell response to glucose and forskolin. (A) 12 mM glucose induced a transient increase in [Ca2+]IC, followed by [Ca2+]IC oscillations during the plateau phase that ceased after stimulus withdrawal. Responses of 4 cells from the same WT islet are shown. Activation (Delay_A) and deactivation (Delay_D) delays were defined as indicated in the figure; (B) [Ca2+]IC activity after addition of 10 µM forskolin in 4 cells from the same WT islet. Rectangles indicate intervals used in subsequent analysis of the plateau phase, the results of which are shown in indicated figures. Note that the prolonged stimulation with glucose only (A) served as a control for possible time effects, since forskolin was added to glucose after a stable plateau was achieved in response to glucose (B); (C) Responses to 12 mM glucose of 4 cells from the same KO islet are shown; (D) [Ca2+]IC activity after addition of 10 µM forskolin in 4 cells from the same KO islet. The analysis methodology was the same as demonstrated in (A, B).
Figure 2
Figure 2
The effect of forskolin and the role of Epac2A during activation of beta cells from WT and KO mice. (A) The activation delays (Delay_A) after stimulation with either 6 mM glucose + 10 µM forskolin or 12 mM glucose in WT and Epac2A KO mice. Note that the 6 mM glucose failed to elicit a response in beta cells. 1st quartile/median/3rd quartile (Q1/M/Q3, in seconds): 151/693/868 (6 mM glucose + 10 µM forskolin in WTs), 144/243/659 (6 mM glucose + 10 µM forskolin in KOs), 127/168/243 (12 mM glucose in WTs), and 81/112/142 (12 mM glucose in KOs); (B) The any-cell-first-responder delays after stimulation with either 6 mM glucose + 10 µm forskolin or 12 mM glucose in WT and Epac2A KO mice. Q1/M/Q3 (in seconds): 126/278/533 (6 mM glucose + 10 µM forskolin in WTs), 70/178/518 (6 mM glucose + 10 µM forskolin in KOs), 17/35/58 (12 mM glucose in WTs), and 22/48/69 (12 mM glucose in KOs); (C) Relative any-cell-first-responder delays after stimulation with either 6 mM glucose + 10 µm forskolin or 12 mM glucose. Q1/M/Q3: 0.32/0.58/0.90 (6 mM glucose + 10 µM forskolin in WTs), 0.31/0.59/0.95 (6 mM glucose + 10 µM forskolin in KOs), 0.009/0.21/0.40 (12 mM glucose in WTs), and 0.24/0.47/0.69 (12 mM glucose in KO). Data pooled from the following number of cells/islets: 388/6 (6 mM glucose + 10 µM forskolin in WTs), 428/8 (6 mM glucose + 10 µM forskolin in KOs), 1373/24 (12 mM glucose in WTs), 1375/22 (12 mM glucose in KOs). Data were analyzed using Mann-Whitney U test, p values are indicated on graphs.
Figure 3
Figure 3
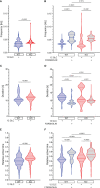
The effect of forskolin and the role of Epac2A during the plateau phase of response to glucose. (A) The oscillation frequency after stimulation with 12 mM glucose. 1st quartile/median/3rd quartile (Q1/M/Q3) in Hz: 0.025/0.033/0.042 (in WTs) and 0.036/0.039/0.044 (in KOs); (B) The oscillation frequency after either prolonged stimulation with 12 mM or addition of 10 µm forskolin. Q1/M/Q3 in Hz: 0.031/0.033/0.042 (12 mM glucose in WTs), 0.045/0.058/0.069 (12 mM glucose + 10 µM forskolin in WTs), 0.025/0.033/0.056 (12 mM glucose in KOs) and 0.047/0.056/0.064 (12 mM glucose + 10 µM forskolin in KOs); (C) The oscillation duration after stimulation with 12 mM glucose. Q1/M/Q3 in seconds: 9.7/10.7/13.4 (in WTs) and 10.4/11.7/12.7 (in KOs); (D) The oscillation duration after either prolonged stimulation with 12 mM or addition of 10 µm forskolin. Q1/M/Q3 in seconds: 10.8/12.1/13.3 (12 mM glucose in WTs), 7.9/8.5/9.9 (12 mM glucose + 10 µM forskolin in WTs), 9.2/10.9/18.5 (12 mM glucose in KOs), and 9.2/9.9/10.6 (12 mM glucose + 10 µM forskolin in KOs); (E) The relative active time after stimulation with 12 mM glucose. Q1/M/Q3: 0.33/0.41/0.48 (in WTs) and 0.42/0.46/0.51 (in KOs); (F) The relative active time after either prolonged stimulation with 12 mM or addition of 10 µm forskolin. Q1/M/Q3: 0.36/0.43/0.49 (12 mM glucose in WTs), 0.44/0.55/0.59 (12 mM glucose + 10 µM forskolin in WTs), 0.39/0.47/0.53 (12 mM glucose in KOs) and 0.49/0.55/0.62 (12 mM glucose + 10 µM forskolin in KOs). Data pooled from the following number of cells/islets: 687/11 (12 mM glucose in WTs), 656/11 (12 mM glucose + 10 µM forskolin in WTs), 548/7 (12 mM glucose in KOs), and 631/9 (12 mM glucose + 10 µM forskolin in KOs). Data were analyzed using Mann-Whitney U test (for 2 samples) or one-way ANOVA on ranks (Kruskal-Wallis test) followed by Dunn’s multiple comparisons test for more than 2 samples), p values are indicated on graphs.
Figure 4
Figure 4
The effect of forskolin on functional beta cell connectivity networks and the role of Epac2A. (A-D) Characteristic functional network representations of islets from WT and Epac2A KO mice stimulated either with 12 mM glucose or with 12 mM glucose + 10 µM forskolin. Nodes signify positions of beta cells within an islet, connections stand for functional associations in Ca2+ activity, and colors of cells denote different communities. In all four panels the left networks correspond to the first interval in the plateau phase, whilst the right networks represent connectivity patterns in the second interval of sustained activity [i.e., either prolonged glucose stimulation (A, C) or stimulation with glucose + forskolin (B, D)]; (E-K) Synchronization and network metrics for the average pooled data from all islets in the given group: average node degree (E), average correlation coefficient (F, G), modularity (H, I), relative largest component (J, K). In (F, H, J) the values in the first part of the plateau phase (glucose only) are shown, whereas in (E, G, I, K) the values corresponding to the second part (either glucose only or glucose+forskolin) are presented. Individual dots represent the average values in individual islets, whereas the horizontal lines denote the median value.
Figure 5
Figure 5
The effect of forskolin and the role of Epac2A during deactivation of beta cells from WT and KO mice. (A) The deactivation delays after cessation of stimulation with 12 mM glucose in the presence or absence of 10 µm forskolin. 1st quartile/median/3rd quartile (Q1/M/Q3), in seconds): 197/348/490 (12 mM glucose in WTs), 303/426/586 (12 mM glucose + 10 µM forskolin in WTs), 211/297/479 (12 mM glucose in KOs), and 477/820/861 (12 mM glucose + 10 µM forskolin in KOs); (B) The deactivation delays of cells after 1st deactivated cell after cessation of stimulation with 12 mM glucose in the presence or absence of 10 µm forskolin. Q1/M/Q3 (in seconds): 39/87/158 (12 mM glucose in WTs), 97/214/370 (12 mM glucose + 10 µM forskolin in WTs), 45/83/303 (12 mM glucose in KOs), and 153/210/293 (12 mM glucose + 10 µM forskolin in KOs); (C) Relative deactivation delays of cells after 1st deactivated cell after cessation of stimulation with 12 mM glucose in the presence or absence of 10 µm forskolin. Q1/M/Q3 (in seconds): 0.16/0.26/0.54 (12 mM glucose in WTs), 0.28/0.51/0.68 (12 mM glucose + 10 µM forskolin in WTs), 0.17/0.34/0.66 (12 mM glucose in KOs), and 0.24/0.32/0.58 (12 mM glucose + 10 µM forskolin in KOs). Data pooled from the following number of cells/islets: 678/13 (12 mM glucose in WTs), 640/10 (12 mM glucose + 10 µM forskolin in WT), 567/10 (12 mM glucose in KOs), 422/7 (12 mM glucose + 10 µM forskolin in KOs). Data were analyzed using one-way ANOVA on ranks (Kruskal-Wallis test) followed by Dunn’s multiple comparisons test, p values are indicated on graphs.

Similar articles

Cited by

References

    1. IDF . Diabetes Atlas. Brussels, Belgium: International Diabetes Federation; (2021).
    1. Weyer C, Bogardus C, Mott DM, Pratley RE. The natural history of insulin secretory dysfunction and insulin resistance in the pathogenesis of type 2 diabetes mellitus. J Clin Invest (1999) 104:787–94. doi: 10.1172/JCI7231 - DOI - PMC - PubMed
    1. Skelin Klemen M, Dolenšek J, Slak Rupnik M, Stožer A. The triggering pathway to insulin secretion: Functional similarities and differences between the human and the mouse β cells and their translational relevance. Islets (2017) 9:109–39. doi: 10.1080/19382014.2017.1342022 - DOI - PMC - PubMed
    1. Seino S, Sugawara K, Yokoi N, Takahashi H. beta-Cell signalling and insulin secretagogues: A path for improved diabetes therapy. Diabetes Obes Metab (2017) 19(Suppl 1):22–9. doi: 10.1111/dom.12995 - DOI - PubMed
    1. Ashcroft FM, Ashcroft SJH. Mechanism of insulin secretion. In: Ashcroft FM, Ashcroft SJH, editors. Insulin: molecular biology to pathology. Oxford, UK: IRL Press at Oxford University Press; (1992). p. 97–150.

Publication types