. 2023 Oct 1;136(19):jcs260644.
doi: 10.1242/jcs.260644. Epub 2023 Oct 11.

Loss of ATG4B and ATG4A results in two-stage cell cycle defects in pancreatic ductal adenocarcinoma cells

Affiliations

Loss of ATG4B and ATG4A results in two-stage cell cycle defects in pancreatic ductal adenocarcinoma cells

Paalini Sathiyaseelan et al. J Cell Sci. .

Abstract

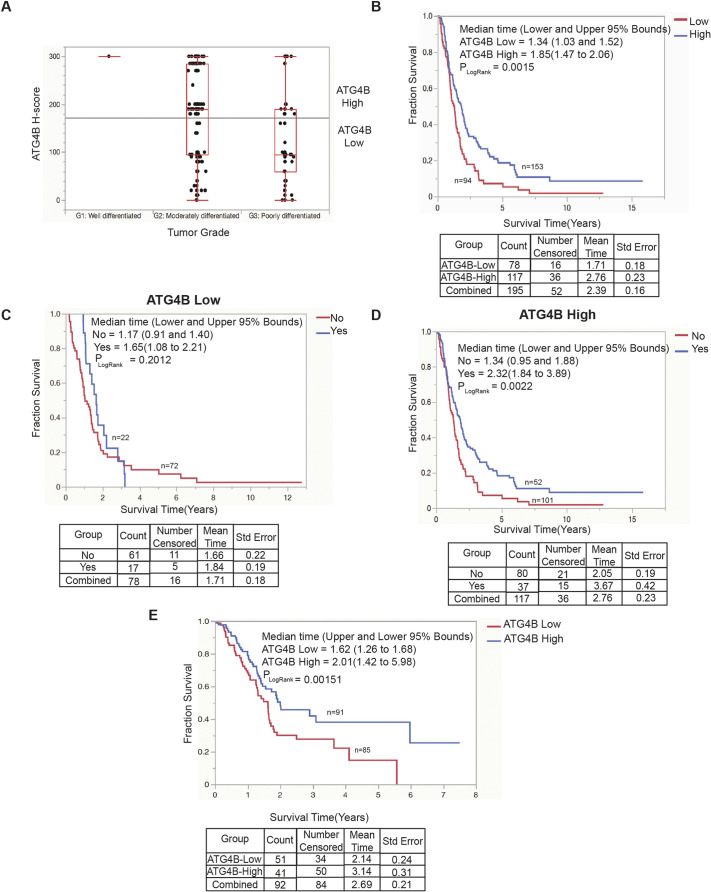
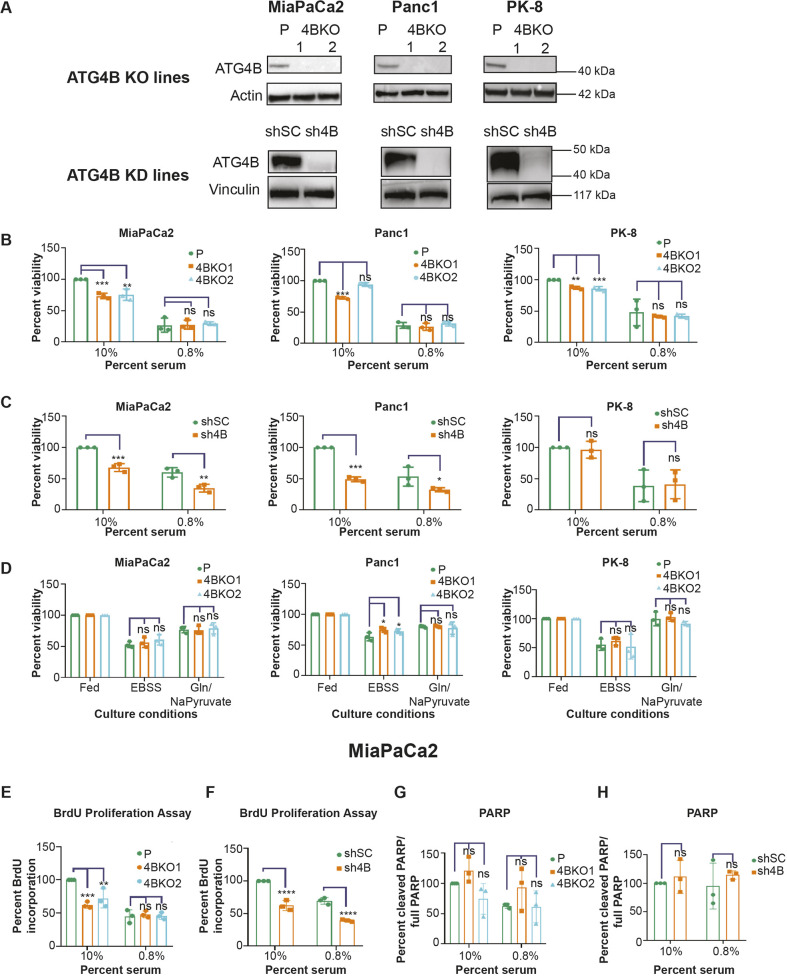
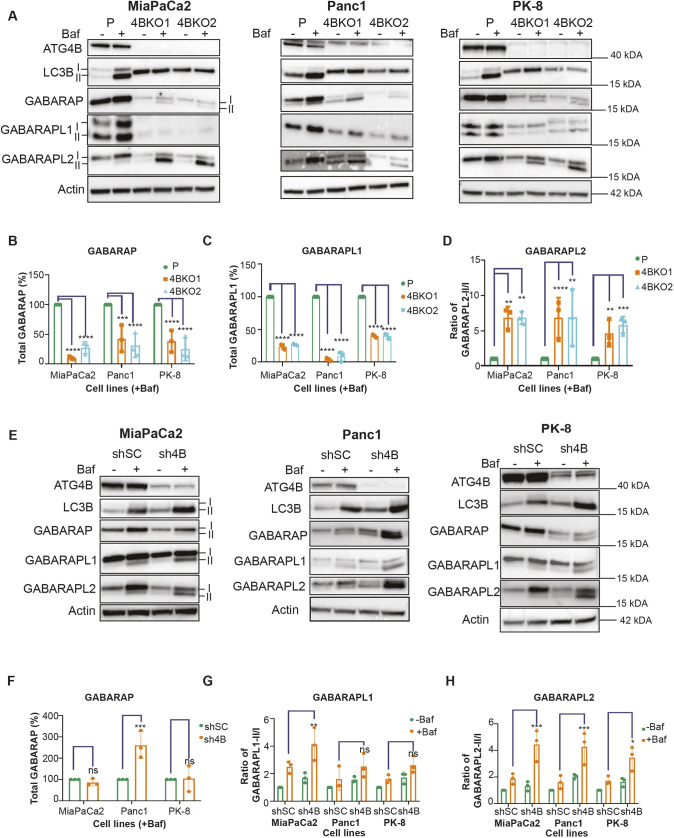
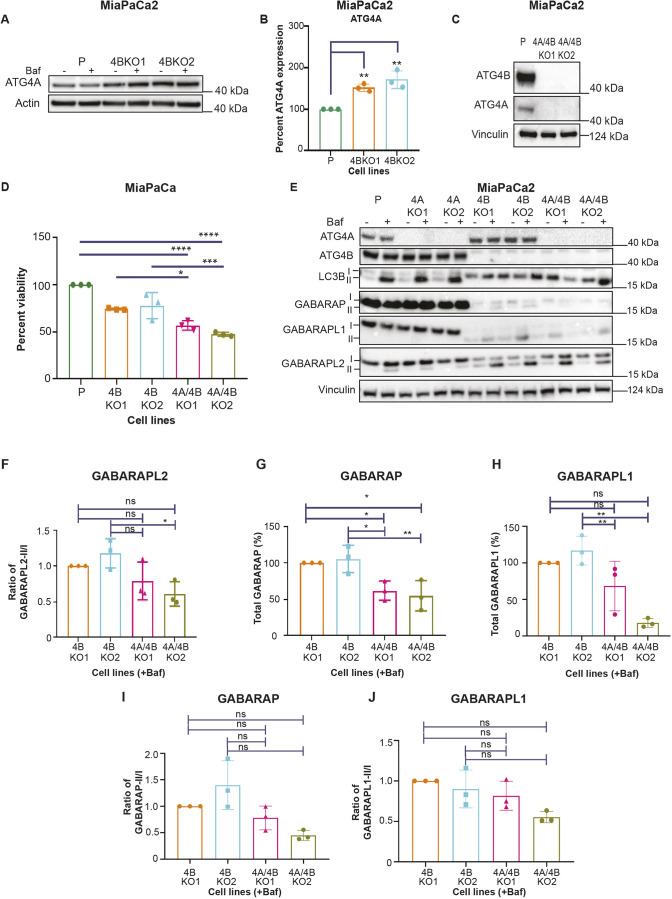
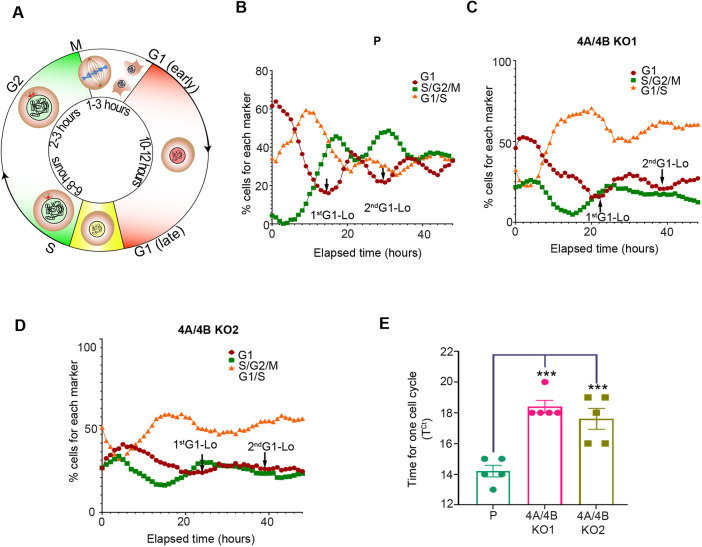
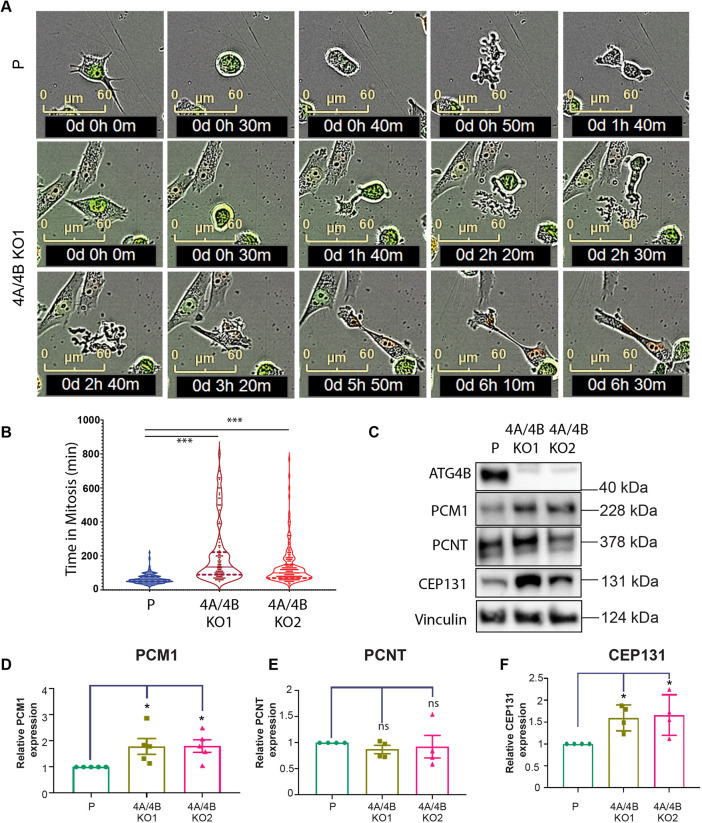
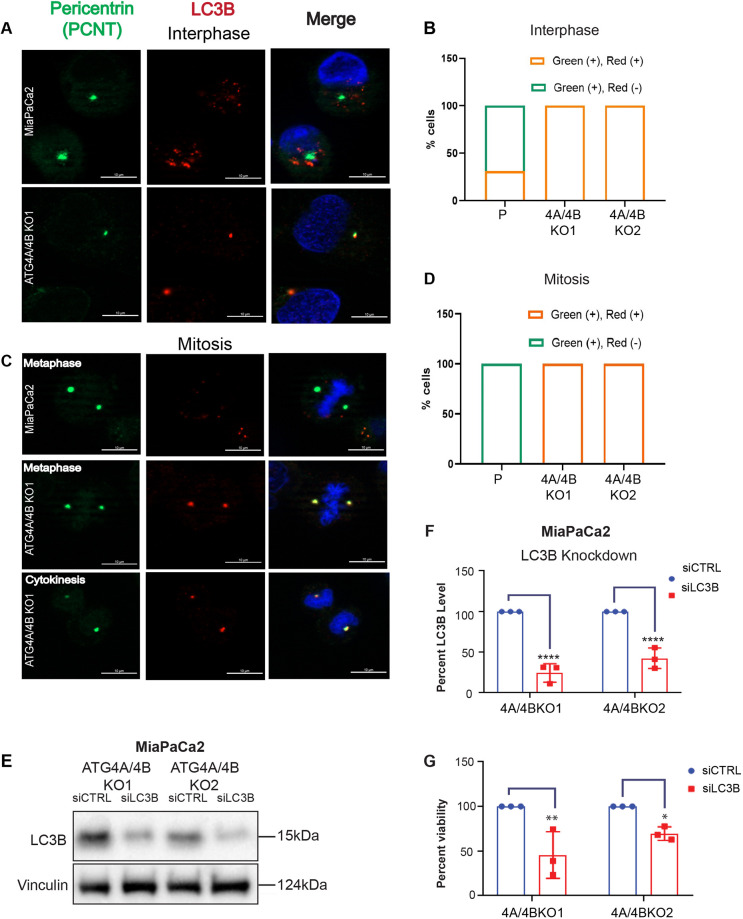
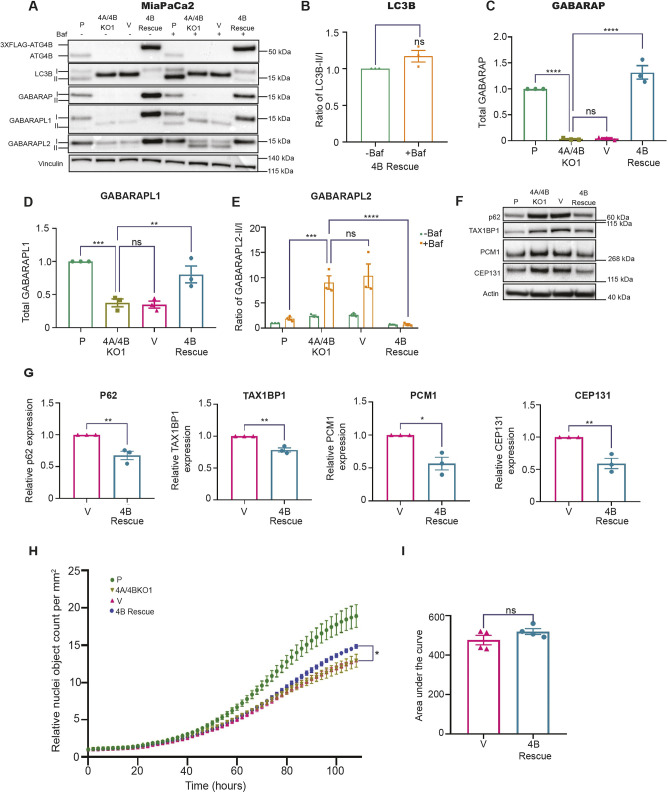
Pancreatic ductal adenocarcinoma (PDAC) exhibits elevated levels of autophagy, which promote tumor progression and treatment resistance. ATG4B is an autophagy-related cysteine protease under consideration as a potential therapeutic target, but it is largely unexplored in PDAC. Here, we investigated the clinical and functional relevance of ATG4B expression in PDAC. Using two PDAC patient cohorts, we found that low ATG4B mRNA or protein expression is associated with worse patient survival outcomes, poorly differentiated PDAC tumors and a lack of survival benefit from adjuvant chemotherapy. In PDAC cell lines, ATG4B knockout reduced proliferation, abolished processing of LC3B (also known as MAP1LC3B), and reduced GABARAP and GABARAPL1 levels, but increased ATG4A levels. ATG4B and ATG4A double knockout lines displayed a further reduction in proliferation, characterized by delays in G1-S phase transition and mitosis. Pro-LC3B accumulated aberrantly at the centrosome with a concomitant increase in centrosomal proteins PCM1 and CEP131, which was rescued by exogenous ATG4B. The two-stage cell cycle defects following ATG4B and ATG4A loss have important therapeutic implications for PDAC.

Keywords: ATG4A; ATG4B; Autophagy; CEP131; Centrosome; Doryphagy; GABARAP; PCM1; PDAC; Pancreatic cancer; pro-LC3B.


Conflict of interest statement

Competing interests The authors declare no competing or financial interests.

Figures

Fig. 1.
Fig. 1.
Low ATG4B expression is associated with poor PDAC patient outcomes. (A) Graph represents the ATG4B H-score distribution of PDAC specimens classified as either well differentiated (grade 1, G1), moderately differentiated (grade 2, G2) or poorly differentiated (grade 3, G3) tumor grade (P<0.0001, one-way ANOVA). Boxes represent the interquartile range, and the median is marked by a line. Whiskers represent minimum to maximum values. Horizontal line marks the mean of response across all observations. Total n=247. (B) Kaplan–Meier analysis comparing the disease-specific survival outcomes of the British Columbia PDAC patient cohort. Using recursive partitioning, the PDAC specimens were categorized as having either ATG4B-low (red; n=94; H-score<160) or ATG4B-high (blue; n=153; H-score≥160) protein expression (P=0.0015). Total n=247. (C) Disease-specific survival outcomes of PDAC patients with ATG4B-low tumors, stratified by treatment with adjuvant chemotherapy (blue: yes, chemotherapy treatment; red: no chemotherapy treatment). (D) Disease-specific survival outcomes of PDAC patients with ATG4B-high tumors, stratified by treatment with adjuvant chemotherapy (blue: yes, chemotherapy treatment; red: no chemotherapy treatment). (E) Kaplan–Meier analysis comparing the overall survival outcomes of TCGA PDAC patients (data courtesy of Human Protein Atlas, www.proteinatlas.org) with below average ATG4B RNA expression (ATG4B low; n=85) and equal to or above average ATG4B RNA expression (ATG4B high; n=91) (P=0.00151). In B–E, median survival time (years) for each group is shown, and the upper and lower 95% bounds for each category are denoted within brackets, with n shown on the graphs. A log-rank test (Mantel–Cox) was conducted to determine significant differences between survival curves (PLogRank). Details of count, along with mean survival time and standard error (Std error) are shown below the graphs.
Fig. 2.
Fig. 2.
ATG4B loss leads to reduced proliferation of PDAC cells. (A) Representative immunoblots of ATG4B and either actin or vinculin (loading controls) in parental (P), ATG4B KO (4BKO), scramble control shRNA (shSC) and ATG4B KD (sh4B) cell lines in MiaPaCa2, Panc1 and PK-8 backgrounds. Distinct 4BKO clonal lines (4BKO1 and 4BKO2) were tested (n=3 biological replicates). (B,C) Parental and ATG4B KO (B), and stable shSC and sh4B (C) PDAC cell lines (MiaPaCa2, Panc1 and PK-8) were grown under 10% or 0.8% serum conditions, as indicated, for 3 days. Cells were stained with 0.1% Crystal Violet to visualize adherent cells at the experimental end point. Percentage of stained cells, normalized to respective parental lines (B) or shSC (C) in 10% serum conditions, is shown. Mean±s.e.m. of n=3 replicates. (D) Parental and ATG4B KO lines were grown under fed (10% serum) conditions, complete starvation (EBSS) or glutamine and sodium pyruvate deprivation (Gln/NaPyruvate). Each cell line was normalized against their fed control. Percentage stained adherent cells was determined using a Crystal Violet assay. Mean±s.e.m. of n=3 replicates. (E,F) Quantification of BrdU incorporation assay in MiaPaCa2 KO (E) and sh4B (F) cell lines in 10% and 0.8% serum conditions, as indicated. Data are normalized to the parental line (E) and shSC line (F) under 10% serum conditions. Mean±s.e.m. of n=3 replicates. (G,H) Quantification of PARP cleavage assay [(cleaved PARP/full-length PARP)×100] performed in ATG4B KO (G) and sh4B (H) MiaPaCa2 lines in 10% and 0.8% culture conditions, as indicated. Each cell line in G and H is BafA1-treated and was normalized against the shSC (H) or parental (G) line under 10% serum condition. Mean±s.e.m. of n=3 replicates. *P<0.05; **P<0.01; ***P<0.001; ****P<0.0001; ns, not significant (two-way ANOVA with Dunnett's multiple comparison tests for comparisons of parental and ATG4B KO lines; two-way ANOVA with Sidak's multiple comparisons test for comparisons of sh4B and shSC lines).
Fig. 3.
Fig. 3.
ATG4B KO or KD enhances GABARAPL2 utilization. (A) Representative immunoblots of ATG4B, LC3B, GABARAP, GABARAPL1, GABARAPL2 and actin (loading control) in parental (P) and ATG4B KO (4BKO1 or 4BKO2) MiaPaCa2, Panc1 and PK-8 cell lines. Cells were grown in 10% serum with or without BafA1 (Baf). Lipidated (II) and unlipidated (I) forms are indicated for MiaPaCa2. Blots shown are representative of n=3. (B,C) Quantification of (B) total GABARAP (GABARAP-I and GABARAP-II) or (C) total GABARAPL1 (GABARAPL1-I and GABARAPL1-II) in the presence of Baf from three biological replicates. Each ATG4B KO cell line was normalized to its respective parental line (MiaPaCa2, Panc1 and PK-8). (D) Ratio of lipidated GABARAPL2 (GABARAPL2-II) to unlipidated GABARAPL2 (GABARAPL2-I) in Baf-treated samples in ATG4B KO lines and their respective parental lines. Values were normalized to their respective parental lines (n=3). (E) Representative immunoblots of ATG4B, LC3B, GABARAP, GABARAPL1, GABARAPL2 and actin (loading control) in scramble control (shSC) and ATG4B KD (sh4B) lines in MiaPaCa2, Panc1 and PK-8 backgrounds. Cells were grown in 10% serum with or without BafA1. Lipidated (II) and unlipidated (I) forms are indicated for MiaPaCa2. Blots shown are representative of n=3. (F) Quantitation of total GABARAP (GABARAP-I and GABARAP-II) from the three biological replicates with BafA1. Each cell line was normalized to its respective control (shSC). (G) The ratio of GABARAPL1-II to GABARAPL1-I in sh4B lines and the respective shSC lines with and without BafA1 (n=3). (H) Ratio of lipidated GABARAPL2 (GABARAPL2-II) to unlipidated GABARAPL2 (GABARAPL2-I) with and without BafA1 in the three biological replicates. In G and H, values were normalized to the shSC controls without BafA1 for each cell line. In B–D and F–G, data are presented as mean±s.e.m. *P<0.05; **P<0.01; ***P<0.001; ****P<0.0001; ns, not significant (two-way ANOVA with Dunnett's multiple comparisons tests for comparisons of parental and ATG4B KO lines; two-way ANOVA with Sidak's multiple comparisons test for comparisons of sh4B and shSC lines).
Fig. 4.
Fig. 4.
ATG4B KO lines have elevated ATG4A levels, and the combined loss of ATG4B and ATG4A further reduces viability as well as levels of GABARAP and GABARAPL1. (A) Representative immunoblot of ATG4A and actin (loading control) in MiaPaCa2 parental (P) and ATG4B KO lines with (+) and without (−) BafA1 (Baf) treatment (representative of n=3). (B) Bar graph showing quantification of ATG4A levels, from western blots as shown in A (percentage, normalized to the parental line), in samples from BafA1-treated MiaPaCa2 parental and ATG4B KO lines Mean±s.e.m. (n=3). **P<0.01 (ordinary one-way ANOVA with Dunnett's multiple comparisons tests). (C) Immunoblot representation of ATG4B, ATG4A and vinculin in parental and ATG4A/4B KO lines of MiaPaCa2 (representative of n=3). (D) Graphical representation of cell viability (%), determined using the Crystal Violet assay, of MiaPaCa2 parental, ATG4B KO and ATG4A/4B KO lines grown in 10% serum conditions for 72 h. Each sample was normalized to the parental line, but statistical significance was determined by comparing each ATG4A/4B KO line to the ATG4B KO line it was derived from (e.g. 4BKO1 versus 4A/4BKO1) or by comparing parental and ATG4A/4B KO lines. Mean±s.e.m. (n=3). *P<0.05; ***P<0.001; ****P<0.0001 (ordinary one-way ANOVA with Dunnett's multiple comparison tests). (E) Immunoblot of ATG4A, ATG4B, LC3B, GABARAP, GABARAPL1, GABARAPL2 and vinculin (loading control) in MiaPaCa2 parental, ATG4A KO, ATG4B KO and ATG4A/4B KO lines with (+) and without (−) BafA1 treatment (representative of n=3). Lipidated (II) and unlipidated (I) forms are indicated. (F–J) Bar graphs of (F) ratio of lipidated GABARAPL2 (GABARAPL2-II) to unlipidated GABARAPL2 (GABARAPL2-I), (G) total GABARAP (GABARAP-I and GABARAP-II), (H) total GABARAPL1 (GABARAPL1-II and GABARAPL1-I), (I) ratio of lipidated GABARAP (GABARAP-II) to unlipidated GABARAP (GABARAP-I), and (J) ratio of lipidated GABARAPL1 (GABARAPL1-II) to unlipidated GABARAPL1 (GABARAPL1-I), all in MiaPaCa2 ATG4B KO and ATG4A/4B KO lines with BafA1 treatment. Data are normalized to 4BKO1. Mean±s.e.m. (n=3). *P<0.05; **P<0.01; ns, not significant (ordinary one-way ANOVA with Dunnett's multiple comparisons tests).
Fig. 5.
Fig. 5.
Loss of ATG4B and ATG4A results in cell cycle delay in PDAC cells. (A) Schematic depiction of the FUCCI indicator at different stages of the cell cycle. Red nuclei indicate cells in G1 phase; green nuclei indicate cells in S phase, G2 phase and G2-M transition; and yellow nuclei indicate cells in G1-S transition. Colorless nuclei indicate cells transitioning between M and G1 phases. (B–D) Red and green fluorescence images of (B) MiaPaCa2 parental (P), (C) 4A/4BKO1 and (D) 4A/4BKO2 cells expressing the FUCCI indicator were acquired on an Incucyte live-cell analysis system every hour for up to 80 h. The percentage of cells with red (G1), green (S/G2/M), or both red and green (overlap, yellow; G1/S) nuclei were calculated as a function of time using the Incucyte basic analyzer software. Representative graphs from five independent replicates are shown. Arrows indicate minima in percentage of cells in G1 across successive cell cycles (1st G1-Lo, 2nd G1-Lo). (E) Time for one cell cycle was calculated for MiaPaCa2 parental, 4A/4BKO1 and 4A/4BKO2 cells. Time between the first and second G1 minimum (G1-Lo, as indicated in B–D) was used to calculate the time taken for one cell cycle (TCt). Mean±s.e.m. of five replicates. ***P<0.001 (ordinary one-way ANOVA with Dunnett's multiple comparisons test).
Fig. 6.
Fig. 6.
ATG4A/4B loss leads to mitotic defects, increased time in mitosis and increase in PCM1 and CEP131 levels. (A) Time-lapse imaging of MiaPaCa2 parent (P) and ATG4A/4B KO cells (4A/4BKO1) stably expressing FUCCI. Phase-contrast and fluorescence images were acquired every 10 min using the Incucyte system to determine the time taken for cells to complete mitosis. Examples of a parental MiaPaCa2 cell (40 min in mitosis; rounding at 10 min and division at 50 min, top panel) and an ATG4A/4B KO cell (>2 h in mitosis; rounding at 30 min and division at 2 h 40 m; bottom panels) are shown. See also Movies 1 and 2. (B) Graph represents the quantification of time in mitosis for MiaPaCa2 parent (P; n=229), 4A/4B KO1 (n=132) and 4A/4B KO2 (n=175); total n is a sum of cells from three biological replicates. Violin plots show the distribution of time in mitosis, with the median (line) and the upper and lower quartiles (dashed lines) indicated. (C) Representative western blot of centrosomal proteins PCM1, PCNT and CEP131, along with ATG4B and vinculin as loading control, in MiaPaCa2 parental (P) and ATG4A/4B KO (4A/4BKO1 and 4A/4BKO2). Representative of n=4. (D–F) Expression levels (quantified by western blotting and expressed relative to levels in parental cells) of (D) PCM1, (E) PCNT and (F) CEP131 were quantified in MiaPaCa2 parental and ATG4A/4B KO cell lines (n=4). Mean±s.e.m. *P<0.05; ns, not significant (ordinary one-way ANOVA with Dunnett's multiple comparisons test relative to MiaPaCa2 parental).
Fig. 7.
Fig. 7.
Pro-LC3B localizes to centrosomes at both interphase and mitosis and supports viability. (A) Representative images of PCNT (green) and LC3B (red) in MiaPaCa2 parental cells (cleaved LC3B) and 4A/4B KO1 cells (pro-LC3B) at interphase. DNA is stained using DAPI (blue). Scale bars: 10 µm. (B) Quantification of PCNT (green) and LC3B (red) colocalization [green (+), red (+)], as well as PCNT alone [green (+), red (−)], at centrosomes (parental, P, n=74 cells; 4A/4BKO1, n=84 cells; 4A/4BKO2, n=71 cells; sum from at least two biological replicates). (C) Representative images of PCNT (green) and LC3B (red) in MiaPaCa2 parental (cleaved LC3B) and 4A/4B KO1 (pro-LC3B) cells at mitosis. DNA is stained using DAPI (blue). Scale bars:10 µm. (D) Quantification of PCNT (green) and LC3B (red) colocalization [green (+), red (+)], as well as PCNT alone [green (+), red (−)], at centrosomes (parental, P, n=16 cells; 4A/4BKO1, n=19; 4A/4BKO2, n=15; sum from at least two biological replicates). (E) MiaPaCa2 ATG4A/4B KO lines were treated with either siCTRL (scramble) or siLC3B (siRNA targeting LC3B) for 8 days (siRNA replaced every 72 h). Immunoblot of pro-LC3B and vinculin (loading control) in MiaPaCa2 ATG4A/4B KO lines. Representative image of three biological replicates. (F) Quantification of pro-LC3B levels (expressed as a percentage relative to siCTRL) in MiaPaCa2 ATG4A/4B KO lines treated with either siCTRL or siLC3B. Each sample was normalized to the respective siCTRL (n=3). (G) Graph shows the percentage viability of MiaPaCa2 ATG4A/4B KO lines treated with either siCTRL or siLC3B. Cell viability was assessed using Crystal Violet staining at the experimental end point (8 days). Each sample was normalized to the respective siCTRL (n=3). In F and G, data are presented as mean±s.e.m. *P<0.05; **P<0.01; ****P<0.0001 (two-way ANOVA with Sidak's multiple comparisons test).
Fig. 8.
Fig. 8.
ATG4B re-expression rescues LC3B processing, GABARAP subfamily protein levels, and the accumulation of autophagy receptors and centrosomal proteins. (A) Representative immunoblots of ATG4B, LC3B, GABARAP, GABARAPL1, GABARAPL2 and vinculin (loading control) in MiaPaCa2 parental (P), 4A/4BKO1, 4A/4BKO1 with N-3×FLAG empty vector (V) and 4A/4BKO1 with N-3×FLAG–ATG4B (4B Rescue) cell lines. Cells were grown in 10% serum for 48 h and treated with (+) or without (−) BafA1 (Baf) for 4 h prior to harvesting. Lipidated (II) and unlipidated (I) forms are indicated. Blots shown are representative of n=3. (B) Ratio of lipidated LC3B (LC3B-II) to unlipidated LC3B (LC3B-I) in the absence and presence of BafA1 in the 4B Rescue line, normalized to the no BafA1 condition. Mean±s.e.m., n=3 (ns, not significant; two-tailed unpaired t-test). (C) Quantification of total GABARAP (GABARAP-I and GABARAP-II) in the presence of BafA1 for the indicated cell lines. Values were normalized to parental (P) control. n= 3. (D) Quantification of total GABARAPL1 (GABARAPL1-I and GABARAPL1-II) in the presence of BafA1 for the indicated cell lines. Values were normalized to parental (P) control. n=3. (E) Quantification of the ratio of lipidated GABARAPL2 (GABARAPL2-II) to unlipidated GABARAPL2 (GABARAPL2-I) in the presence and/or absence of BafA1 for the indicated cell lines (n=3). Values were normalized to BafA1-untreated samples. n=3. In C–E, data are presented as mean±s.e.m. **P<0.01; ***P<0.001; ****P<0.0001; ns, not significant (ordinary one-way ANOVA with Dunnett's multiple comparisons test was used in C and D to determine statistical significance between 4A/4BKO1 and P, V and 4B Rescue for GABARAP and GABARAPL1; two-way ANOVA with Tukey's multiple comparisons test was used in E to determine statistical significance between 4A/4BKO1 and P, V and 4B Rescue for GABARAPL2 in BafA1-treated samples). (F) Representative immunoblots of p62, TAX1BP1, PCM1, CEP131 and actin (loading control) in MiaPaCa2 parental (P), 4A/4BKO1, 4A/4BKO1 with N-3×FLAG empty vector (V), and 4A/4BKO1 with N-3×FLAG–ATG4B (4B Rescue) cell lines. Cells were grown in 10% serum for 48 h and harvested without the addition of BafA1. Blots shown are representative of n=3. (G) Quantitation of p62, TAX1BP1, PCM1 and CEP131. Values were normalized to expression levels in the vector-only control (V). Mean±s.e.m., n=3. *P<0.05; **P<0.01 (two-tailed unpaired t-test). (H) Curves representing the total nuclei count of MiaPaCa2 parental (P), 4A/4BKO1, 4A/4BKO1 with C-3×FLAG empty vector (V) and 4A/4BKO1 with C-3×FLAG–ATG4B (4B Rescue) cell lines, generated using the Incucyte system. Cells were grown in 10% serum, stained with NucLight Rapid Red and Cytotox Green dyes, and left to grow for 108 h (4.5 days). Mean±s.e.m., n=4. *P<0.05 (comparison of V versus 4B Rescue at 108 h end point; two-tailed unpaired t-test). (I) Graph showing area under the curve for V and 4B Rescue cell lines in H. Mean±s.e.m, n=4. ns, not significant (two-tailed unpaired t-test).

References

    1. Agrotis, A. and Ketteler, R. (2019). On ATG4B as drug target for treatment of solid tumours—the knowns and the unknowns. Cells 9, 53. 10.3390/cells9010053 - DOI - PMC - PubMed
    1. Agrotis, A., Pengo, N., Burden, J. J. and Ketteler, R. (2019). Redundancy of human ATG4 protease isoforms in autophagy and LC3/GABARAP processing revealed in cells. Autophagy 15, 976-997. 10.1080/15548627.2019.1569925 - DOI - PMC - PubMed
    1. Bortnik, S., Choutka, C., Horlings, H. M., Leung, S., Baker, J. H. E., Lebovitz, C., Dragowska, W. H., Go, N. E., Bally, M. B., Minchinton, A. I.et al. (2016). Identification of breast cancer cell subtypes sensitive to ATG4B inhibition. Oncotarget 7, 66970-66988. 10.18632/oncotarget.11408 - DOI - PMC - PubMed
    1. Bortnik, S., Tessier-Cloutier, B., Leung, S., Xu, J., Asleh, K., Burugu, S., Magrill, J., Greening, K., Derakhshan, F., Yip, S.et al. (2020). Differential expression and prognostic relevance of autophagy-related markers ATG4B, GABARAP, and LC3B in breast cancer. Breast Cancer Res. Treat. 183, 525-547. 10.1007/s10549-020-05795-z - DOI - PubMed
    1. Bosc, D., Vezenkov, L., Bortnik, S., An, J., Xu, J., Choutka, C., Hannigan, A. M., Kovacic, S., Loo, S., Clark, P. G. K.et al. (2018). A new quinoline-based chemical probe inhibits the autophagy-related cysteine protease ATG4B. Sci. Rep. 8, 11653. 10.1038/s41598-018-29900-x - DOI - PMC - PubMed

Publication types

MeSH terms

Grants and funding