. 2023 Nov;10(31):e2304638.
doi: 10.1002/advs.202304638. Epub 2023 Sep 13.

KLF5 Promotes Tumor Progression and Parp Inhibitor Resistance in Ovarian Cancer

Affiliations

KLF5 Promotes Tumor Progression and Parp Inhibitor Resistance in Ovarian Cancer

Yong Wu et al. Adv Sci (Weinh). 2023 Nov.

Abstract

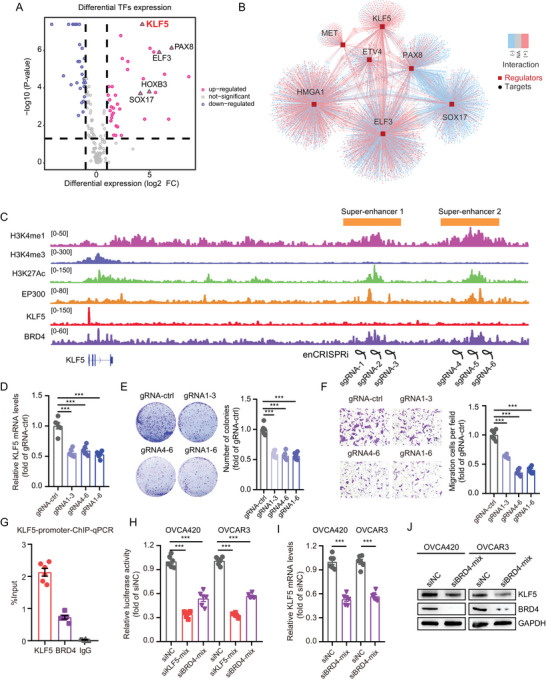
One major characteristic of tumor cells is the aberrant activation of epigenetic regulatory elements, which remodel the tumor transcriptome and ultimately promote cancer progression and drug resistance. However, the oncogenic functions and mechanisms of ovarian cancer (OC) remain elusive. Here, super-enhancer (SE) regulatory elements that are aberrantly activated in OC are identified and it is found that SEs drive the relative specific expression of the transcription factor KLF5 in OC patients and poly(ADP-ribose) polymerase inhibitor (PARPi)-resistant patients. KLF5 expression is associated with poor outcomes in OC patients and can drive tumor progression in vitro and in vivo. Mechanistically, KLF5 forms a transcriptional complex with EHF and ELF3 and binds to the promoter region of RAD51 to enhance its transcription, strengthening the homologous recombination repair (HRR) pathway. Notably, the combination of suberoylanilide hydroxamic acid (SAHA) and olaparib significantly inhibits tumor growth and metastasis of PARPi-resistant OC cells with high KLF5. In conclusion, it is discovered that SEs-driven KLF5 is a key regulatory factor in OC progression and PARPi resistance; and potential therapeutic strategies for OC patients with PARPi resistance and high KLF5 are identified.

Keywords: KLF5; PARPi resistance; RAD51; homologous recombination repair; ovarian cancer; super-enhancer.


Conflict of interest statement

The authors declare no conflict of interest.

Figures

Figure 1
Figure 1
Depicting super‐enhancer elements in OC. A) Flowchart of the analysis strategy used to identify abnormally activated SEs in OC. ChIP‐seq of H3K4me1, H3K4me3, H3K27Ac, polII, and EP300 in six OC cells (OVCA420, OVCA429, OVCAR3, TOV21G, ES2, and A2780) and one normal ovarian epithelial cell (IOSE80) were performed. The public H3K27Ac ChIP‐seq data of NCI_ADR‐RES, IGRPV1, OVCAR4, OVCAR5, OVCAR8, and SKOV3, were collected, and RNA‐seq data, including eight normal ovarian tissues and 30 OC tissues from FUSCC was collected to perform transcriptional analysis. Data were integrated to identify active SEs and related downstream targeted genes. B) The venn diagram shows the number of SEs in each subtype of OC. 187 SEs were shared in three types of OC. C–E) The number of SEs in OVCAR5 (C; SE = 710), IGRPV1 (D; SE = 653), and ES2 (E; SE = 593) cells and the representation of adjacent representative genes. SEs are marked with black dots. F) The matrix shows pair‐wise similarity of SEs detected in different cell types. The degree of similarity is colored in proportion to the overlap percentage. The top part (green rectangle) represents the endome type of OC cell lines, the middle part (pink rectangle) represents the high‐grade type of OC cell lines, and the bottom part (orange rectangle) represents the OCCC type of OC cell lines. G) The specific and shared KEGG signaling pathways of SEs adjacent gene enrichment in three OC subtypes.
Figure 2
Figure 2
SEs drive KLF5 transcription and self‐transcriptional regulation of KLF5 in OC. A) The volcano plot shows differential expression of TFs in OC using FUSCC cohort RNA‐seq data, including eight normal ovarian tissues and 30 OC tissues. The expression of KLF5 was abnormally high in OC with the most significant statistical difference (P = 4.09E‐08; Fold‐change = 21.257). B) Differential expression of TFs and regulatory networks of its downstream genes. C) ChIP‐seq of H3K4me1, H3K4me3, H3K27Ac, EP300, KLF5 and BRD4 at KLF5 promoter and two upstream SEs. Guide RNAs were designed to target inhibition the activity of SEs of KLF5 using the enCRISPRi system. D) The mRNA levels of KLF5 in OVCA420 cells infected with dCas9‐KRAB, sgRNAs targeting KLF5 SEs, and MCP‐LSD1 lentivirus. E,F) Blockade the KLF5 SEs inhibits colony number formation (E) and migration ability (F) in OVCA420 cells using enCRISPRi lentivirus. G) The ChIP‐qPCR assay shows the binding of KLF5 and BRD4 at the KLF5 promoter in the OVCA420 cell. H) The luciferase activity of KLF5 promoter transfected with KLF5 or BRD4 siRNAs in OVCA420 and OVCAR3 cells. I,J) The mRNA levels (I) and protein levels (J) of KLF5 transfected with BRD4 siRNAs in OVCA420 and OVCAR3 cells. Values represent the mean ± SEM, n = 6 in (D–I). *** p < 0.001.
Figure 3
Figure 3
KLF5 is specifically overexpressed in OC and clinically associated with patient prognosis. A) The mRNA levels of KLF5 in different normal and tumor samples in the TCGA dataset. B) The mRNA levels of KLF5 in normal and OC samples in FUSCC cohort 1. C,D) Kaplan–Meier curves of overall survival (C) and disease‐free survival (D) in FUSCC cohort 1 stratified by KLF5 mRNA levels of OC tissues. E) Representative immunostaining images of KLF5 in 74 normal and 165 OC tissues of FUSCC cohort 2. F) Immunoblotting for KLF5 protein levels in normal and OC tissues. G,H) Kaplan–Meier curves of overall survival (G) and disease‐free survival (H) in FUSCC cohort 2 stratified by KLF5 protein levels of OC tissues. *** p < 0.001.
Figure 4
Figure 4
KLF5 drives OC tumor growth and metastasis. A,B) Colony formation assays (A) and transwell migration assays (B) of OVCA420 and TOV21G cells transfected with KLF5 siRNAs or control siRNA. C) The correlation between KLF5 mRNA levels with CRISPR affected value (proliferative ability) in OC cell lines from the Depmap dataset. D) Immunoblotting for KLF5 protein levels in OVCA420 and SKOV3 cells infected with Cas9 and KLF5 sgRNAs. E) Cell Counting Kit‐8 (CCK‐8) assay of OVCA420 and SKOV3 cells infected with Cas9 and KLF5 sgRNAs. F,G) Colony formation assays (F) and transwell migration assays (G) of OVCA420 and SKOV3 cells infected with Cas9 and KLF5 sgRNAs. H) Xenograft tumors in nude mice. SKOV3 cells were infected with Cas9 and control gRNA or sgKLF5‐1 or sgKLF5‐2 knockdown lentivirus and subcutaneously injected into the flanks of 6 weeks old nude mice. I) Knockout of KLF5 reduced the weight of xenograft tumors (n = 6 mice per group). J) PET‐CT shows the abdominal tumor metastasis of TOV21G cells infected with Cas9 and KLF5 sgRNAs. K,L) The relative SUV max and nodule number peritoneal cavity of TOV21G cells infected with Cas9 and KLF5 sgRNAs. Values represent the mean ± SEM, n = 6 in (A,B; F–L). *** p < 0.001.
Figure 5
Figure 5
KLF5 regulates RAD51 transcription and HRR pathway. A) Top six enriched KEGG downregulated pathways and three upregulated pathways in OVCA420 cells transfected with KLF5 siRNAs or control siRNA. B) GSEA enriched cell cycle (NES = −2.2) and homologous recombination (NES = −2.3) pathway in OVCA420 cell transfected with KLF5 siRNAs or control siRNA. C) The genome‐wide binding sites of KLF5 in OVCA420 cells, most of which were located in promoter regions. D) Venn diagram of KLF5 ChIP‐seq (fold‐enrichment with input > = 5) and RNA‐seq data (fold‐change with siNC < = 0.5) shows 32 genes transcriptionally regulated by KLF5 in OVCA420 cells. E) The proliferative value of KLF5 target genes in OVCA420 from the Depmap dataset suggests these genes participated in OC cell proliferation. F) The ChIP‐seq data of KLF5 in OVCA420 shows the binding of KLF5 at RAD51 promoter regions. G) Immunoblotting for RAD51, p‐H2AX, KLF5 protein levels in OVCA420, SKOV3, and TOV21G cells transfected with KLF5 siRNAs or control siRNA. H) Comet assay in OVCA420 and TOV21G cells transfected with KLF5 siRNAs or control siRNA. I) Immunofluorescence staining with RAD51 antibody and γ‐H2AX antibody in OVCA420 cells treated with cisplatin (10 µm, 1 h). Cell nuclei were counterstained with DAPI. J,K) Quantitative results of RAD51 foci (J) and γ‐H2AX foci (K). Cells with more than five foci were defined as positive and counted six times (at least 50 cells per cell line each time). Values represent the mean ± SEM, n = 6 in (H, J,K). Scale bar = 10 µm. *** p < 0.001.
Figure 6
Figure 6
KLF5 forms a transcriptional complex with EHF and ELF3. A) Immunoprecipitation‐mass spectrometry of OVCA420 cells immunoprecipitated with an anti‐KLF5 antibody or control IgG and analyzed by SDS‐PAGE (10%). B) Motif analysis of KLF5, EHF, and ELF3 in OVCA420 cells. C) Co‐immunoprecipitation analyses show the interaction between endogenous KLF5, EHF and ELF3 in OVCA420 and OVCAR3 cells. D) The ChIP‐seq data shows the enrichment of EHF, ELF3, and KLF5 in RAD51 promoter region in OVCA420 cells. E) The enrichment ability of polII in RAD51 promoter region in OVCA420 and OVCAR3 cells transfected with EHF, ELF3 siRNAs, or control siRNA. F,G) The RAD51 mRNA levels (F) and protein levels (G) in OVCA420 and OVCAR3 cells transfected with EHF, ELF3 siRNAs, or control siRNA. H) Immunoblotting for EHF, ELF3, and KLF5 protein levels in OVCA420 and OVCAR3 cells transfected with KLF5 siRNAs or control siRNA. I) The ChIP‐seq data of KLF5, H3K4me1, H3K27Ac, H3K4me3, and polII shows the enrichment of KLF5 in ELF3 promoter and SE regions and EHF promoter region in OVCA420 cells. J,K) The EHF and ELF3 mRNA levels in OVCA420 (J) and OVCAR3 (K) cells transfected with KLF5 siRNAs or control siRNA. L) The enrichment ability of EHF and ELF3 in RAD51 promoter regions in OVCA420 cells and OVCAR3 cells transfected with KLF5 siRNAs or control siRNA. Values represent the mean ± SEM, n = 6 in (E,F; J–L). *** p < 0.001.
Figure 7
Figure 7
Clinical significance of EHF and ELF3 in OC patients. A) The mRNA levels of EHF in normal and OC samples in FUSCC cohort 1. B,C) Kaplan–Meier curves of overall survival (B) and disease‐free survival (C) in FUSCC cohort 1 stratified by EHF mRNA levels of OC tissues. D) The mRNA levels of ELF3 in normal and OC samples in FUSCC cohort 1. E,F) Kaplan–Meier curves of overall survival (E) and disease‐free survival (F) in FUSCC cohort 1 stratified by ELF3 mRNA levels of OC tissues. G,H) Representative immunostaining images of EHF (G) and ELF3 (H) in FUSCC cohort2 OC tissues. I,J) Kaplan–Meier curves of overall survival (I) and disease‐free survival (J) in FUSCC cohort 2 stratified by EHF protein levels of OC tissues. K,L) Kaplan–Meier curves of overall survival (K) and disease‐free survival (L) in FUSCC cohort 2 stratified by ELF3 protein levels of OC tissues. M,N) Kaplan–Meier curves of overall survival (M) and disease‐free survival (N) in FUSCC cohort 2 stratified by KLF5/EHF/ELF3 protein levels of OC tissues. *** p < 0.001.
Figure 8
Figure 8
KLF5 governs OC susceptibility to PARP inhibitors. A) Immunoblotting for KLF5 protein levels in 11 OC cell lines. B) The correlation between KLF5 protein levels and IC50 value of olaparib in OC cell lines. C) Immunoblotting for KLF5 protein levels in olaparib‐sensitive (Ola‐S) or resistant (Ola‐R) PDX samples of OC. D) The activity of super‐enhancer 2 of KLF5 in olaparib sensitive or resistant PDX samples of OC determined by ChIP‐qPCR of H3K27Ac signal. E) The KLF5 mRNA levels (left) and KLF5, RAD51, BRD4 protein levels (right) in ES2, A2780 and olaparib‐treated ES2 and A2780 cells. F) The activity of super‐enhancer 2 of KLF5 in ES2, A2780, and olaparib‐treated ES2 and A2780 cells was determined by ChIP‐qPCR of the H3K27Ac signal. G) Immunoblotting for KLF5 and RAD51 protein levels in SKOV3, TOV21G, and OVCA420 cells treated with DMSO or SAHA (1 µm). H) The colony formation assay in OVCA420 and SKOV3 cells treated with DMSO, olaparib (10 µm), SAHA (0.5 µm), and olaparib combined with SAHA. I) The IC50 value of olaparib in SKOV3 and TOV21G cells treated with olaparib or olaparib combined with SAHA. J,K) Xenograft tumors (J) and tumor volume (K) in NSG mice model treated with DMSO, olaparib, SAHA, and olaparib combined with SAHA. L–N) The luciferase image (L), luciferase value (M), and nodule number of the peritoneal cavity (N) show the abdominal tumor metastasis of TOV21G cells treated with DMSO, olaparib, SAHA, olaparib combined with SAHA in BALB/C‐nude mice. O) The working model of SEs‐driven KLF5 promoted OC progression and PARPi resistance through “KLF5/EHF/ELF3RAD51‐HRR pathway”, and SAHA combined with olaparib may be the promising strategy for KLF5 highly expressed and PARPi‐resistant OC patients. Values represent the mean ± SEM, n = 6 in (D–F; H; J–K), n = 4 in (L–N). * p < 0.05, ** p < 0.01, and *** p < 0.001.

References

    1. Siegel R. L., Miller K. D., Wagle N. S., Jemal A., Ca‐Cancer J. Clin. 2023, 73, 17. - PubMed
    1. Ciucci A., Buttarelli M., Fagotti A., Scambia G., Gallo D, Cellular Molecular Life Sci. 2022, 79, 364. - PMC - PubMed
    1. Macintyre G., Goranova T. E., De Silva D., Ennis D., Piskorz A. M., Eldridge M., Sie D., Lewsley L.‐A., Hanif A., Wilson C., Dowson S., Glasspool R. M., Lockley M., Brockbank E., Montes A., Walther A., Sundar S., Edmondson R., Hall G. D., Clamp A., Gourley C., Hall M., Fotopoulou C., Gabra H., Paul J., Supernat A., Millan D., Hoyle A., Bryson G., Nourse C., et al., Nat. Genet. 2018, 50, 1262. - PMC - PubMed
    1. Lheureux S., Gourley C., Vergote I., Oza A. M., Lancet 2019, 393, 1240. - PubMed
    1. Wiesner T., Lee W., Obenauf A. C., Ran L., Murali R., Zhang Q. F., Wong E. W. P., Hu W., Scott S. N., Shah R. H., Landa I., Button J., Lailler N., Sboner A., Gao D., Murphy D. A., Cao Z., Shukla S., Hollmann T. J., Wang L., Borsu L., Merghoub T., Schwartz G. K., Postow M. A., Ariyan C. E., Fagin J. A., Zheng D., Ladanyi M., Busam K. J., Berger M. F., Nature 2015, 526, 453. - PMC - PubMed

MeSH terms

Substances