. 2023 Sep;131(9):97006.
doi: 10.1289/EHP12125. Epub 2023 Sep 13.

Urinary Paraben Concentrations and Associations with the Periconceptional Urinary Metabolome: Untargeted and Targeted Metabolomics Analyses of Participants from the Early Pregnancy Study

Affiliations

Urinary Paraben Concentrations and Associations with the Periconceptional Urinary Metabolome: Untargeted and Targeted Metabolomics Analyses of Participants from the Early Pregnancy Study

Ana K Rosen Vollmar et al. Environ Health Perspect. 2023 Sep.

Abstract

Background: Parabens, found in everyday items from personal care products to foods, are chemicals with endocrine-disrupting activity, which has been shown to influence reproductive function.

Objectives: This study investigated whether urinary concentrations of methylparaben, propylparaben, or butylparaben were associated with the urinary metabolome during the periconceptional period, a critical window for female reproductive function. Changes to the periconceptional urinary metabolome could provide insights into the mechanisms by which parabens could impact fertility.

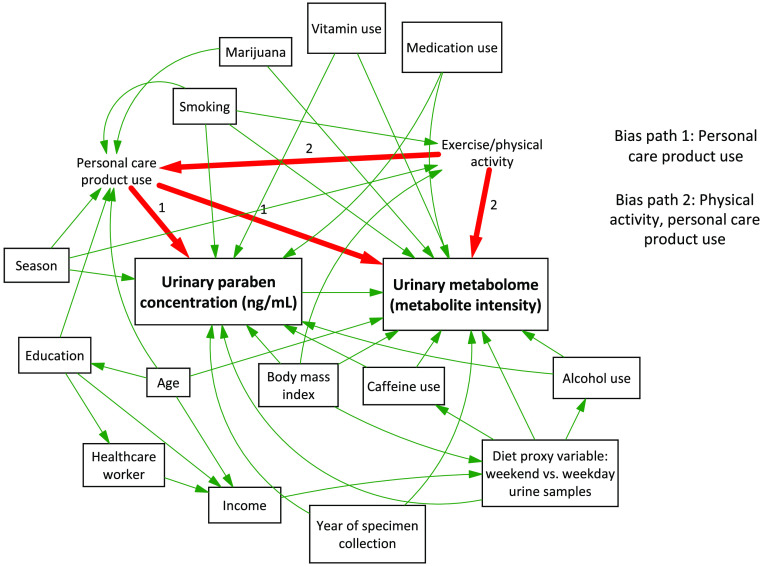
Methods: Urinary paraben concentrations were measured in paired pre- and postconception urine samples from 42 participants in the Early Pregnancy Study, a prospective cohort of 221 women attempting to conceive. We performed untargeted and targeted metabolomics analyses using ultrahigh-performance liquid chromatography quadrupole time-of-flight mass spectrometry. We used principal component analysis, orthogonal partial least-squares discriminant analysis, and permutation testing, coupled with univariate statistical analyses, to find metabolites associated with paraben concentration at the two time points. Potential confounders were identified with a directed acyclic graph and used to adjust results with multivariable linear regression. Metabolites were identified using fragmentation data.

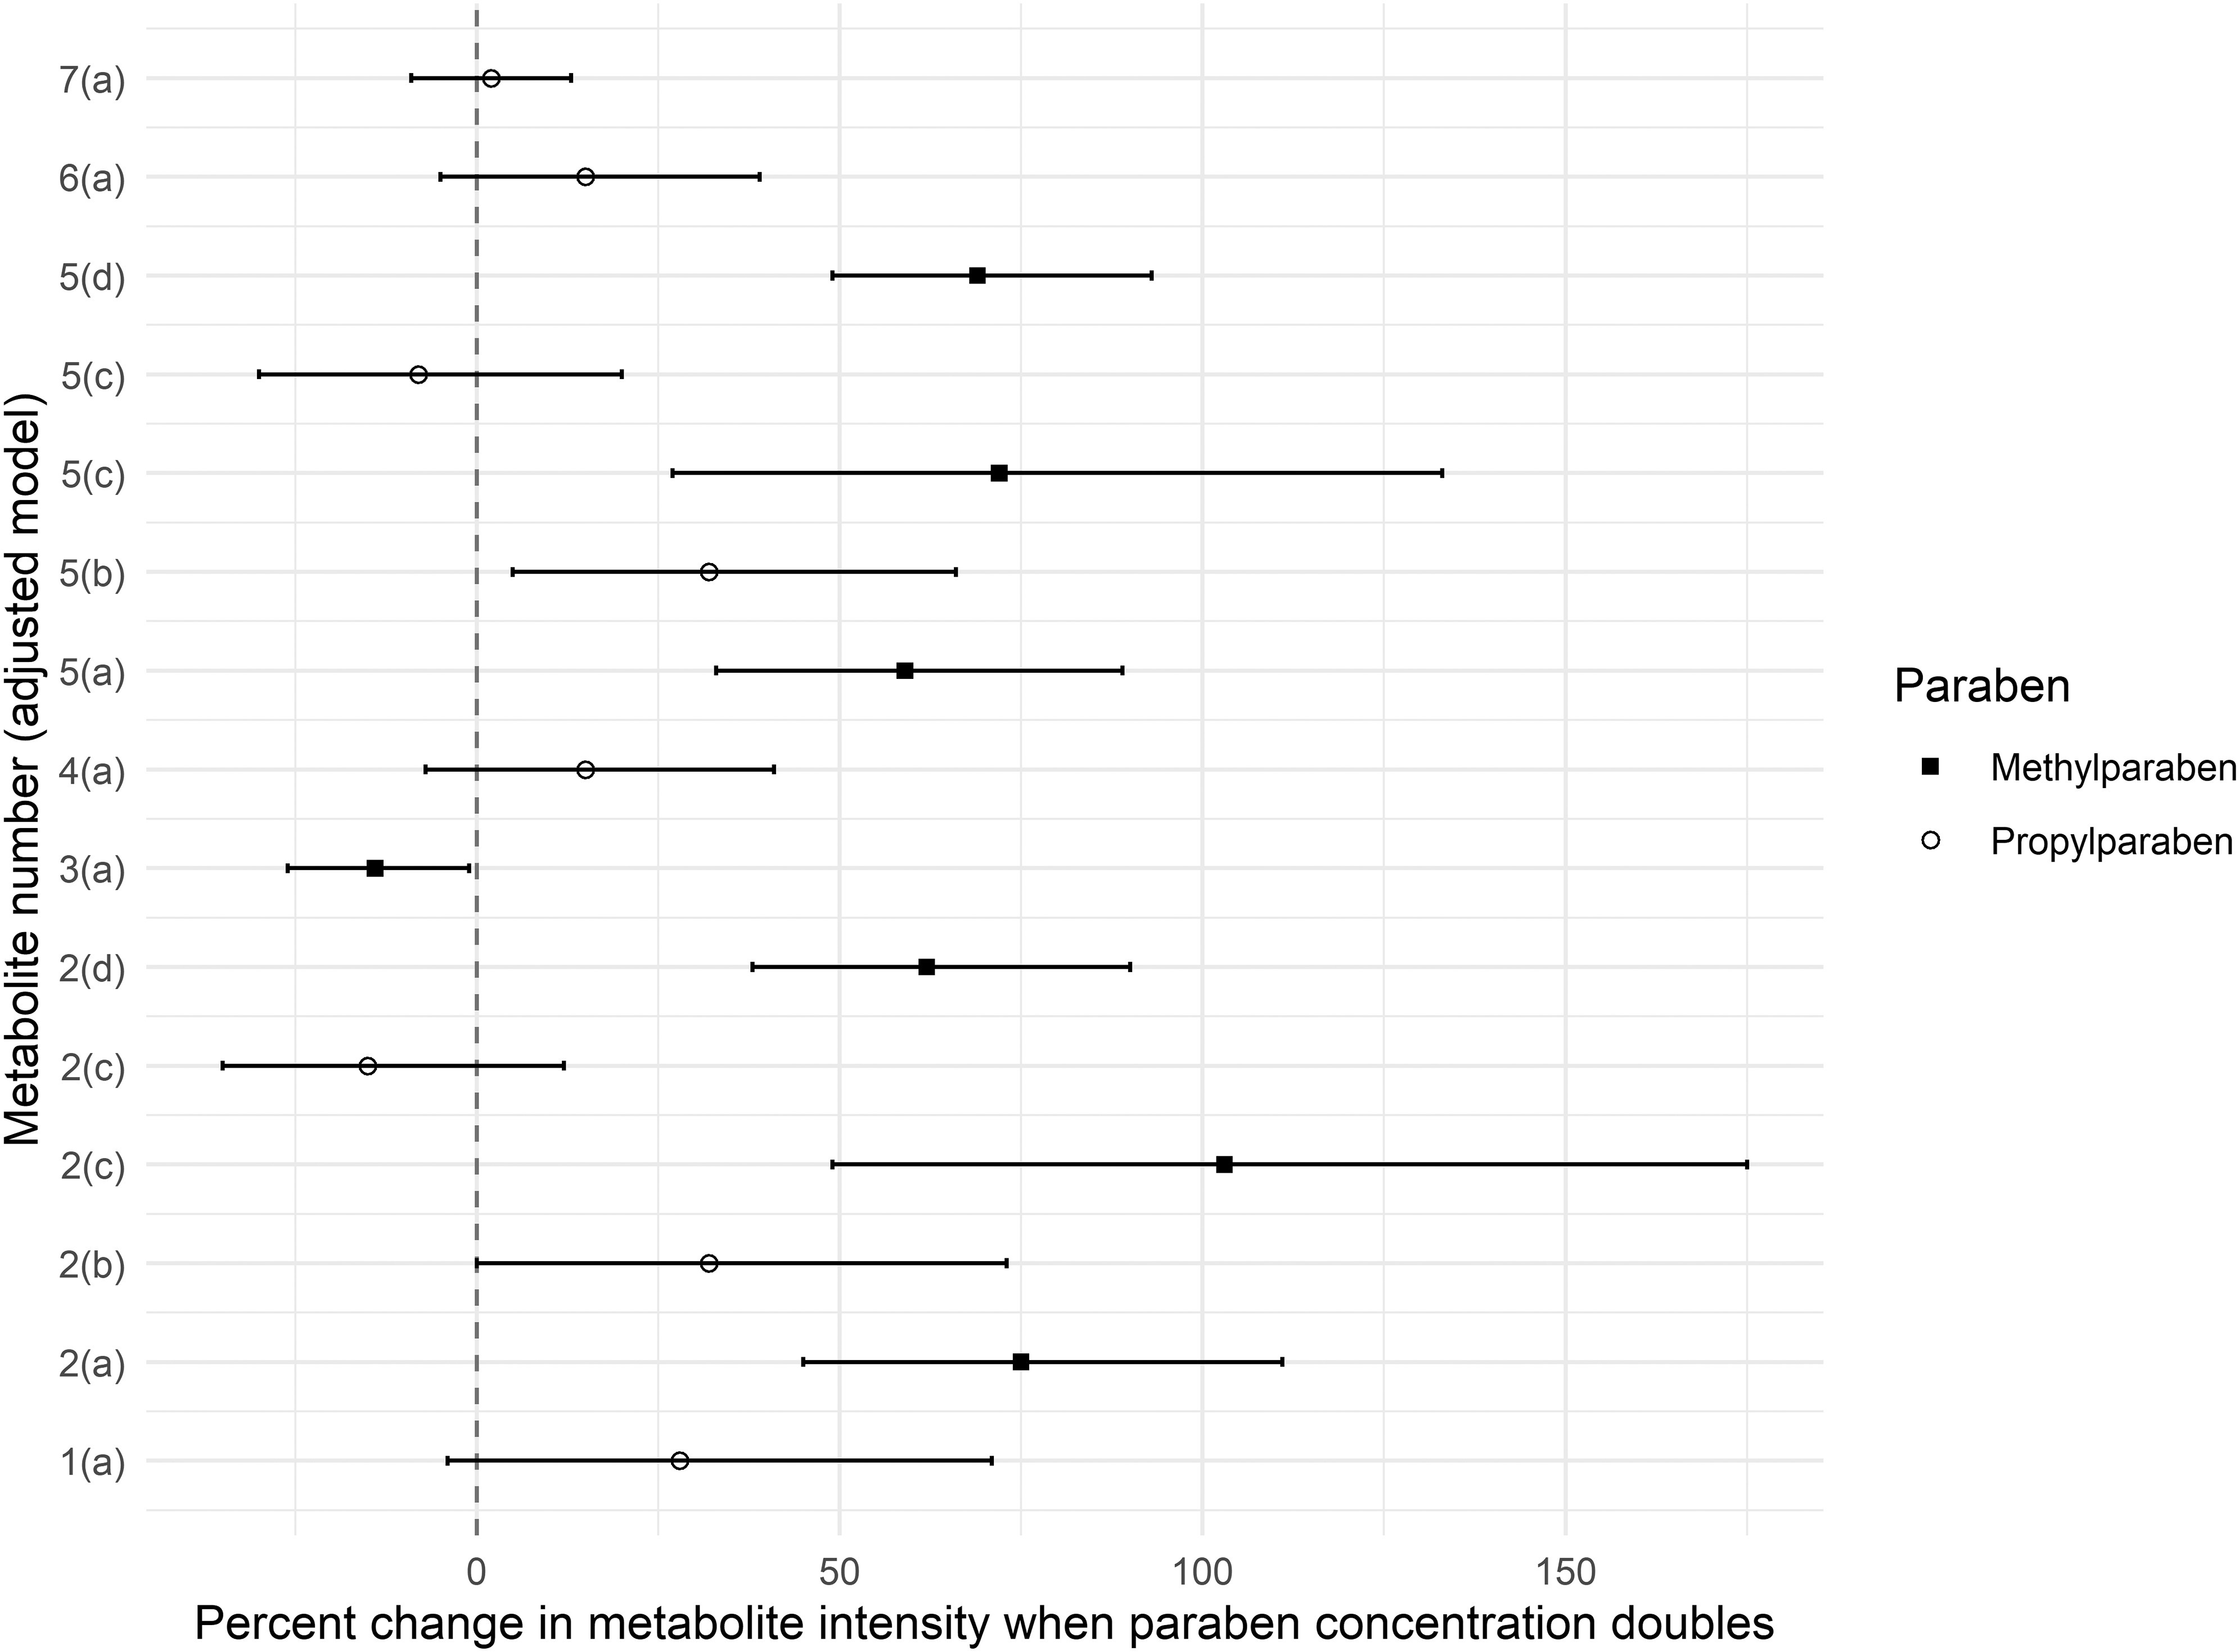
Results: Seven metabolites were associated with paraben concentration (variable importance to projection score >1, false discovery rate-corrected q-value<0.1). We identified four diet-related metabolites to the Metabolomics Standards Initiative (MSI) certainty of identification level 2, including metabolites from smoke flavoring, grapes, and olive oil. One metabolite was identified to the class level only (MSI level 3). Two metabolites were unidentified (MSI level 4). After adjustment, three metabolites remained associated with methylparaben and propylparaben, two of which were diet-related. No metabolomic markers of endocrine disruption were associated with paraben concentrations.

Discussion: This study identified novel relationships between urinary paraben concentrations and diet-related metabolites but not with metabolites on endocrine-disrupting pathways, as hypothesized. It demonstrates the feasibility of integrating untargeted metabolomics data with environmental exposure information and epidemiological adjustment for confounders. The findings underscore a potentially important connection between diet and paraben exposure, with applications to nutritional epidemiology and dietary exposure assessment. https://doi.org/10.1289/EHP12125.


Figures

Figure 1 is a flowchart showing the relationships between 18 variables, all connected by directional arrows. In the center, representing the main focus of this paper, urinary paraben concentration (nanogram per milliliter) leads to urinary metabolome (metabolite intensity). Paths through the variables represent potential sources of confounding. Most paths are adjusted for in regression models, but two are not and are bias paths, or potential sources of bias. The paths on the flowchart are as follows. Paths 1 and 2: Vitamin use leads to urinary paraben concentration (nanogram per milliliter) and urinary metabolome (metabolite intensity). Paths 3 and 4: Medication use leads to urinary paraben concentration (nanogram per milliliter) and urinary metabolome (metabolite intensity). Paths 5 and 6: Alcohol use leads to urinary paraben concentration (nanogram per milliliter) and urinary metabolome (metabolite intensity). Paths 7 and 8: Caffeine use leads to urinary paraben concentration (nanogram per milliliter) and urinary metabolome (metabolite intensity). Paths 9 and 10: Diet proxy variable (weekend versus weekday urine samples) leads to caffeine use, and caffeine use leads to urinary paraben concentration (nanogram per milliliter) and urinary metabolome (metabolite intensity). Paths 11 and 12: Diet proxy variable (weekend versus weekday urine samples) leads to alcohol use, and alcohol use leads to urinary paraben concentration (nanogram per milliliter) and urinary metabolome (metabolite intensity). Path 13: Diet proxy variable (weekend versus weekday urine samples) leads to urinary metabolome (metabolite intensity). Paths 14 and 15: Year of specimen collection leads to urinary paraben concentration (nanogram per milliliter) and urinary metabolome (metabolite intensity). Paths 16 and 17: Body mass index leads to urinary paraben concentration (nanogram per milliliter) and urinary metabolome (metabolite intensity). Path 18: Body mass index leads to exercise or physical activity, and exercise or physical activity leads to paths 40 and 41. Path 19: Income leads to diet proxy variable (weekend versus weekday urine samples), and diet proxy variable (weekend versus weekday urine samples) leads to paths 9, 10, 11, 12, and 13. Path 20: Healthcare worker leads to income, and income leads to diet proxy variable (weekend versus weekday urine samples), and diet proxy variable (weekend versus weekday urine samples) leads to paths 9, 10, 11, 12, and 13. Path 21: Education leads to healthcare worker, and healthcare worker leads to path 20. Path 22: Education leads to income, and income leads to path 19. Path 23: Education leads to personal care product use, and personal care product use leads to paths 37 and 38. Path 24: Age leads to education, and education leads to paths 21, 22, and 23. Path 25: Age leads to income, and income leads to path 19. Path 26: Age leads to urinary metabolome (metabolite intensity). Path 27: Age leads to personal care product use, and personal care product use leads to paths 37 and 38. Path 28: Season leads to personal care product use, and personal care product use leads to paths 37 and 38. Path 29: Season leads to exercise or physical activity, and exercise or physical activity leads to paths 40 and 41. Path 30: Season leads to urinary paraben concentration (nanogram per milliliter). Paths 31 and 32: Smoking leads to urinary paraben concentration (nanogram per milliliter) and urinary metabolome (metabolite intensity). Path 33: Smoking leads to personal care product use, and personal care product use leads to paths 37 and 38. Path 34: Smoking leads to exercise or physical activity, and exercise or physical activity leads to paths 40 and 41. Path 35: Marijuana leads to urinary metabolome (metabolite intensity). Path 36: Marijuana leads to personal care product use, and personal care product use leads to paths 37 and 38. Paths 37 and 38: Personal care product use leads to urinary paraben concentration (nanogram per milliliter) and urinary metabolome (metabolite intensity). Path 39: Exercise or physical activity leads to urinary metabolome (metabolite intensity). Paths 40 and 41: Exercise or physical activity leads to personal care product use, and personal care product use leads to urinary paraben concentration (nanogram per milliliter) and urinary metabolome (metabolite intensity). Bias path 1 involves personal care product use, and includes paths 37 and 38. Bias path 2 involves exercise or physical activity, and includes paths 39, 40 and 41.
Figure 1.
Directed acyclic graph showing potential confounders in the relationship between urinary paraben concentration and the urinary metabolome and bias paths remaining after adjustment. Thin green lines connecting covariates indicate that associations on those paths are blocked, and potential confounding is accounted for in regression models. Any remaining paths from urinary paraben concentration to the urinary metabolome—regardless of arrow direction—indicate possible sources of bias and are represented by thick red lines with numbers corresponding to bias paths. Bias path 1 is via personal care product use, and bias path 2 is via physical activity and personal care product use. Boxed variables are measured for study participants and included in regression models, whereas unboxed variables are neither measured for study participants nor included in regression models.
Figure 2 is a forest plot with point estimates and error bars representing 95% confidence intervals. On the y-axis, it plots the metabolite number (adjusted model letter), ranging as 1(a), 2(a), 2(b), 2(c), 2(d), 3(a), 4(a), 5(a), 5(b), 5(c), 5(d), 6(a), and 7(a). On the x-axis, for each metabolite number (adjusted model letter), it plots the percent change in metabolite intensity when paraben concentration doubles, ranging from -25 to 175, including methylparaben and propylparaben.
Figure 2.
Percent change in metabolite intensity associated with a doubling of urinary paraben concentration (ng/mL, specific gravity–adjusted) after adjustment for confounding using multivariable linear regression in 42 participants in the Early Pregnancy Study. Error bars represent 95% confidence intervals. Metabolite numbers (1–7) correspond to the metabolites described in Table 4, and model letters (a–d) correspond to adjusted models summarized in Table 5, with full model results found in Table S4. Covariates used for adjustment can be visualized in Figure 1 and are also listed in Table 2. Data for this figure are from Table 5.

Similar articles

Cited by

References

    1. Karpuzoglu E, Holladay SD, Gogal RM Jr.. 2013. Parabens: potential impact of low-affinity estrogen receptor binding chemicals on human health. J Toxicol Env Heal B Crit Rev 16(5):321–335, 10.1080/10937404.2013.809252. - DOI - PubMed
    1. Calafat AM, Ye X, Wong LY, Bishop AM, Needham LL. 2010. Urinary concentrations of four parabens in the U.S. population: NHANES 2005–2006. Environ Health Perspect 118(5):679–685, PMID: , 10.1289/ehp.0901560. - DOI - PMC - PubMed
    1. Anderson FA. 2008. Final Amended Report on the Safety Assessment of Methylparaben, ethylparaben, propylparaben, isopropylparaben, butylparaben, isobutylparaben, and benzylparaben as used in cosmetic products. Int J Toxicol 27 (suppl 4):1–82, PMID: , 10.1080/10915810802548359. - DOI - PubMed
    1. Vandenberg LN, Bugos J. 2021. Assessing the public health implications of the food preservative propylparaben: has this chemical been safely used for decades. Curr Environ Health Rep 8(1):54–70, PMID: , 10.1007/s40572-020-00300-6. - DOI - PubMed
    1. Meeker JD, Cantonwine DE, Rivera-González LO, Ferguson KK, Mukherjee B, Calafat AM, et al. . 2013. Distribution, variability, and predictors of urinary concentrations of phenols and parabens among pregnant women in Puerto Rico. Environ Sci Technol 47(7):3439–3447, PMID: , 10.1021/es400510g. - DOI - PMC - PubMed

Publication types

LinkOut - more resources