. 2023 Dec 1;83(23):3901-3919.
doi: 10.1158/0008-5472.CAN-22-2350.

CK1δ and CK1ε Signaling Sustains Mitochondrial Metabolism and Cell Survival in Multiple Myeloma

Affiliations

CK1δ and CK1ε Signaling Sustains Mitochondrial Metabolism and Cell Survival in Multiple Myeloma

Karen L Burger et al. Cancer Res. .

Abstract

Multiple myeloma remains an incurable malignancy due to acquisition of intrinsic programs that drive therapy resistance. Here we report that casein kinase-1δ (CK1δ) and CK1ε are therapeutic targets in multiple myeloma that are necessary to sustain mitochondrial metabolism. Specifically, the dual CK1δ/CK1ε inhibitor SR-3029 had potent in vivo and ex vivo anti-multiple myeloma activity, including against primary multiple myeloma patient specimens. RNA sequencing (RNA-seq) and metabolic analyses revealed inhibiting CK1δ/CK1ε disables multiple myeloma metabolism by suppressing genes involved in oxidative phosphorylation (OxPhos), reducing citric acid cycle intermediates, and suppressing complexes I and IV of the electron transport chain. Finally, sensitivity of multiple myeloma patient specimens to SR-3029 correlated with elevated expression of mitochondrial genes, and RNA-seq from 687 multiple myeloma patient samples revealed that increased CSNK1D, CSNK1E, and OxPhos genes correlate with disease progression and inferior outcomes. Thus, increases in mitochondrial metabolism are a hallmark of multiple myeloma progression that can be disabled by targeting CK1δ/CK1ε.

Significance: CK1δ and CK1ε are attractive therapeutic targets in multiple myeloma whose expression increases with disease progression and connote poor outcomes, and that are necessary to sustain expression of genes directing OxPhos.


Figures

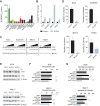
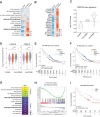
Figure 1. Pharmacoproteomic screen to identify novel antimyeloma kinase targets. A, Experimental design of activity-based protein profiling of three multiple myeloma cell lines (H929, OPM2, and MM.1S) in the absence or presence of cocultured HS-5 stromal cells after 24 hours. B, Venn diagram illustrating overlap of kinases whose activity is significantly altered by coculture of multiple myeloma cells with stromal cells. C, Heat map depicting the fold change in the activity of ABPP target proteins in each of the three multiple myeloma cell lines [note that CK1δ and CK1ε (red) proteins could not be differentiated by peptide sequence in ABPP]. Log2 ratio of coculture to monoculture is presented. D, Bar graphs of sensitivity of H929, MM.1S, and OPM2 cell lines (EC50) cultured on stroma to a panel of protein kinase inhibitors (at 96 hours).
Figure 1.
Pharmacoproteomic screen to identify novel antimyeloma kinase targets. A, Experimental design of activity-based protein profiling of three multiple myeloma cell lines (H929, OPM2, and MM.1S) in the absence or presence of cocultured HS-5 stromal cells after 24 hours. B, Venn diagram illustrating overlap of kinases whose activity is significantly altered by coculture of multiple myeloma cells with stromal cells. C, Heat map depicting the fold change in the activity of ABPP target proteins in each of the three multiple myeloma cell lines [note that CK1δ and CK1ε (red) proteins could not be differentiated by peptide sequence in ABPP]. Log2 ratio of coculture to monoculture is presented. D, Bar graphs of sensitivity of H929, MM.1S, and OPM2 cell lines (EC50) cultured on stroma to a panel of protein kinase inhibitors (at 96 hours).
Figure 2. Inhibition of CK1δ/CK1ε provokes myeloma cell death. A, EC50 of SR-3029 in a panel of treatment-naïve and matched isogenic drug-resistant multiple myeloma cell lines. Potency was assessed using an MTT assay (at 72 hours). B, Fold change in caspase-3/7 activity in the indicated multiple myeloma cell lines after 24-hour treatment with vehicle (black) or 250 nmol/L SR-3029 (blue). All data are plotted as the fold change from vehicle control and are the average ± SD from three independent experiments. Statistical analysis of caspase-3/7 activity was done using multiple t test. **, P ≤ 0.01; ***, P ≤ 0.001; ****, P ≤ 0.0001. C, Immunoblots of 8226, MM.1S, and STGM1 cells of total and cleaved PARP after treatment with vehicle or increasing doses (31.25 nmol/L, 62.5 nmol/L, 125 nmol/L, 250 nmol/L) of SR-3029 (at 24 hours). D, Colony-forming potential of multiple myeloma cell lines treated with vehicle (black) or 250 nmol/L SR-3029 (blue) in MethoCult media. Bar graphs are representative data from one of three separate experiments. Error bars, SD. Statistical analysis was performed using a Student t test. *, P ≤ 0.05; **, P ≤ 0.01; ***, P ≤ 0.001. E, 8226 and MM.1S multiple myeloma cells expressing doxycycline-inducible CK1δ, CK1ε, or nontargeting (NT) shRNAs were treated with vehicle or 1 μg/mL doxycycline for 96 hours and immunoblot analysis was performed to confirm knockdown. F, Number of viable cells at 96 hours was measured by Trypan blue dye exclusion. Data are plotted as the percent of relative live cells for vehicle controls and are the averages, and SD are from three independent experiments. Statistical comparisons between vehicle control and doxycycline-treated cells were performed using an one-way ANOVA with multiple comparisons. **, P ≤ 0.01; ****, P ≤ 0.0001. G, Colony-forming potential of 8226 and MM.1S cells expressing doxycycline-inducible CK1δ, CK1ε, or nontargeting shRNA treated for 72 hours with vehicle or 1 μg/mL doxycycline before plating in MethoCult media containing the vehicle or 1 μg/mL doxycycline. Bar graphs are representative of one of two separate experiments with three technical replicates. Statistical comparisons between vehicle control and doxycycline-treated cell were performed using an one-way ANOVA with multiple comparisons. *, P ≤ 0.05; **, P ≤ 0.01.
Figure 2.
Inhibition of CK1δ/CK1ε provokes myeloma cell death. A, EC50 of SR-3029 in a panel of treatment-naïve and matched isogenic drug-resistant multiple myeloma cell lines. Potency was assessed using an MTT assay (at 72 hours). B, Fold change in caspase-3/7 activity in the indicated multiple myeloma cell lines after 24-hour treatment with vehicle (black) or 250 nmol/L SR-3029 (blue). All data are plotted as the fold change from vehicle control and are the average ± SD from three independent experiments. Statistical analysis of caspase-3/7 activity was done using multiple t test. **, P ≤ 0.01; ***, P ≤ 0.001; ****, P ≤ 0.0001. C, Immunoblots of 8226, MM.1S, and STGM1 cells of total and cleaved PARP after treatment with vehicle or increasing doses (31.25 nmol/L, 62.5 nmol/L, 125 nmol/L, 250 nmol/L) of SR-3029 (at 24 hours). D, Colony-forming potential of multiple myeloma cell lines treated with vehicle (black) or 250 nmol/L SR-3029 (blue) in MethoCult media. Bar graphs are representative data from one of three separate experiments. Error bars, SD. Statistical analysis was performed using a Student t test. *, P ≤ 0.05; **, P ≤ 0.01; ***, P ≤ 0.001. E, 8226 and MM.1S multiple myeloma cells expressing doxycycline-inducible CK1δ, CK1ε, or nontargeting (NT) shRNAs were treated with vehicle or 1 μg/mL doxycycline for 96 hours and immunoblot analysis was performed to confirm knockdown. F, Number of viable cells at 96 hours was measured by Trypan blue dye exclusion. Data are plotted as the percent of relative live cells for vehicle controls and are the averages, and SD are from three independent experiments. Statistical comparisons between vehicle control and doxycycline-treated cells were performed using an one-way ANOVA with multiple comparisons. **, P ≤ 0.01; ****, P ≤ 0.0001. G, Colony-forming potential of 8226 and MM.1S cells expressing doxycycline-inducible CK1δ, CK1ε, or nontargeting shRNA treated for 72 hours with vehicle or 1 μg/mL doxycycline before plating in MethoCult media containing the vehicle or 1 μg/mL doxycycline. Bar graphs are representative of one of two separate experiments with three technical replicates. Statistical comparisons between vehicle control and doxycycline-treated cell were performed using an one-way ANOVA with multiple comparisons. *, P ≤ 0.05; **, P ≤ 0.01.
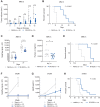
Figure 3. Targeting CK1δ/CK1ε suppresses the tumorigenic potential of myeloma. A and B, NSG recipient mice were inoculated subcutaneously on bilateral flanks with MM.1S multiple myeloma cells. Once tumors were palpable, recipient mice were randomized and treated daily intraperitoneally with either vehicle (gray; n = 20) or 20 mg/kg SR-3029 (blue; n = 20) daily, and monitored for tumor burden (A) by caliper measurements and overall survival (B). Statistical analysis was performed using a two-way ANOVA for flank tumors and a Mantel–Cox log-rank test for survival. ***, P ≤ 0.001; ****, P ≤ 0.0001. C–E, To account for aspects of the BM microenvironment, NSG mice were inoculated via the tail vein with human MM.1S-luc cells. After 7 days (when disease was evident by IVIS imaging), recipient mice were randomized and treated daily with vehicle (n = 10) or 20 mg/kg SR-3029 (n = 10) daily and were assessed for tumor burden by IVIS imaging (C) and circulating serum paraprotein (human λ; D) levels by ELISA, and effects on overall survival (E) was determined. Statistical analysis was performed using a two-way ANOVA for IVIS imaging, a paired t test for paraprotein values, and a Mantel–Cox log-rank test for survival. *, P ≤ 0.05; ****, P ≤ 0.0001. F–H, C57BL/KaLwRijHsd mice were inoculated with 5TGM1-luc myeloma cells via tail vein injection. After disease was evident (day 14), mice were randomized and treated daily with either vehicle (n = 10) or 20 mg/kg SR-3029 (n = 10) and were monitored for tumor burden by bioluminescence (F) and serum paraprotein (IgG2b; G), and overall survival (H). Statistical analysis was performed using a two-way ANOVA for IVIS imaging, a multiple t test for paraprotein values, and a Mantel–Cox log-rank test for survival. **, P ≤ 0.01.
Figure 3.
Targeting CK1δ/CK1ε suppresses the tumorigenic potential of myeloma. A and B, NSG recipient mice were inoculated subcutaneously on bilateral flanks with MM.1S multiple myeloma cells. Once tumors were palpable, recipient mice were randomized and treated daily intraperitoneally with either vehicle (gray; n = 20) or 20 mg/kg SR-3029 (blue; n = 20) daily, and monitored for tumor burden (A) by caliper measurements and overall survival (B). Statistical analysis was performed using a two-way ANOVA for flank tumors and a Mantel–Cox log-rank test for survival. ***, P ≤ 0.001; ****, P ≤ 0.0001. C–E, To account for aspects of the BM microenvironment, NSG mice were inoculated via the tail vein with human MM.1S-luc cells. After 7 days (when disease was evident by IVIS imaging), recipient mice were randomized and treated daily with vehicle (n = 10) or 20 mg/kg SR-3029 (n = 10) daily and were assessed for tumor burden by IVIS imaging (C) and circulating serum paraprotein (human λ; D) levels by ELISA, and effects on overall survival (E) was determined. Statistical analysis was performed using a two-way ANOVA for IVIS imaging, a paired t test for paraprotein values, and a Mantel–Cox log-rank test for survival. *, P ≤ 0.05; ****, P ≤ 0.0001. F–H, C57BL/KaLwRijHsd mice were inoculated with 5TGM1-luc myeloma cells via tail vein injection. After disease was evident (day 14), mice were randomized and treated daily with either vehicle (n = 10) or 20 mg/kg SR-3029 (n = 10) and were monitored for tumor burden by bioluminescence (F) and serum paraprotein (IgG2b; G), and overall survival (H). Statistical analysis was performed using a two-way ANOVA for IVIS imaging, a multiple t test for paraprotein values, and a Mantel–Cox log-rank test for survival. **, P ≤ 0.01.
Figure 4. Inhibition of CK1δ/CK1ε disrupts central metabolic pathways in multiple myeloma patient samples. A, Ex vivo sensitivity of patient CD138+-selected cells to SR-3029 versus a panel of standard-of-care anti–multiple myeloma therapies, as measured by live-cell imaging. Each dot represents sensitivity [lethal dose (LD)50, amount of drug needed to cause lethality in 50% of patient samples] for a given patient sample after 96 hours of treatment. Only patients with measurable LD50 are graphed. Ex vivo responses (achieved LD50 at 96 hours) were as follows: SR-3029 74/75; bortezomib (BTZ) 271/273; carfilzomib (CFZ) 259/263; lenalidomide [Len0 4/203; pomalidomide (Pom) 10/288; dexamethasone (Dex) 17/216; melphalan (Mel) 216/240]. B and C, Ex vivo sensitivity of patient CD138+-selected multiple myeloma cells to SR-3029 versus a panel of kinase inhibitors after 96 hours of treatment (B). Number of patient samples that achieved an ex vivo response (LD50 at 96 hours) out of the total number of samples tested (C) is shown. D, Ex vivo sensitivity of patients to SR-3029 based on clinical course. NDMM prior to therapy (n = 26); early RRMM, early relapse refractory multiple myeloma patients resistant to 1–3 lines of therapy (n = 31); late RRMM, late relapse refractory resistant to ≥4 lines of therapy (n = 34). Statistical comparisons between clinical course were calculated using a one-way ANOVA with multiple comparisons. E–G, CD138+-derived multiple myeloma cells from 5 patients were cultured in the top well Boyden chamber with patient BM-derived stroma in the bottom well. Cells were incubated for 24 hours with vehicle or 250 nmol/L SR-3029 and cells were harvested for RNA-seq analyses. E, Heat map of 1,162 differently expressed genes from the patient RNA-seq data. F, GSEA HALLMARK pathway analysis (q < 0.01) of genes downregulated by SR-3029. G, DAVID pathway analysis of genes downregulated by SR-3029 ex vivo.
Figure 4.
Inhibition of CK1δ/CK1ε disrupts central metabolic pathways in multiple myeloma patient samples. A,Ex vivo sensitivity of patient CD138+-selected cells to SR-3029 versus a panel of standard-of-care anti–multiple myeloma therapies, as measured by live-cell imaging. Each dot represents sensitivity [lethal dose (LD)50, amount of drug needed to cause lethality in 50% of patient samples] for a given patient sample after 96 hours of treatment. Only patients with measurable LD50 are graphed. Ex vivo responses (achieved LD50 at 96 hours) were as follows: SR-3029 74/75; bortezomib (BTZ) 271/273; carfilzomib (CFZ) 259/263; lenalidomide [Len0 4/203; pomalidomide (Pom) 10/288; dexamethasone (Dex) 17/216; melphalan (Mel) 216/240]. B and C,Ex vivo sensitivity of patient CD138+-selected multiple myeloma cells to SR-3029 versus a panel of kinase inhibitors after 96 hours of treatment (B). Number of patient samples that achieved an ex vivo response (LD50 at 96 hours) out of the total number of samples tested (C) is shown. D,Ex vivo sensitivity of patients to SR-3029 based on clinical course. NDMM prior to therapy (n = 26); early RRMM, early relapse refractory multiple myeloma patients resistant to 1–3 lines of therapy (n = 31); late RRMM, late relapse refractory resistant to ≥4 lines of therapy (n = 34). Statistical comparisons between clinical course were calculated using a one-way ANOVA with multiple comparisons. E–G, CD138+-derived multiple myeloma cells from 5 patients were cultured in the top well Boyden chamber with patient BM-derived stroma in the bottom well. Cells were incubated for 24 hours with vehicle or 250 nmol/L SR-3029 and cells were harvested for RNA-seq analyses. E, Heat map of 1,162 differently expressed genes from the patient RNA-seq data. F, GSEA HALLMARK pathway analysis (q < 0.01) of genes downregulated by SR-3029. G, DAVID pathway analysis of genes downregulated by SR-3029 ex vivo.
Figure 5. Inhibition of CK1δ/CK1ε disables myeloma mitochondrial metabolism. A, RNA-seq analysis of MM.1S and 8226 multiple myeloma cell lines treated with vehicle versus 250 nmol/L SR-3029 (for 8 or 24 hours; n = 3) based on genes identified as being significantly altered by SR-3029 treatment in multiple myeloma patient samples (see Fig. 4E). B–E, Seahorse XFe analysis of oxygen consumption rate (OCR) of MM.1S (B and C) or 8226 (D and E) myeloma cells treated for 8 or 24 hours with vehicle versus 250 nmol/L SR-3029. C and E, Quantification of basal respiration. The values of detection for all Seahorse experiments are represented as the mean and SD (6 replicates per group). Statistical calculations for basal respiration were performed using one-way ANOVA analysis compared with vehicle control. ****, P ≤ 0.0001. F and G, OCR of MM.1S (F) and 8226 (G) cells expressing nontargeting, CK1δ, or CK1ε targeting shRNAs treated for 96 hours with vehicle or 1 μg/mL doxycycline. Data represent mean and SD from three independent experiments (n = 6/group). Statistical calculations for basal respiration were performed using one-way ANOVA analysis compared with vehicle-treated cells. **, P ≤ 0.01; ****, P ≤ 0.0001. H and I, Quantification of the effects of SR-3029 treatment on basal glycolysis for MM.1S (H) or 8226 (I) myeloma cells treated for 8 or 24 hours with vehicle versus 250 nmol/L SR-3029. Statistical calculations for basal glycolysis were performed using one-way ANOVA analysis compared with vehicle control. ***, P ≤ 0.001; ****, P ≤ 0.0001. J, Mitochondrial ATP production of 8226 myeloma cells treated for 8 or 24 hours with vehicle or 250 nmol/L SR-3029. Statistical calculations for mitochondrial ATP production were performed using one-way ANOVA analysis compared with vehicle control. ****, P < 0.0001. The values are represented as the mean and SD from three independent experiments (n = 6/group). K, 8226 multiple myeloma cells were treated for 24 hours with vehicle or 250 nmol/L SR-3029 and then analyzed by flow cytometry following staining with MitoTracker CMXRos to assess mitochondrial membrane polarization (n = 3). Statistical analysis was performed by two-way ANOVA analysis compared with vehicle control. ****, P < 0.0001.
Figure 5.
Inhibition of CK1δ/CK1ε disables myeloma mitochondrial metabolism. A, RNA-seq analysis of MM.1S and 8226 multiple myeloma cell lines treated with vehicle versus 250 nmol/L SR-3029 (for 8 or 24 hours; n = 3) based on genes identified as being significantly altered by SR-3029 treatment in multiple myeloma patient samples (see Fig. 4E). B–E, Seahorse XFe analysis of oxygen consumption rate (OCR) of MM.1S (B and C) or 8226 (D and E) myeloma cells treated for 8 or 24 hours with vehicle versus 250 nmol/L SR-3029. C and E, Quantification of basal respiration. The values of detection for all Seahorse experiments are represented as the mean and SD (6 replicates per group). Statistical calculations for basal respiration were performed using one-way ANOVA analysis compared with vehicle control. ****, P ≤ 0.0001. F and G, OCR of MM.1S (F) and 8226 (G) cells expressing nontargeting, CK1δ, or CK1ε targeting shRNAs treated for 96 hours with vehicle or 1 μg/mL doxycycline. Data represent mean and SD from three independent experiments (n = 6/group). Statistical calculations for basal respiration were performed using one-way ANOVA analysis compared with vehicle-treated cells. **, P ≤ 0.01; ****, P ≤ 0.0001. H and I, Quantification of the effects of SR-3029 treatment on basal glycolysis for MM.1S (H) or 8226 (I) myeloma cells treated for 8 or 24 hours with vehicle versus 250 nmol/L SR-3029. Statistical calculations for basal glycolysis were performed using one-way ANOVA analysis compared with vehicle control. ***, P ≤ 0.001; ****, P ≤ 0.0001. J, Mitochondrial ATP production of 8226 myeloma cells treated for 8 or 24 hours with vehicle or 250 nmol/L SR-3029. Statistical calculations for mitochondrial ATP production were performed using one-way ANOVA analysis compared with vehicle control. ****, P < 0.0001. The values are represented as the mean and SD from three independent experiments (n = 6/group). K, 8226 multiple myeloma cells were treated for 24 hours with vehicle or 250 nmol/L SR-3029 and then analyzed by flow cytometry following staining with MitoTracker CMXRos to assess mitochondrial membrane polarization (n = 3). Statistical analysis was performed by two-way ANOVA analysis compared with vehicle control. ****, P < 0.0001.
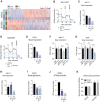
Figure 6. Disabling CK1δ/CK1ε signaling impairs myeloma mitochondrial function via suppression of the TCA cycle and the ETC. A and B, Heat maps depicting log2 ratio for metabolites in the TCA cycle in MM.1S (A) and 8226 (B) myeloma cells treated for 8 or 24 hours with vehicle or 250 nmol/L SR-3029. C, Gene expression of GO: Mitochondrion genes from RNA-seq data for MM.1S and 8226 myeloma cells treated with vehicle or 250 nmol/L SR-3029 for 24 hours. D, Log2-fold change in expression of OGDH in ex vivo multiple myeloma patient samples treated with vehicle versus SR-3029; data are plotted relative to vehicle-treated cells, dashed line. E–H, OCR was measured in MM.1S and 8226 myeloma cells that were pretreated for 24 hours with vehicle, 125 nmol/L SR-3029, or 250 nmol/L SR-3029 and cultured in modified RPMI (Seahorse Biosciences) containing glutamate, malate, and pyruvate before adding succinate to inhibit complex I activity, and ascorbate plus TMPD to activate complex IV. Statistical calculations for complex activity were performed using one-way ANOVA analysis compared with vehicle. ***, P ≤ 0.001; ****, P ≤ 0.0001. The values of detection are represented as the mean and SD (n = 6/group). I, Log2-fold change in expression of complex I components in ex vivo multiple myeloma patient samples treated with vehicle versus SR-3029; data are plotted relative to vehicle-treated cells, dashed line.
Figure 6.
Disabling CK1δ/CK1ε signaling impairs myeloma mitochondrial function via suppression of the TCA cycle and the ETC. A and B, Heat maps depicting log2 ratio for metabolites in the TCA cycle in MM.1S (A) and 8226 (B) myeloma cells treated for 8 or 24 hours with vehicle or 250 nmol/L SR-3029. C, Gene expression of GO: Mitochondrion genes from RNA-seq data for MM.1S and 8226 myeloma cells treated with vehicle or 250 nmol/L SR-3029 for 24 hours. D, Log2-fold change in expression of OGDH in ex vivo multiple myeloma patient samples treated with vehicle versus SR-3029; data are plotted relative to vehicle-treated cells, dashed line. E–H, OCR was measured in MM.1S and 8226 myeloma cells that were pretreated for 24 hours with vehicle, 125 nmol/L SR-3029, or 250 nmol/L SR-3029 and cultured in modified RPMI (Seahorse Biosciences) containing glutamate, malate, and pyruvate before adding succinate to inhibit complex I activity, and ascorbate plus TMPD to activate complex IV. Statistical calculations for complex activity were performed using one-way ANOVA analysis compared with vehicle. ***, P ≤ 0.001; ****, P ≤ 0.0001. The values of detection are represented as the mean and SD (n = 6/group). I, Log2-fold change in expression of complex I components in ex vivo multiple myeloma patient samples treated with vehicle versus SR-3029; data are plotted relative to vehicle-treated cells, dashed line.
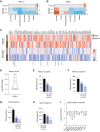
Figure 7. Increased expression of CSNK1D, CSNK1E, OxPhos, and mitochondrion signature genes are hallmarks of disease progression and connote poor outcomes in multiple myeloma. A, Heat map of mean ssGSEA of hallmark signatures across 687 (CD138+) multiple myeloma patient samples having indicated stages of clinical disease progression. B, Heat map shows average log2 expression of OxPhos hallmark genes that are downregulated by ex vivo SR-3029 treatment in multiple myeloma from patients (Fig. 4F) as a function of multiple myeloma disease state. C, The average log2 expression of the mean individual gene in the individual sample of SR-3029–associated OxPhos genes as a function of multiple myeloma disease state, z-normalized to the expression values across all multiple myeloma samples, was analyzed. D, Box plots depicting CSNK1D and CSNK1E log2 z-normalized expression for patients at the indicated clinical stage. Each symbol represents expression of an individual patient sample. **, P ≤ 0.01; ***, P ≤ 0.001. E and F, Clinical outcomes for 483 patients with multiple myeloma based on CSNK1D (E) or CSNK1E (F) expression. Patient cohorts were divided into tertiles based on gene expression level and a log-rank test for trend was conducted. CSNK1D median survival: top tertile, 2.3 years; middle tertile, 3.4 years; bottom tertile, 3.6 years. CSNK1E median survival: top tertile, 2.0 years; middle tertile, 3.6 years; bottom tertile, 3.4 years. G, GSEA was performed on paired RNA-seq data from CD138+-selected cells from the 74/75 multiple myeloma patient biopsies that showed ex vivo sensitivity to SR-3029. Nominal enrichment scores based on patient sample sensitivity to SR-3029 are shown for hallmarks with a nominal P < 0.05 and FDR q < 0.1. H, Enrichment plot from GSEA of correlations between SR-3029 resistance (high to low as measured by AUC from EMMA analysis, red to blue, respectively) and expression of genes in the GO: Mitochondrion signature (black bars). I, Overall survival for patients based on their nominal enrichment score for the GO: Mitochondrion signature. Only patients with a nominal P < 0.05 and FDR q < 0.1 were included in the survival analysis.
Figure 7.
Increased expression of CSNK1D, CSNK1E, OxPhos, and mitochondrion signature genes are hallmarks of disease progression and connote poor outcomes in multiple myeloma. A, Heat map of mean ssGSEA of hallmark signatures across 687 (CD138+) multiple myeloma patient samples having indicated stages of clinical disease progression. B, Heat map shows average log2 expression of OxPhos hallmark genes that are downregulated by ex vivo SR-3029 treatment in multiple myeloma from patients (Fig. 4F) as a function of multiple myeloma disease state. C, The average log2 expression of the mean individual gene in the individual sample of SR-3029–associated OxPhos genes as a function of multiple myeloma disease state, z-normalized to the expression values across all multiple myeloma samples, was analyzed. D, Box plots depicting CSNK1D and CSNK1E log2 z-normalized expression for patients at the indicated clinical stage. Each symbol represents expression of an individual patient sample. **, P ≤ 0.01; ***, P ≤ 0.001. E and F, Clinical outcomes for 483 patients with multiple myeloma based on CSNK1D (E) or CSNK1E (F) expression. Patient cohorts were divided into tertiles based on gene expression level and a log-rank test for trend was conducted. CSNK1D median survival: top tertile, 2.3 years; middle tertile, 3.4 years; bottom tertile, 3.6 years. CSNK1E median survival: top tertile, 2.0 years; middle tertile, 3.6 years; bottom tertile, 3.4 years. G, GSEA was performed on paired RNA-seq data from CD138+-selected cells from the 74/75 multiple myeloma patient biopsies that showed ex vivo sensitivity to SR-3029. Nominal enrichment scores based on patient sample sensitivity to SR-3029 are shown for hallmarks with a nominal P < 0.05 and FDR q < 0.1. H, Enrichment plot from GSEA of correlations between SR-3029 resistance (high to low as measured by AUC from EMMA analysis, red to blue, respectively) and expression of genes in the GO: Mitochondrion signature (black bars). I, Overall survival for patients based on their nominal enrichment score for the GO: Mitochondrion signature. Only patients with a nominal P < 0.05 and FDR q < 0.1 were included in the survival analysis.

References

    1. Palumbo A, Anderson K. Multiple myeloma. N Engl J Med 2011;364:1046–60. - PubMed
    1. Durie BGM, Hoering A, Abidi MH, Rajkumar SV, Epstein J, Kahanic SP, et al. Bortezomib with lenalidomide and dexamethasone versus lenalidomide and dexamethasone alone in patients with newly diagnosed myeloma without intent for immediate autologous stem-cell transplant (SWOG S0777): a randomised, open-label, phase 3 trial. Lancet 2017;389:519–27. - PMC - PubMed
    1. Dimopoulos MA, Moreau P, Palumbo A, Joshua D, Pour L, Hajek R, et al. Carfilzomib and dexamethasone versus bortezomib and dexamethasone for patients with relapsed or refractory multiple myeloma (ENDEAVOR): a randomised, phase 3, open-label, multicentre study. Lancet Oncol 2016;17:27–38. - PubMed
    1. San-Miguel JF, Hungria VT, Yoon SS, Beksac M, Dimopoulos MA, Elghandour A, et al. Overall survival of patients with relapsed multiple myeloma treated with panobinostat or placebo plus bortezomib and dexamethasone (the PANORAMA 1 trial): a randomised, placebo-controlled, phase 3 trial. Lancet Haematol 2016;3:e506–e15. - PubMed
    1. Chen C, Siegel D, Gutierrez M, Jacoby M, Hofmeister CC, Gabrail N, et al. Safety and efficacy of selinexor in relapsed or refractory multiple myeloma and Waldenstrom macroglobulinemia. Blood 2018;131:855–63. - PubMed

Publication types

Substances