. 2023 Nov 1;211(9):1376-1384.
doi: 10.4049/jimmunol.2200809.

TGF-β Promotes the Postselection Thymic Development and Peripheral Function of IFN-γ-Producing Invariant NKT cells

Affiliations

TGF-β Promotes the Postselection Thymic Development and Peripheral Function of IFN-γ-Producing Invariant NKT cells

Roxroy C Morgan et al. J Immunol. .

Abstract

IFN-γ-producing invariant NKT (iNKT)1 cells are lipid-reactive innate-like lymphocytes that are resident in the thymus and peripheral tissues where they protect against pathogenic infection. The thymic functions of iNKT1 cells are not fully elucidated, but subsets of thymic iNKT cells modulate CD8 T cell, dendritic cell, B cell, and thymic epithelial cell numbers or function. In this study, we show that a subset of murine thymic iNKT1 cells required TGF-β-induced signals for their postselection development, to maintain hallmark TGF-β-induced genes, and for expression of the adhesion receptors CD49a and CD103. However, the residency-associated receptor CD69 was not TGF-β signaling-dependent. Recently described CD244+ c2 thymic iNKT1 cells, which produce IFN-γ without exogenous stimulation and have NK-like characteristics, reside in this TGF-β-responsive population. Liver and spleen iNKT1 cells do not share this TGF-β gene signature, but nonetheless TGF-β impacts liver iNKT1 cell phenotype and function. Our findings provide insight into the heterogeneity of mechanisms guiding iNKT1 cell development in different tissues and suggest a close association between a subset of iNKT1 cells and TGF-β-producing cells in the thymus that support their development.


Figures

FIGURE 1:
FIGURE 1:
Validation of the Tbx21Cre mouse and analysis of RNA-seq data. Flow cytometry analysis of NKT cells from the thymus, liver, and spleen of Tbx21Cre;Rosa26-stop-flox-YFP mice. iNKT cells were identified as CD1d-Tet+ and TCRβ+. YFP+ iNKT cells were then examined for expression of NK1.1 and CD44. Mature iNKT1 cells express NK1.1 and progenitors that are T-BET+ can be found among CD44+NK1.1 cells. This mouse was 6 weeks old, but similar results were observed in mice between the ages of 6 and 16 weeks of age.
FIGURE 2:
FIGURE 2:
Thymic iNKT1 cells are enriched for genes associated with TGF-β signaling compared to liver and spleen iNKT1 cells. RNA was sequenced from iNKT1 cells isolated from the thymus, liver, and spleen of 10-week-old WT mice and normalized read counts were compared. (A) Number of differentially expressed genes (DEG) between WT thymus, liver, and spleen iNKT1 cells. (B) Hallmark Pathways identified by GSEA as enriched in liver compared to thymus iNKT1 cells. (C) Reads for 3 replicate RNA-seq samples from WT thymus (T, blue), liver (L, red), and spleen (S, green) for Itgb3, Dhfr, Cpt1a and Decr, which are representative genes from the pathways identified in (B). (D) Hallmark Pathways identified as enriched in thymus as compared to liver iNKT1 cells. (E) Normalized reads from replicate RNA-seq samples showing genes representative of the pathways identified in (D). (F) RNA-seq reads for Tgfbr1 and Tgfbr2. *P<0.05, **<P0.01, ***P<0.005 by ANOVA with multiple comparisons. iNKT1 cells for RNA-seq were isolated from mice that were 6 or 7 weeks of age.
FIGURE 3:
FIGURE 3:
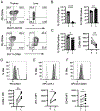
Thymic iNKT1 cells uniquely express TGF-β-associated adhesion proteins. (A) Flow cytometry for CD49a versus CD103 (top) or CD69 (bottom) on iNKT1 cells from the thymus (left) or liver (right). n = 4 (B) Summary of multiple flow cytometry experiments showing the percent of iNKT1 cells that are positive for CD103 or CD69 or (D) CD49a in the thymus (grey) or liver (black). MFI for CD49a is shown in the right panel. Each data point is an independent mouse. Representative flow cytometry histograms (top) and summary of multiple experiments (bottom) for (D) ICAM-1, (E) LFA-1 or (F) CD44 on thymus (shaded) or liver (open) iNKT1 cells. Light shaded histogram is isotype control. Data are representative of 3 experiments. *P<0.05, **
FIGURE 4:
FIGURE 4:
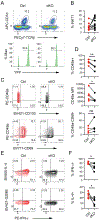
TGFβRII is required for the generation of thymic iNKT1 cells. (A) Flow cytometry analysis for thymic CD1d-tet+TCRβ+ (top) and YFP+ (bottom) iNKT1 cells in Ctrl and cKO mice. (B) Summary of thymic iNKT1 cell numbers in Ctrl (blue) and cKO (black) mice based on the staining strategy shown in (A). (C) Expression of PLZF and RORγt in thymic iNKT cells to identify iNKT1, iNKT2 and iNKT17 as indicated. (D) Summary of thymic iNKT1 cell numbers in Ctrl and cKO mice as determined in (C). (E) Summary of number of thymic iNKT2 and iNKT17 in Ctrl and cKO mice as determined in (C). (F) Expression of PLZF and T-BET identifying iNKT1 and iNKT2 cells among total iNKT cells in the thymus of Ctrl (blue) and cKO (black) mice. (G) Summary of the MFI for T-BET thymic iNKT1 cells identified as in (F). (H) GZMB and IFN-γ in thymic iNKT cells 5 hours after stimulation with PMA + ionomycin in vitro. (I) Summary of the number of thymic IFN-γ+ iNKT cells (left) or the % GZMB+ in Ctrl and cKO mice. *P<0.05, **<P0.01, ***P<0.005. ****P<0.001 by Student’s t-test. Mice were between 6 and 10 weeks of age.
FIGURE 5:
FIGURE 5:
TGFβRII is required for the generation of thymic CD49a+CD103+ iNKT1 cells. (A) Expression of CD49a versus CD103 (top) on Ctrl (left) or cKO (right) thymic iNKT1 cells. (B) Summary of the number of thymic CD49a+CD103+ or CD49a+CD103 iNKT1 cells (top), or CD49 MFI and number of CD49aCD69 iNKT1 cells (bottom) in the thymus of Ctrl (grey) and cKO (black) mice. (C) Expression of CD49a versus CD69 on Ctrl or cKO thymic iNKT1 cells. (D) Summary of the number of CD69+ thymic iNKT1 cells in Ctrl and cKO mice. (E) Expression of CD244 versus CD103 on thymic iNKT1 cells from Ctrl (left) and cKO (right) mice. (F) Summary of the number of CD244+ thymic iNKT1 cells in Ctrl and cKO mice. **<P0.01, ***P<0.005 by Student’s t-test. Mice were between 7 and 9 weeks of age.
FIGURE 6:
FIGURE 6:
TGFβRII promotes a classic TGF-β gene signature and represses an IL6-STAT3 signaling signature in thymic iNKT1 cells. (A) Heat map for differentially expressed genes between Ctrl and cKO thymic iNKT1 by RNA-seq. (B) Top enriched Hallmark Pathways by GSEA in Ctrl versus cKO thymic iNKT1 cells. (C) Normalized reads for replicate RNA-seq samples for representative IL6-JAK-STAT3 signaling genes, (D) Tgfbr2 and Smad7, (E) classic TGF-β signaling targets, and (F) genes associated with migration. (G) Graph of Log2FC and adj.p of genes in Ctrl and cKO thymic iNKT1 cells selected for those that are TGF-β regulated in skin CD8 Trm cells (54). Colors show genes that are up-regulated (blue) or down-regulated (red) or not changed (black) in our dataset. A subset of genes are labeled for clarity. *P<0.05, **<P0.01, ***P<0.005 by Student’s t-test. The iNKT1 cells for the RNA-seq were isolated from mice at 6.5, 5, and 15 weeks of age.
FIGURE 7:
FIGURE 7:
TGFβRII regulates CD49a and cytokine production in liver iNKT1 cells. (A) Flow cytometry analysis for liver CD1d-tet+TCRβ+YFP+ iNKT1 cells in Ctrl (left) and cKO (right) mice. (B) Summary of the percent of iNKT1 cells among liver lymphoid cells in Ctrl (red) and cKO (black) mice. (C) Expression of CD9a versus CD103 (top) or CD69 (bottom) on Ctrl (red) or cKO (black) liver iNKT1 cells. (D) Summary of the percent of iNKT1 cells that are CD49a+, the MFI of CD49, and the percent that are CD49aCD69. (E) Intracellular staining for IL-4 and IFN-γ (top) or GZMB and IFN-γ (bottom) and (F) summary of the percent of liver iNKT1 cells that are IFN-γ+ or IL-4+ two hours after injection of αGalCer. *P<0.05, **<P0.01, ***P<0.005 using Student’s t-test. Mice were between 6 and 12 weeks of age.

References

    1. Shissler SC, and Webb TJ. 2019. The ins and outs of type I iNKT cell development. Mol Immunol 105: 116–130. - PMC - PubMed
    1. Syn WK, Oo YH, Pereira TA, Karaca GF, Jung Y, Omenetti A, Witek RP, Choi SS, Guy CD, Fearing CM, Teaberry V, Pereira FE, Adams DH, and Diehl AM. 2010. Accumulation of natural killer T cells in progressive nonalcoholic fatty liver disease. Hepatology 51: 1998–2007. - PMC - PubMed
    1. Crosby CM, and Kronenberg M. 2018. Tissue-specific functions of invariant natural killer T cells. Nat Rev Immunol 18: 559–574. - PMC - PubMed
    1. Lee YJ, Wang H, Starrett GJ, Phuong V, Jameson SC, and Hogquist KA. 2015. Tissue-Specific Distribution of iNKT Cells Impacts Their Cytokine Response. Immunity 43: 566–578. - PMC - PubMed
    1. Umeshappa CS, Sole P, Yamanouchi J, Mohapatra S, Surewaard BGJ, Garnica J, Singha S, Mondal D, Cortes-Vicente E, D'Mello C, Mason A, Kubes P, Serra P, Yang Y, and Santamaria P. 2022. Re-programming mouse liver-resident invariant natural killer T cells for suppressing hepatic and diabetogenic autoimmunity. Nat Commun 13: 3279. - PMC - PubMed

Publication types

Substances