

Response shift results of quantitative research using patient-reported outcome measures: a descriptive systematic review
- PMID: 37702809
- PMCID: PMC10850024
- DOI: 10.1007/s11136-023-03495-x
Response shift results of quantitative research using patient-reported outcome measures: a descriptive systematic review
Abstract
Purpose: The objective of this systematic review was to describe the prevalence and magnitude of response shift effects, for different response shift methods, populations, study designs, and patient-reported outcome measures (PROM)s.
Methods: A literature search was performed in MEDLINE, PSYCINFO, CINAHL, EMBASE, Social Science Citation Index, and Dissertations & Theses Global to identify longitudinal quantitative studies that examined response shift using PROMs, published before 2021. The magnitude of each response shift effect (effect sizes, R-squared or percentage of respondents with response shift) was ascertained based on reported statistical information or as stated in the manuscript. Prevalence and magnitudes of response shift effects were summarized at two levels of analysis (study and effect levels), for recalibration and reprioritization/reconceptualization separately, and for different response shift methods, and population, study design, and PROM characteristics. Analyses were conducted twice: (a) including all studies and samples, and (b) including only unrelated studies and independent samples.
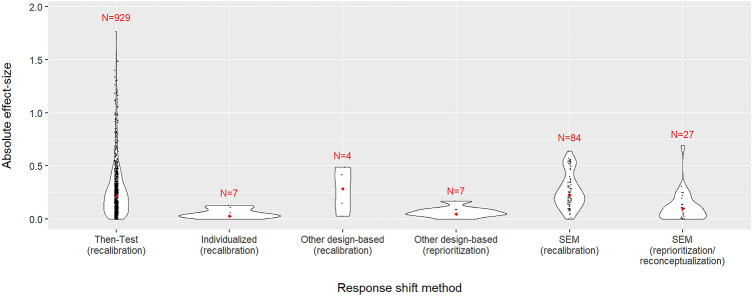
Results: Of the 150 included studies, 130 (86.7%) detected response shift effects. Of the 4868 effects investigated, 793 (16.3%) revealed response shift. Effect sizes could be determined for 105 (70.0%) of the studies for a total of 1130 effects, of which 537 (47.5%) resulted in detection of response shift. Whereas effect sizes varied widely, most median recalibration effect sizes (Cohen's d) were between 0.20 and 0.30 and median reprioritization/reconceptualization effect sizes rarely exceeded 0.15, across the characteristics. Similar results were obtained from unrelated studies.
Conclusion: The results draw attention to the need to focus on understanding variability in response shift results: Who experience response shifts, to what extent, and under which circumstances?
Keywords: Effect sizes; Patient-reported outcomes; Prevalence; Response shift; Systematic review.
© 2023. The Author(s).
Conflict of interest statement
The authors declare that they have no conflict of interest that are relevant to the content of this article. JRB is Co-Editor in Chief of Quality of Life Research.
Figures

References
-
- Sprangers MA, Cull A, Bjordal K, Groenvold M, Aaronson NK. The European organization for research and treatment of cancer. approach to quality of life assessment: Guidelines for developing questionnaire modules. Eortc Study Group on Quality of Life. Quality of Life Research. 1993;2(4):287–295. doi: 10.1007/BF00434800. - DOI - PubMed
-
- Kwon J-Y, Russell L, Coles T, Klaassen RJ, Schick-Makaroff K, Sibley KM, Mitchell SA, Sawatzky R. Patient-reported outcomes measurement in radiation oncology: Interpretation of individual scores and change over time in clinical practice. Current Oncology. 2022;29(5):3093–3103. doi: 10.3390/curroncol29050251. - DOI - PMC - PubMed
Publication types
MeSH terms
Grants and funding
LinkOut - more resources
Full Text Sources
