. 2023 Jan 3:101:skad304.
doi: 10.1093/jas/skad304.

The selected genes NR6A1, RSAD2-CMPK2, and COL3A1 contribute to body size variation in Meishan pigs through different patterns

Affiliations

The selected genes NR6A1, RSAD2-CMPK2, and COL3A1 contribute to body size variation in Meishan pigs through different patterns

Chenxi Liu et al. J Anim Sci. .

Abstract

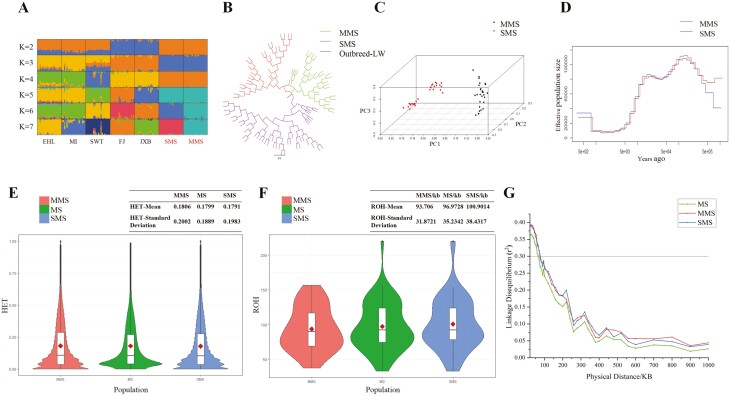
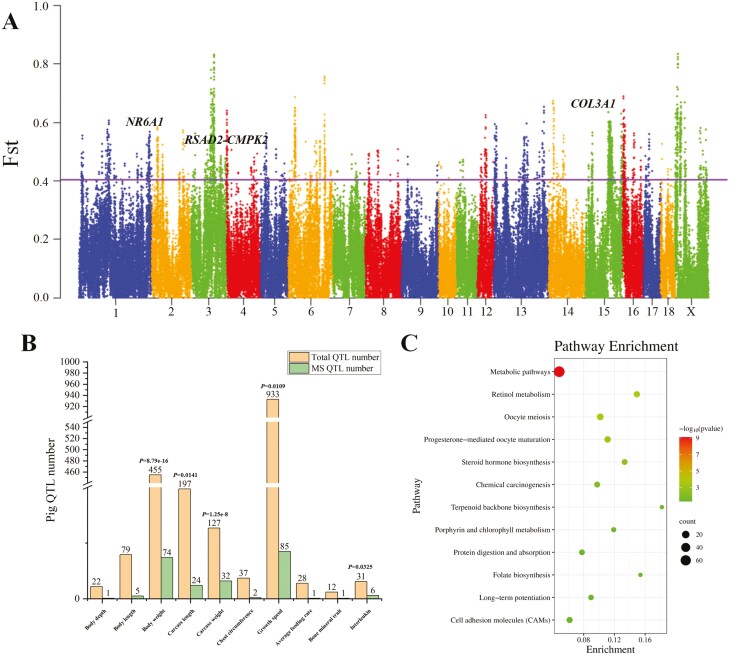
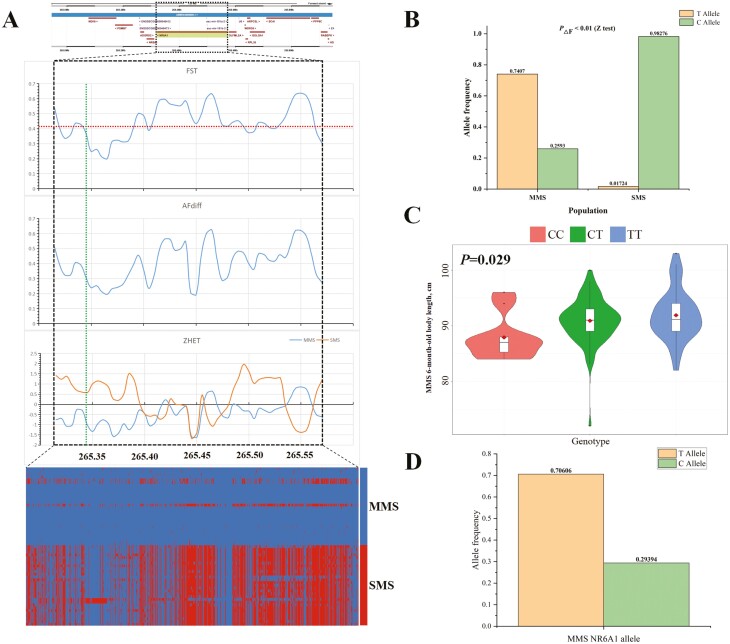
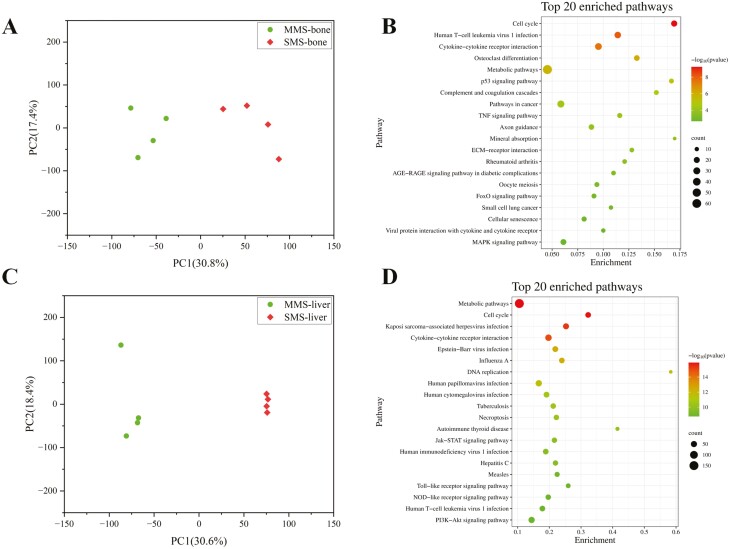
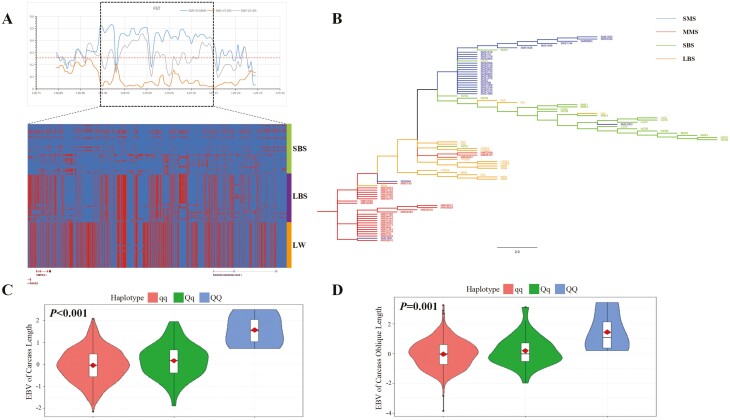
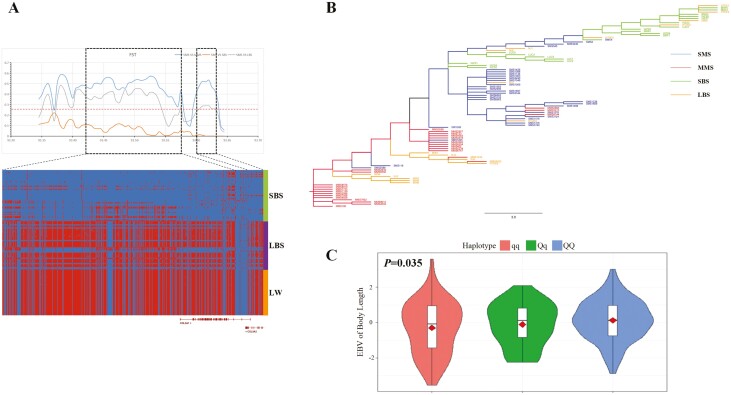
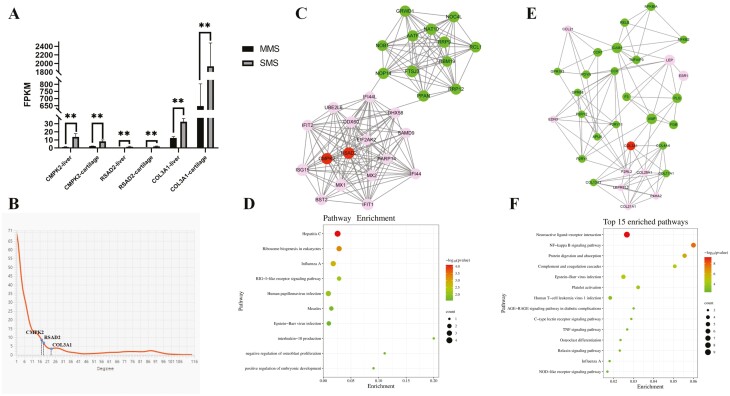
The high-fertility Meishan pig is currently categorized into medium sized (MMS) and small sized (SMS) based on body size. To identify causal genes responsible for the variation in body size within the two categories, we sequenced individuals representing the entire consanguinity of the existing Meishan pig. This enabled us to conduct genome selective signal analysis. Our findings revealed the genomes of MMS and SMS are stratified, with selective sweep regions formed by differential genomic intervals between the two categories enriched in multiple pig body size related quantitative trait loci (QTLs). Furthermore, the missense mutation c.575T > C of candidate causal gene NR6A1, accounting for the variation in lumbar vertebrae number in pigs, was positively selected in MMS only, leading to an increase in body length of MMS at 6 months of age. To precisely identify causal genes accounting for body size variation through multi-omics, we collected femoral cartilage and liver transcription data from MMS and SMS respectively, and re-sequencing data from pig breeds exhibiting varying body sizes. We found that two selected regions where the RSAD2-CMPK2 and COL3A1 genes are located, respectively, showed different haplotypes in pig breeds of varying body size, and was associated with body or carcass length in hybridized Suhuai pig. Additionally, the above three hub genes, were significantly greater expressed in SMS femoral cartilage and liver tissues compared to MMS. These three genes could strengthen the pathways related to bone resorption and metabolism in SMS, potentially hindering bone and skeletal development and resulting in a smaller body size in SMS. These findings provide valuable insights into the genetic mechanism of body size variation in Meishan pig population.

Keywords: COL3A1; NR6A1; RSAD2-CMPK2; Meishan pig; body size; bone resorption and digestion.

Plain language summary

The existing well-known Meishan pig population has been categorized into medium sized (MMS), and small sized (SMS) based on body size, which is a result of artificial selection. MMS is relatively large in all body size traits, but otherwise have highly similar appearance and performance traits. To effectively identify the candidate selected genes that contribute to the body size variation in Meishan pigs, this study collected individuals from all lineages of MMS and SMS for re-sequencing. Additionally, femoral cartilage and liver transcription data were collected from MMS and SMS, respectively, and re-sequencing data from pig breeds exhibiting varying body sizes were also analyzed. Through multi-omics analysis, it was discovered that the missense mutation c.575T > C in the candidate causal gene NR6A1 was positively selected in MMS only, leading to an increase in the body length of MMS at 6 months of age. Moreover, the selected genes RSAD2-CMPK2 and COL3A1 were found to be significantly greater expressed in SMS femoral cartilage and liver tissues compared with MMS. These genes could potentially strengthen bone resorption and metabolism-related pathways in SMS. These findings contribute to a better understanding of the genetic mechanisms underlying body size variation in Meishan pigs and Chinese indigenous pigs.


Conflict of interest statement

The authors declare that they have no competing interests.

Figures

Figure 1.
Figure 1.
Evolutionary structure and genetic diversity between MMS and SMS populations. (A) Admixture analysis with K values ranging from 2 to 7. EHL, MI, SWT, FJ, and JXB represent Erhualian, Mi, Shawutou, Fengjing, and Jiaxing black pig, respectively. (B) NJ-tree. (C) Principal component (PC) plot. The first (PC1), second (PC2), and third component (PC3) are displayed. (D) Demographic history of MMS and SMS. Generation time (g) = 1 year and transversion mutation rate (u) = 1.25 × 10⁻⁸ mutations per bp per generation. (E) and (F) are violin plot of MMS, SMS, and overall Meishan pig population heterozygosity (HET) and runs of homozygosity fragment (ROH) statistics, respectively, where the upper right corner shows the mean and standard deviation of the corresponding statistics for each population. (G) Linkage disequilibrium (r2 ) extents that were plotted as a function of inter-SNP distance for MMS, SMS, and overall Meishan pig population. The solid line indicates the threshold of 0.3.
Figure 2.
Figure 2.
Identification and functional enrichment of differential genome fragments between MMS and SMS. (A) Manhattan plot of Fst values between MMS and SMS by using 50-kb windows with a step size of 25-kb. The solid line indicates the significance threshold (Fst = 0.4029, Z test, P < 0.05). (B) Histogram plot of pig QTL enrichment analysis for selective sweep regions. The x axis represents the QTL categories. The y-axis represents the number of corresponding QTLs. Orange represents the total number of related category QTLs in the pig QTL database, and green represents the number of related category QTLs annotated by selective sweep regions. The P values above the histogram indicate significant enrichment of selective sweeps in the corresponding trait QTLs. (C) Significantly enriched KEGG pathways of protein-encoding genes located in selective sweep regions
Figure 3.
Figure 3.
The NR6A1 gene is one of the candidate causal genes accounting for body size variation between MMS and SMS. (A) Genome scans along the NR6A1 region. At the top panel is the genomic location for NR6A1. Fst, AFdiff, and Zhet statistics are shown in the middle panels. The plots for above three selection signals were all based on 10- kb windows with a step size of 5-kb. The significance threshold of Fst is shown with dashed line. The vertical dashed line is the location of the candidate causal mutation c.575T > C of NR6A1 gene. The bottom is a heat map of MMS and SMS haplotypes within NR6A1 region. Blue is MMS major allele and red is SMS major allele. (B) Histogram plot of allele frequency of c.575T > C of NR6A1 gene between sequenced 28 MMS and 29 SMS individuals. Z test found that the absolute frequency differentiation (AF) of c.575T > C between MMS and SMS showed significant difference. (C) Violin plot of association analysis between NR6A1 c.575T > C locus and the 6-month-old body length phenotype with 165 MMS individuals. (D) Histogram plot of allele frequencies of NR6A1 c.575T > C for 165 MMS individuals for above association analysis.
Figure 4.
Figure 4.
Differentially expressed genes in cartilage and liver tissues between MMS and SMS. (A) Principal component (PC) plot based on all expressed genes in MMS and SMS cartilage tissue. The first (PC1) and second (PC2) are displayed. (B) Top 20 significantly enriched KEGG pathways of differentially expressed genes in cartilage tissue between MMS and SMS. (C) Principal component (PC) plot based on all expressed genes in MMS and SMS liver tissue. The first (PC1) and second (PC2) are displayed. (D) Top 20 significantly enriched KEGG pathways of differentially expressed genes in liver tissue between MMS and SMS.
Figure 5.
Figure 5.
RSAD2-CMPK2 region is a candidate causal genomic region affecting body size between MMS and SMS. (A) RSAD2-CMPK2 region demonstrated significant selection signals between MMS and SMS. At the top panel is three Fst statistics: SMS compared with MMS (SMS VS MMS), SMS compared with large body size pig breeds (SMS VS LBS), SMS compared with small body size pig breeds (SMS VS SBS). The dashed line is the Fst significance threshold. At the bottom panel is heat map of MMS and SMS haplotypes within RSAD2-CMPK2 region. Blue is MMS major allele and red is SMS major allele. SBS represents small body size pig breeds including SMS, LBS represents large body size pig breeds including MMS and LW represents Large White pig. (B) NJ-tree of different body size pig breeds for RSAD2-CMPK2 region. Blue lines represent SMS, green lines represent SBS except SMS, red lines represent MMS, and orange lines represent LBS except MMS. SBS represents small body size pig breeds, LBS represents large body size pig breeds. (C) and (D) are violin plot for haplotype association analysis of Suhuai pig carcass length trait and carcass oblique length trait, respectively. Among which, Q is MMS major haplotype and the others are q haplotype.
Figure 6.
Figure 6.
COL3A1 region is a candidate causal genomic region affecting body size differentiation between MMS and SMS. (A) COL3A1 region demonstrated significant selection signals between MMS and SMS. At the top panel is three Fst statistics: SMS compared with MMS (SMS vs. MMS), SMS compared with large body size pig breeds (SMS vs. LBS), SMS compared with small body size pig breeds (SMS vs. SBS). The dashed line is the Fst significance threshold. At the bottom panel is heat map of MMS and SMS haplotypes within COL3A1 region. Blue is MMS major allele and red is SMS major allele. SBS represents small body size pig breeds including SMS, LBS represents large body size pig breeds including MMS and LW represents Large White pig. (B) NJ-tree of different body size pig breeds for COL3A1 region. Blue lines represent SMS, green lines represent SBS except SMS, red lines represent MMS, and orange lines represent LBS except MMS. SBS represents small body size pig breeds, LBS represents large body size pig breeds. (C) is violin plot for haplotype association analysis of Suhuai body length trait. Among which, Q is MMS major haplotype and the others are q haplotype.
Figure 7.
Figure 7.
RSAD2-CMPK2 and COL3A1 genes effects on bone or skeletal development of MMS and SMS. (A) Cartilage and liver FPKM values of RSAD2 CMPK2 and COL3A1 in four MMS individuals and four SMS individuals. ** represents extremly significant difference (P < 0.01). (B) The degree of interaction between genes. The x-axis represents the degree of gene interaction and the y-axis represents the number of genes. blue dots represent RSAD2 CMPK2 and COL3A1 gene. (C) and (E) are sub-networks constructed by the MCODE module of cytoscape software, which are significant interacted with RSAD2-CMPK2 or COL3A1, respectively. (D) Significantly enriched KEGG and GO pathways of the genes interacting with RSAD2-CMPK2. (F) Top 15 significantly enriched KEGG pathways of the genes interacting with COL3A1.

Similar articles

Cited by

References

    1. Ai, H., Fang X., Yang B., Huang Z., Chen H., Mao L., Zhang F., Zhang L., Cui L., He W.,. et al.. 2015. Adaptation and possible ancient interspecies introgression in pigs identified by whole-genome sequencing. Nat. Genet. 47:217–225. doi:10.1038/ng.3199. - DOI - PubMed
    1. Alexander, D. H., Novembre J., and Lange K... 2009. Fast model-based estimation of ancestry in unrelated individuals. Genome Res. 19:1655–1664. doi:10.1101/gr.094052.109. - DOI - PMC - PubMed
    1. Asagiri, M., and Takayanagi H... 2007. The molecular understanding of osteoclast differentiation. Bone 40:251–264. doi:10.1016/j.bone.2006.09.023. - DOI - PubMed
    1. Bandyopadhyay, A., Tsuji K., Cox K., Harfe B. D., Rosen V., and Tabin C. J... 2006. Genetic analysis of the roles of BMP2, BMP4, and BMP7 in limb patterning and skeletogenesis. PLoS Genet. 2:e216. doi:10.1371/journal.pgen.0020216. - DOI - PMC - PubMed
    1. Bland, R. 2000. Steroid hormone receptor expression and action in bone. Clin. Sci 98:217–240. 10.1042/cs0980217. - DOI - PubMed

Substances

LinkOut - more resources