

Using Machine Learning-Based Algorithms to Identify and Quantify Exercise Limitations in Clinical Practice: Are We There Yet?
- PMID: 37703323
- PMCID: PMC11882194
- DOI: 10.1249/MSS.0000000000003293
Using Machine Learning-Based Algorithms to Identify and Quantify Exercise Limitations in Clinical Practice: Are We There Yet?
Abstract
Introduction: Well-trained staff is needed to interpret cardiopulmonary exercise tests (CPET). We aimed to examine the accuracy of machine learning-based algorithms to classify exercise limitations and their severity in clinical practice compared with expert consensus using patients presenting at a pulmonary clinic.
Methods: This study included 200 historical CPET data sets (48.5% female) of patients older than 40 yr referred for CPET because of unexplained dyspnea, preoperative examination, and evaluation of therapy progress. Data sets were independently rated by experts according to the severity of pulmonary-vascular, mechanical-ventilatory, cardiocirculatory, and muscular limitations using a visual analog scale. Decision trees and random forests analyses were calculated.
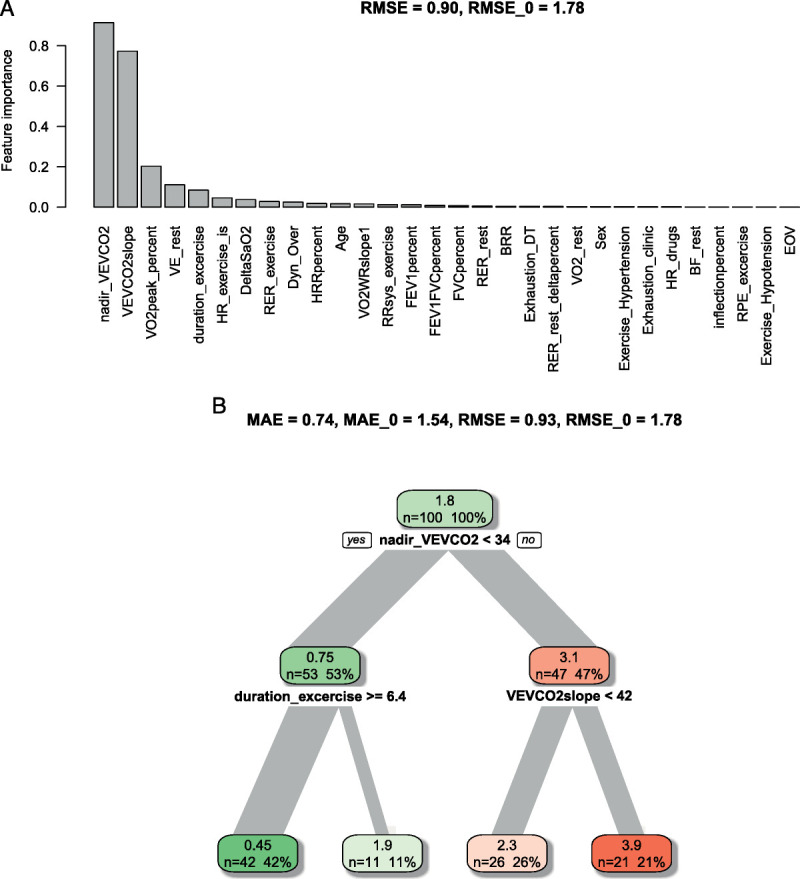
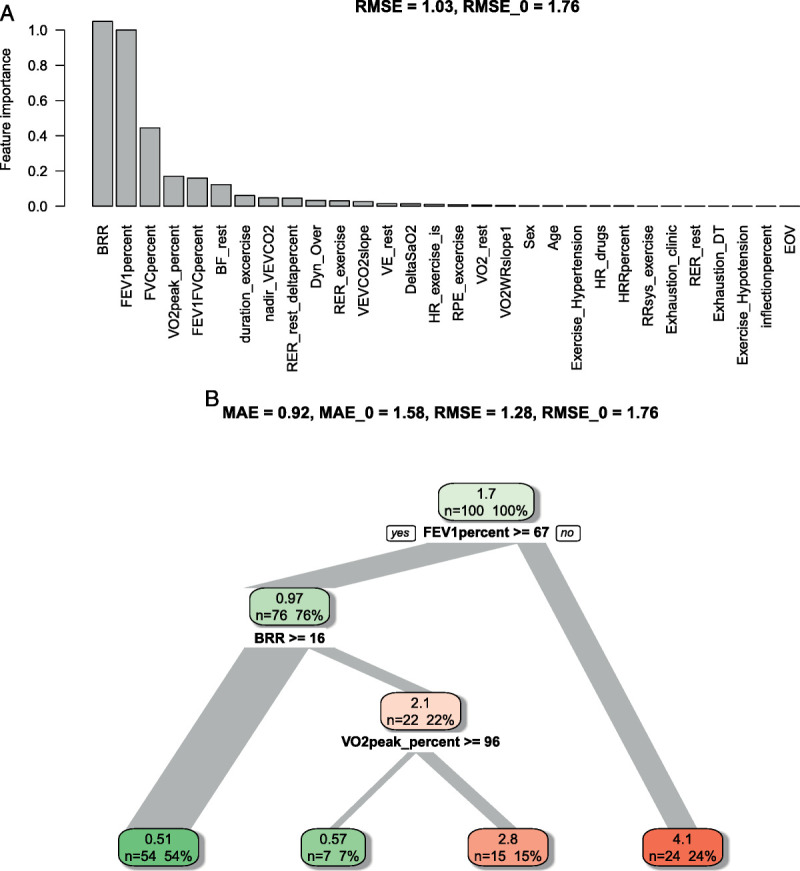
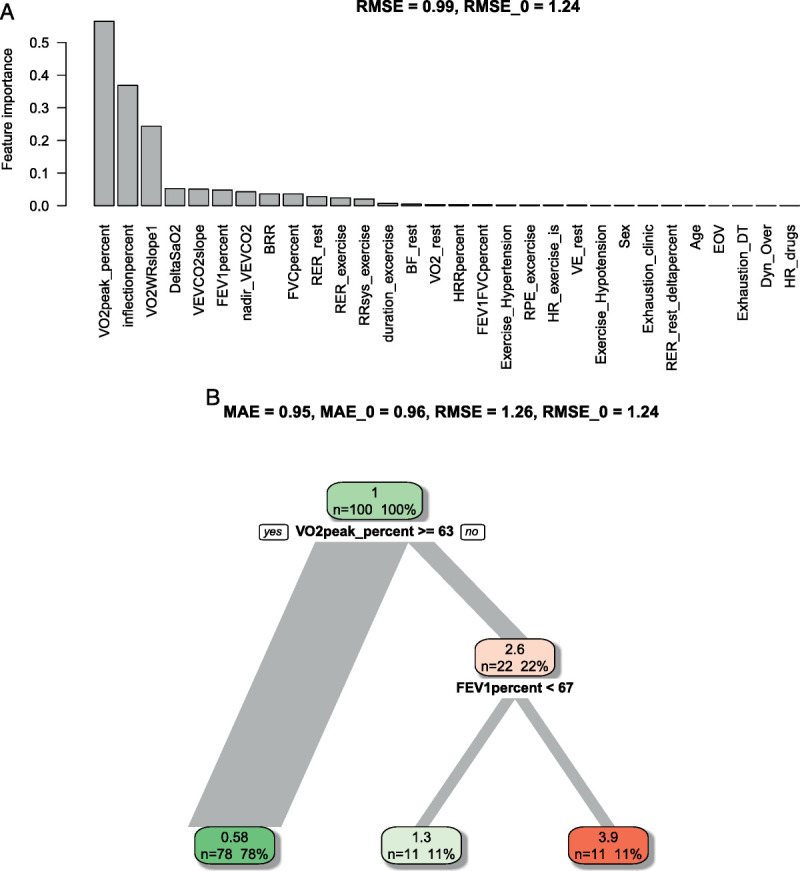
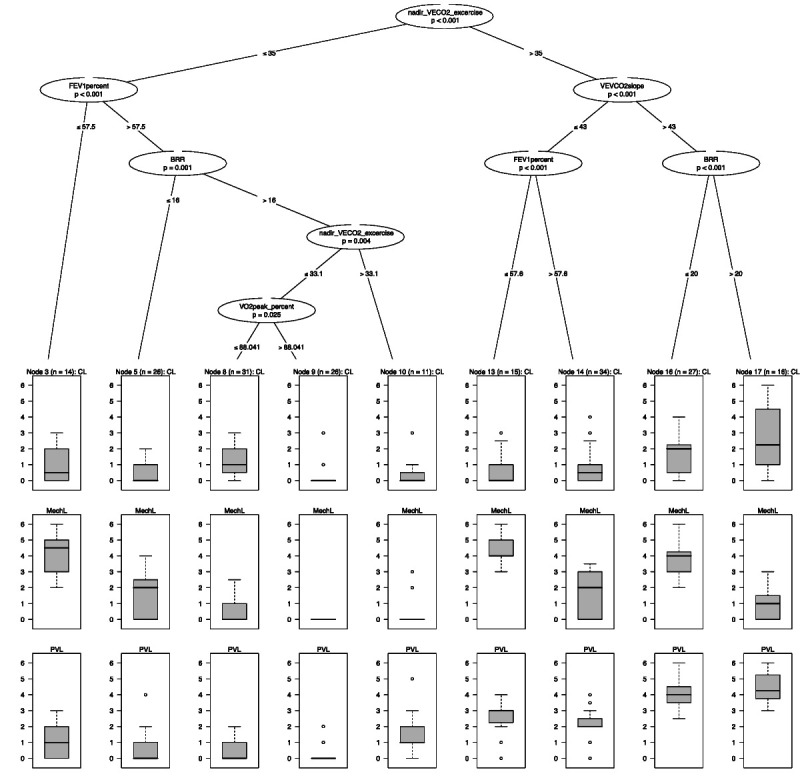
Results: Mean deviations between experts in the respective limitation categories ranged from 1.0 to 1.1 points (SD, 1.2) before consensus. Random forests identified parameters of particular importance for detecting specific constraints. Central parameters were nadir ventilatory efficiency for CO 2 , ventilatory efficiency slope for CO 2 (pulmonary-vascular limitations); breathing reserve, forced expiratory volume in 1 s, and forced vital capacity (mechanical-ventilatory limitations); and peak oxygen uptake, O 2 uptake/work rate slope, and % change of the latter (cardiocirculatory limitations). Thresholds differentiating between different limitation severities were reported. The accuracy of the most accurate decision tree of each category was comparable to expert ratings. Finally, a combined decision tree was created quantifying combined system limitations within one patient.
Conclusions: Machine learning-based algorithms may be a viable option to facilitate the interpretation of CPET and identify exercise limitations. Our findings may further support clinical decision making and aid the development of standardized rating instruments.
Copyright © 2023 The Author(s). Published by Wolters Kluwer Health, Inc. on behalf of the American College of Sports Medicine.
Figures
References
-
- Balady GJ Arena R Sietsema K, et al. Clinician’s guide to cardiopulmonary exercise testing in adults. Circulation. 2010;122(2):191–225. - PubMed
-
- Kodama S Saito K Tanaka S, et al. Cardiorespiratory fitness as a quantitative predictor of all-cause mortality and cardiovascular events in healthy men and women: a meta-analysis. JAMA. 2009;301(19):2024–35. - PubMed
-
- Korpelainen R Lamsa J Kaikkonen KM, et al. Exercise capacity and mortality—a follow-up study of 3033 subjects referred to clinical exercise testing. Ann Med. 2016;48(5):359–66. - PubMed
-
- Wasserman K. The Dickinson W Richards lecture. New concepts in assessing cardiovascular function. Circulation. 1988;78(4):1060–71. - PubMed
MeSH terms
LinkOut - more resources
Full Text Sources
