. 2023 Sep 13;15(713):eabq5930.
doi: 10.1126/scitranslmed.abq5930. Epub 2023 Sep 13.

A TGFβ-ECM-integrin signaling axis drives structural reconfiguration of the bile duct to promote polycystic liver disease

Affiliations

A TGFβ-ECM-integrin signaling axis drives structural reconfiguration of the bile duct to promote polycystic liver disease

Scott H Waddell et al. Sci Transl Med. .

Abstract

The formation of multiple cysts in the liver occurs in a number of isolated monogenic diseases or multisystemic syndromes, during which bile ducts develop into fluid-filled biliary cysts. For patients with polycystic liver disease (PCLD), nonsurgical treatments are limited, and managing life-long abdominal swelling, pain, and increasing risk of cyst rupture and infection is common. We demonstrate here that loss of the primary cilium on postnatal biliary epithelial cells (via the deletion of the cilia gene Wdr35) drives ongoing pathological remodeling of the biliary tree, resulting in progressive cyst formation and growth. The development of cystic tissue requires the activation of transforming growth factor-β (TGFβ) signaling, which promotes the expression of a procystic, fibronectin-rich extracellular matrix and which itself is perceived by a changing profile of integrin receptors on the cystic epithelium. This signaling axis is conserved in liver cysts from patients with either autosomal dominant polycystic kidney disease or autosomal dominant polycystic liver disease, indicating that there are common cellular mechanisms for liver cyst growth regardless of the underlying genetic cause. Cyst number and size can be reduced by inhibiting TGFβ signaling or integrin signaling in vivo. We suggest that our findings represent a therapeutic route for patients with polycystic liver disease, most of whom would not be amenable to surgery.


Conflict of interest statement

Conflict of Interest: All authors declare that they have no competing interests.

Figures

Figure 1
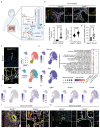
Figure 1. Selective loss of Wdr35 in BECs results in PC loss and the formation of polycystic liver disease.
A. The mutations in genes associated with PKD (PKD1, PKD2, PKHD1, ALGG9, DNAJB11, DZIP1L, GANAB, LRP5); ADPLD (PRKCSH, SEC63, SEC61B, GANAB, ALG8, and LRP5), and syndromic cystic diseases (for example WDR35) in relation to the primary cilium. B. Cilia (or cilia-rudiments after Wdr35-deletion) are marked by ARL13B (yellow) and IFT88 (cyan) in KRT19-positive cells (magenta), DNA in grey. C. Number (Wdr35+/+ n=11 animals and Wdr35-/ n=8 animals) and area of ducts or cysts in 12-month Wdr35+/+ (n=812 ducts) and Wdr35-/- (n=3834 cysts). D. Serum alkaline phosphatase (ALP) concentrations of 12-month Wdr35+/+ (n=10) and Wdr35-/- (n=8) mice. E. EpCAM-positive BECs in Wdr35+/+ and Wdr35-/- livers (yellow). F. scRNA-seq UMAP showing Seurat clusters 1-4 into which Wdr35+/+ and Wdr35-/- BECs segregate. G. UMAP showing segregation of Wdr35+/+ (cyan) and Wdr35- (salmon) cells. H. EpCam and Spp1 mRNA abundance across all cells I. GO term analysis of cluster 1 (87% composed of Wdr35+/+ cells) and cluster 2 (97% composed of Wdr35-/- cells). J to K. UMAPs of Tgfβ1, Tgfβ2 (J) and Tgfβr2, Smad3, and Smad4 (K) in Wdr35+/+ (n=3060) and Wdr35-/- (n=966) cells. L to M. Immunohistochemistry of Wdr35+/+ and Wdr35-/- livers stained for KRT19 (yellow) TGFBRII (magenta, L) or pSMAD3S423/S425 (magenta, M), and SMAD4 (cyan). DNA is grey. White arrows denote positive BEC staining. Green dotted lines denotes duct or cyst boundary (scale bar=100 μm).
Figure 2
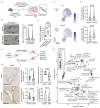
Figure 2. Cystic epithelial cells are sensitised to TGFβ signalling thereby promoting the formation of a pro-cystic ECM.
A. Schematic of duct-to-cyst cultures B. Photomicrographs showing typical structures of ducts after 72 h culture with and without SIS3 treatment. Quantification of ex vivo cultures treated with the SMAD3-inhibitor SIS3 (vehicle: n=487 and SIS3: n=378). Yellow dotted line denotes the duct boundary (scale bar=50 μm). C. Protein expression of fibronectin assessed by RPPA in freshly isolated ducts or after 72h culture with vehicle or SIS3-treatment (n=3 biological replicates). D. UMAP showing Fn1 and Lamb3 expression. E. Quantification of immunohistological expression of fibronectin (284 Wdr35+/+ ducts from n=11 animals and 237 Wdr35-/- ducts from n=8 animals) and pan-laminin (177 Wdr35-/- cysts from n=11 animals and299 Wdr35+/+ cysts from n=8 animals). F. Schematic detailing the treatment of cyst-bearing Wdr35-/- mice with SIS3. G. Immunohistochemical staining for panCK-positive BECs (scale bar=500 μm). H. Number and log size of panCK-positive structures in cyst-bearing mice treated with vehicle alone or SIS3 for 3 weeks (vehicle: n=6 animals and SIS3: n=7 animals). I. Serum alkaline phosphatase concentrations in cyst-bearing mice treated with vehicle (n=4 animals) or SIS3 (n=7 animals). J. Fibronectin positivity in Wdr35-/- animals treated with SIS3 (277 cysts from n= mice) or vehicle (196 cysts from n= 7 mice). K. REViGO output showing the rationalised GOterms following GOrilla analysis.
Figure 3
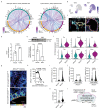
Figure 3. Cystic cells expand their ability to interact with a fibronectin-rich microenvironment and alter their cell shape.
A. Ligand-receptor interactions in scRNA-seq data from Wdr35+/+ and Wdr35-/- cells. B. UMAPs showing Itga2 and Itgb1 mRNA expression. C. Immunohistochemistry for Collagen-IV (cyan) and ITGA2 (magenta) in Wdr35-/- or Wdr35+/+ BECs. Yellow dotted line denotes duct/cyst boundary. (scale bar=50 μm). D. mRNA abundance of ITGA2 in a human H69 cells after stimulation with recombinant-TGFβ for 16 h (n=3). E. Protein abundance of ITGA2 in H69 cells treated with 10 μM of SIS3 for 72 h. Histogram shows GAPDH-normalised ITGA2 expression (n=3). F. scRNA-seq expression of integrin effector molecules (Pxn, Fermt1, Ilk, Tln1, Actn1, Rhoc) comparing median transcript abundance between Wdr35+/+ and Wdr35-/- cells. G. Intensity projection of pMLC2 staining in Wdr35 ducts and Wdr35-/- BECs. Dotted line denotes duct and cyst boundary. (scale bar=20 μm). H. Quantification of pMLC2 intensity across the apico-basal axis of normal biliary cells (grey) and cystic epithelial cells (black). I. Average pMLC2 intensity in Wdr35+/+ and Wdr35-/- cells. J. Apical and basal pMLC2 abundance in Wdr35+/+ and Wdr35-/- biliary cells (for H-J, n=101 Wdr35+/+ cells and n=252 Wdr35-/- cells, n=4 animals per group). K. Width of biliary cells from Wdr35+/+ (165 cells from n=4 animals) and Wdr35-/- (172 cells from n= 4 animals) mice.
Figure 4
Figure 4. Integrin-α2β1 promotes hepatic cystogenesis by mediating cyst fission.
A. Schematic representation of the potential lineage traced outcomes of murine, Wdr35-/- cysts in the Krt19- CreERT;Wdr35-/-;R26LSL-Confetti transgenic line. B. Wholemount imaging of EpCAM (grey), cYFP (yellow), or cRFP (magenta). White boxes represent magnified regions of interest. Cysts sharing a single mutant clone denoted by dotted orange line. (Scale bar=100 μm) C. ITGA2 and GAPDH immunoblots from freshly isolated bile duct extracts versus those cultured for 72 h. Immunocytochemistry of ITGA2 (magenta) and F-actin (phalloidin; yellow) in 72 h cultured ducts (white arrows show basally-localised ITGA2, scale bar=50μm). D. Area of Itga2+/+ (N=138) versus Itga2-/- (N=114) tdTomato-positive cultured ducts upon plating or following 72 h culture, (Itga2+/+: N=304 versus Itga2-/-: N=569). E. Area of cultured ducts when treated with 100 μM TC-I 15 (N=439) or vehicle (N=354) for 72 h. F. Proliferation of BECs from patients with PCLD treated with TC-I 15 or vehicle (N=9 experimental replicates). G. Healthy human BECs treated the same way as in F, (N=9 experimental replicates). H. Schematic of the in vivo treatment of cyst-bearing mice with TC-I 15 (21 days at 20 mg/kg). I. Median expression of pMLC2S19 staining in cystic cells treated with vehicle (176 cysts from n=7 mice) or TC-I 15 (73 cysts from n=6 mice). J. Quantification of cystic luminal area or number of cysts in the livers of Wdr35-/- mice treated with TC-I 15 (n=6 mice) or vehicle (n=7-8 mice).

References

    1. Lanktree MB, Haghighi A, Guiard E, Iliuta I-A, Song X, Harris PC, Paterson AD, Pei Y. Prevalence estimates of polycystic kidney and liver disease by population sequencing. J Am Soc Nephrol. 2018;29:2593–2600. - PMC - PubMed
    1. Cnossen WR, Drenth JPH. Polycystic liver disease: an overview of pathogenesis, clinical manifestations and management. Orphanet J Rare Dis. 2014;9:69. - PMC - PubMed
    1. Masyuk AI, Gradilone SA, Banales JM, Huang BQ, Masyuk TV, Lee S-O, Splinter PL, Stroope AJ, Larusso NF. Cholangiocyte primary cilia are chemosensory organelles that detect biliary nucleotides via P2Y12 purinergic receptors. Am J Physiol Gastrointest Liver Physiol. 2008;295:G725–34. - PMC - PubMed
    1. Fabris L, Fiorotto R, Spirli C, Cadamuro M, Mariotti V, Perugorria MJ, Banales JM, Strazzabosco M. Pathobiology of inherited biliary diseases: a roadmap to understand acquired liver diseases. Nat Rev Gastroenterol Hepatol. 2019;16:497–511. - PMC - PubMed
    1. Zimmerman KA, Song CJ, Gonzalez-Mize N, Li Z, Yoder BK. Primary cilia disruption differentially affects the infiltrating and resident macrophage compartment in the liver. Am J Physiol Gastrointest Liver Physiol. 2018;314:G677–G689. - PMC - PubMed

Publication types

Supplementary concepts