. 2023 Sep 15;9(37):eadd9084.
doi: 10.1126/sciadv.add9084. Epub 2023 Sep 13.

Codependencies of mTORC1 signaling and endolysosomal actin structures

Affiliations

Codependencies of mTORC1 signaling and endolysosomal actin structures

Amulya Priya et al. Sci Adv. .

Abstract

The mechanistic target of rapamycin complex 1 (mTORC1) is part of the amino acid sensing machinery that becomes activated on the endolysosomal surface in response to nutrient cues. Branched actin generated by WASH and Arp2/3 complexes defines endolysosomal microdomains. Here, we find mTORC1 components in close proximity to endolysosomal actin microdomains. We investigated for interactors of the mTORC1 lysosomal tether, RAGC, by proteomics and identified multiple actin filament capping proteins and their modulators. Perturbation of RAGC function affected the size of endolysosomal actin, consistent with a regulation of actin filament capping by RAGC. Reciprocally, the pharmacological inhibition of actin polymerization or alteration of endolysosomal actin obtained upon silencing of WASH or Arp2/3 complexes impaired mTORC1 activity. Mechanistically, we show that actin is required for proper association of RAGC and mTOR with endolysosomes. This study reveals an unprecedented interplay between actin and mTORC1 signaling on the endolysosomal system.


Figures
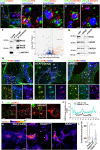
Fig. 1.
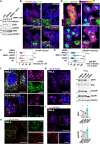
Fig. 1.. mTORC1 signaling components colocalize with branched actin structures on endolysosomes.
(A to E) MDA-MB-231 cells were fixed and analyzed for indicated mTORC1 components, branched actin network, and endolysosomal markers by immunofluorescence and confocal microscopy. Asterisk denotes endolysosomes, and arrowheads denote microdomains of indicated markers. Nucleus contour is shown with a dashed line (A). In (B) to (E), high-resolution confocal images were acquired on a Airyscan detector-equipped Zeiss confocal microscope. (F) Anti-RAGC or control immunoglobulin G (IgG) immunoprecipitates from MDA-MB-231 cell lysates analyzed by immunoblotting with indicated antibodies. Irrelevant lanes were removed, and gel splicing is indicated by dotted line [also in (G)]. Molecular weight markers are in kDa. Right: Volcano plot showing differential anti-RAGC versus Ctrl IgG level (log2, x axis) and P value (−log10, y axis) based on quantitative mass spectrometry analysis from three independent experiments. Green line, fold change of 1.6; orange line, P value of 0.05. (G) Cells knocked down for RAGC or CAPZ proteins (i.e., CAPZA1, CAPZA2, CAPZA3, and CAPZB) by small interfering RNA (siRNA) treatment. Asterisk in the immunoblot points to nonspecific antibody detection. (H) Cells knocked down for indicated proteins stained for FAM21 and F-actin puncta and endolysosomal marker, CD63. (I) Control or cells silenced for RAGC labeled for Rab7 and Arp2/3 subunit, ARPC2. Dotted lines indicate endolysosomal perimeter region used for linescan analysis. (J) Averaged ARPC2 fluorescence profiles ± SEM based on individual line scans recorded along the edge of Rab7-positive endolysosomes and aligned relative to maximum ARPC2 intensity. (K) MDA-MB-231 cells expressing FLAG-tagged RAGCQ120L or RAGCS75N or transfected with empty FLAG vector (Ctrl) fixed and labeled for cortactin, FLAG tag, and F-actin (see fig. S1D). Asterisk denotes FLAG-positive cells. (L) Number of cytoplasmic cortactin-enriched puncta in indicated cell populations. Scale bars, 10 μm (A, H, and K), 2 μm (B to E and insets), and 1 μm (I). Numerical data and statistical tests are provided in table S5. IP, immunoprecipitation; FC, fold change; a.u., arbitrary units.
Fig. 2.
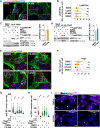
Fig. 2.. Endolysosomal actin dynamics is required for mTORC1 activity.
(A) MDA-MB-231 cells with the indicated treatment were fixed and stained for F-actin, mTOR, and CD63. For wash out experiments, cells were treated for 60 min with CK-666, followed by 60 min incubation in the absence of the drug. The nucleus contour is shown with a dashed line. Scale bar, 10 μm. (B to E) Cells in complete medium were treated with vehicle [dimethyl sulfoxide (DMSO)] or with CK-666 (200 μM), inactive CK-689 compound, or CytoD (0.5 μM) or starved in EBSS medium for 60 min. Immunoblots of phosphorylated S6K and 4E-BP1 in MDA-MB-231 (B), BT-549 (C), MCF10A (D), or HT-1080 cells (E) with glyceraldehyde-3-phosphate dehydrogenase (GAPDH) used as a loading control. Plots show the levels of phosphorylated S6K and 4E-BP1 normalized to GAPDH in the different cell lines quantified from at least three independent experiments. (F) Distribution of the number of CD63-, Rab7-, VPS35-, and mTOR-positive vesicular structures per cell from images acquired by three dimensional (3D) deconvolution wide-field microscopy. The medians and quartiles are shown in violin plots. All numerical data and statistical tests are provided in table S5.
Fig. 3.
Fig. 3.. Loss of WASH suppresses mTORC1 signaling.
(A) MDA-MB-231 cells were treated with control nontargeting siRNA (siNT) or two siRNA concentrations to knock down the WASH subunit of the WASH complex or the BRK1 and NCKAP1 (NAP1) subunits of the WAVE complex. After 72 hours, cells were lysed and analyzed by immunoblotting with the indicated antibodies. GAPDH was used as a loading control. The asterisk points to nonspecific detection. Molecular weight markers are in kDa. (B) MDA-MB-231 cells treated with the indicated siRNAs were fixed and stained for F-actin, mTOR, and CD63. (C) Quantification of mTOR-positive vesicle/cell from images acquired on a wide-field 3D deconvolution microscope using ImageJ software. (D) Cells treated with the indicated siRNAs were fixed and stained for p4E-BP1. Intensity of p4E-BP1 signal is shown using a fire lookup table. (E) Quantification of mean intensity of p4E-BP1 immunofluorescence staining in the indicated cell populations. (F to I) Human cervical cancer HeLa or breast MDA-MB-231 carcinoma cells grown in complete medium were fixed and stained for early endosomal (EEA1) or endolysosomal (CD63) markers and WASH subunit (FAM21) or mTOR kinase as indicated. Scale bars, 10 and 5 μm (insets). (J) HeLa cells were treated with vehicle (DMSO) or with CK-666 (200 μM) or CytoD (0.5 μM) or starved in EBSS medium for 60 min. Immunoblots of phosphorylated or total S6K or phosphorylated or total 4E-BP1 with GAPDH used as a loading control. Levels of phosphorylated S6K and 4E-BP1 normalized to GAPDH were quantified from two independent experiments. All numerical data and statistical tests are provided in table S5.
Fig. 4.
Fig. 4.. RAGC dissociation from endolysosomes upon disruption of the branched actin network.
(A) Cells in complete medium were treated with vehicle (DMSO) or with CK-666 for 60 min. After fixation, cells were stained for F-actin, CD63, and LAMTOR4. (B) Quantification of LAMTOR4-positive vesicles/cell in cells with the indicated treatment. (C and D) MDA-MB-231 cells were transfected with vectors expressing GFP-tagged LAMTOR1 (C) or FLAG-tagged LAMTOR4 (D) or corresponding empty vectors. Cells in complete medium were treated with vehicle (DMSO) or CK-666 for 60 min and lysed, and proteins were immunoprecipitated using the GFP- or FLAG-Trap procedure, respectively. Bound partners were detected by immunoblotting with the indicated antibodies. (E) MDA-MB-231 cells were stained for F-actin, RAGC, and CD63. The nucleus contour is shown with a dashed line. Scale bars, 10 and 2 μm (insets). (F) Quantification of RAGC-positive vesicles/cell in cells with the indicated treatment. (G to I) MDA-MB-231 cells transiently expressing FLAG-tagged RAGCQ120L or RAGCS75N or transfected with control empty FLAG vector (Ctrl) were fixed and labeled for FLAG tag and p4E-BP1 (see fig. S5, A and B) or mTOR. Quantification of the mean intensity of p4E-BP1 staining in the indicated cell population normalized to the mean intensity in control cells in (G). Number of mTOR-positive vesicular structures per cell in (H). Median and quartiles shown in the violin plots. Intensity of mTOR signal is shown using a fire lookup table in (I). Asterisk denotes FLAG-positive cell. Scale bar, 10 μm (I). All numerical data and statistical tests are provided in table S5.

References

    1. G. Y. Liu, D. M. Sabatini, mTOR at the nexus of nutrition, growth, ageing and disease. Nat. Rev. Mol. Cell Biol. 21, 183–203 (2020). - PMC - PubMed
    1. O. A. Brady, H. I. Diab, R. Puertollano, Rags to riches: Amino acid sensing by the Rag GTPases in health and disease. Small GTPases 7, 197–206 (2016). - PMC - PubMed
    1. S. A. Fernandes, C. Demetriades, The Multifaceted Role of Nutrient Sensing and mTORC1 Signaling in Physiology and Aging. Front. Aging 2, 707372 (2021). - PMC - PubMed
    1. P. Gollwitzer, N. Grutzmacher, S. Wilhelm, D. Kummel, C. Demetriades, A Rag GTPase dimer code defines the regulation of mTORC1 by amino acids. Nat. Cell Biol. 24, 1394–1406 (2022). - PMC - PubMed
    1. Y. Sancak, L. Bar-Peled, R. Zoncu, A. L. Markhard, S. Nada, D. M. Sabatini, Ragulator-Rag complex targets mTORC1 to the lysosomal surface and is necessary for its activation by amino acids. Cell 141, 290–303 (2010). - PMC - PubMed

Substances