. 2023 Sep 15;9(37):eadi4753.
doi: 10.1126/sciadv.adi4753. Epub 2023 Sep 13.

Chimeric hemagglutinin split vaccines elicit broadly cross-reactive antibodies and protection against group 2 influenza viruses in mice

Affiliations

Chimeric hemagglutinin split vaccines elicit broadly cross-reactive antibodies and protection against group 2 influenza viruses in mice

Eduard Puente-Massaguer et al. Sci Adv. .

Abstract

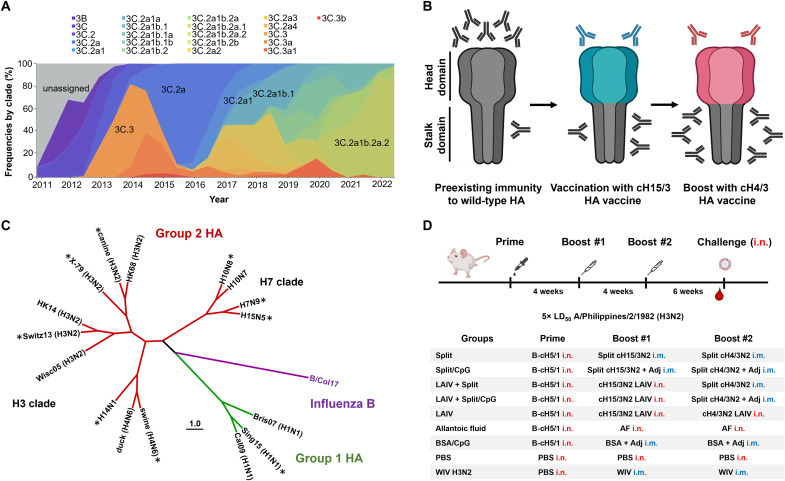
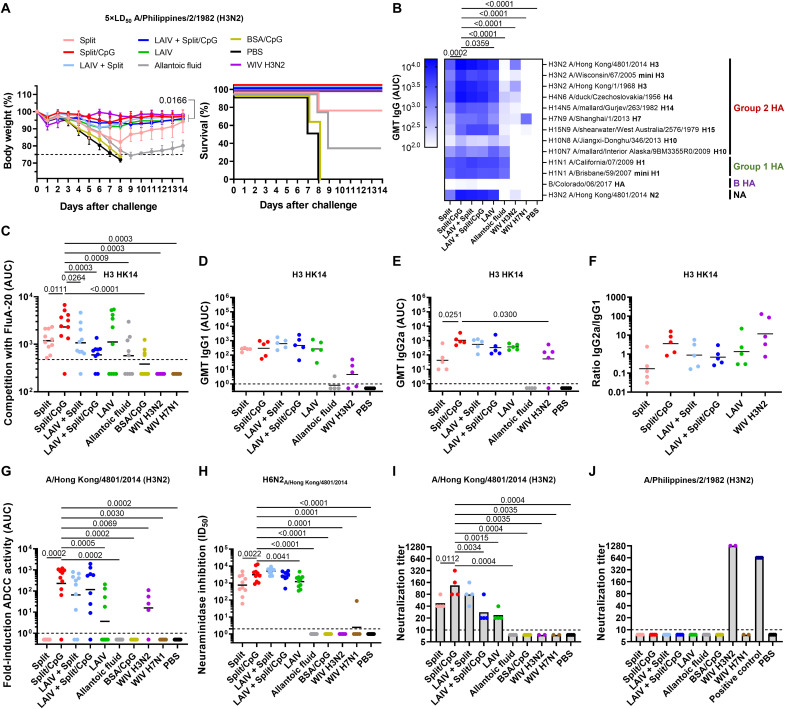
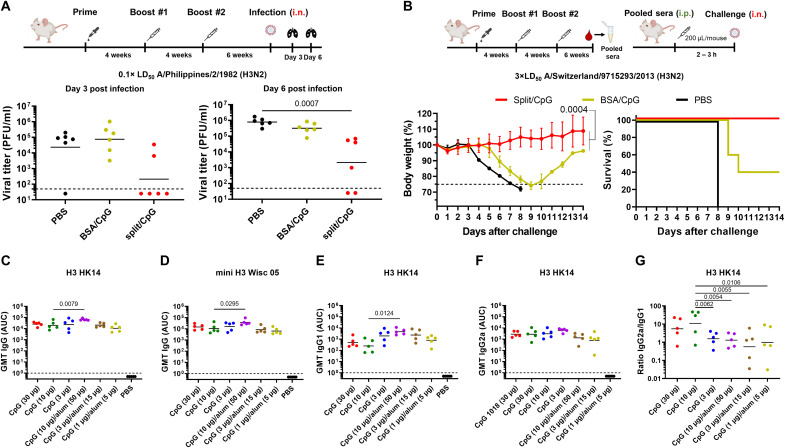
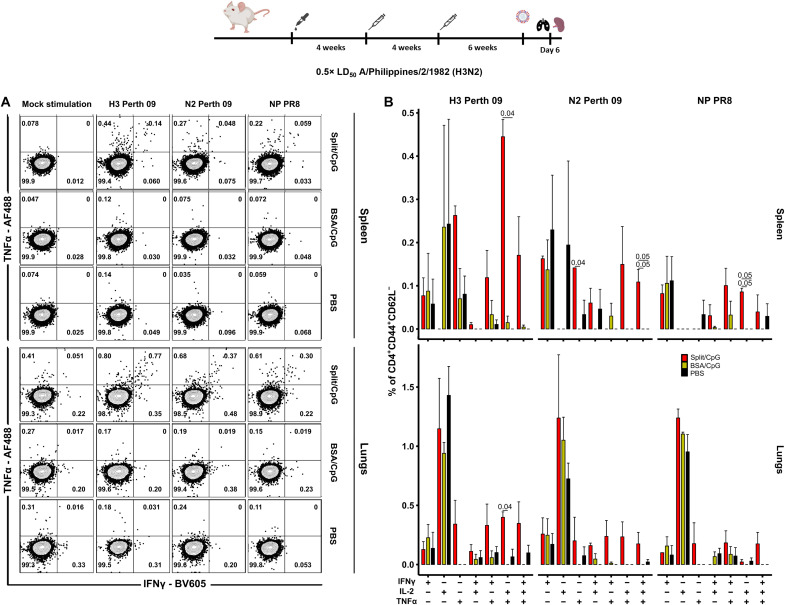
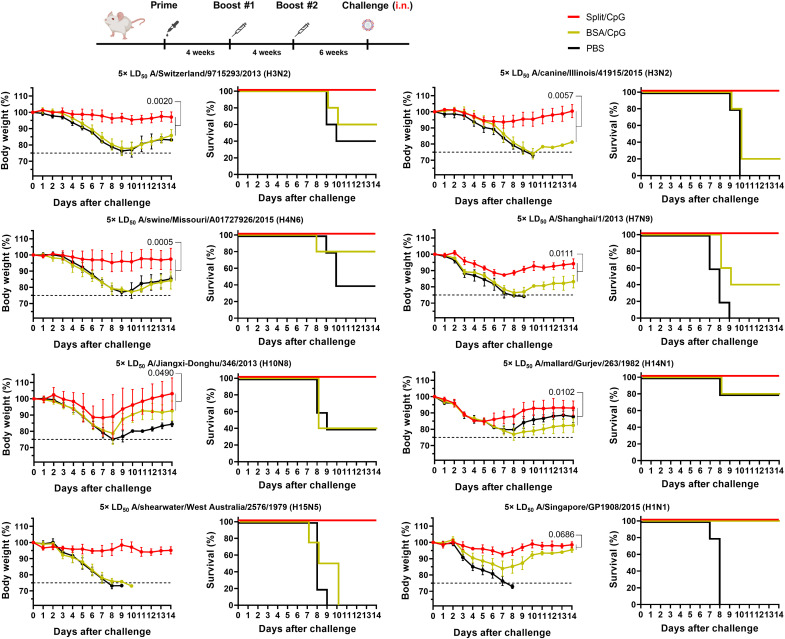
Seasonal influenza virus vaccines are effective when they are well matched to circulating strains. Because of antigenic drift/change in the immunodominant hemagglutinin (HA) head domain, annual vaccine reformulations are necessary to maintain a match with circulating strains. In addition, seasonal vaccines provide little to no protection against newly emerging pandemic strains. Sequential vaccination with chimeric HA (cHA) constructs has been proven to direct the immune response toward the immunosubdominant but more conserved HA stalk domain. In this study, we show that immunization with group 2 cHA split vaccines in combination with the CpG 1018 adjuvant elicits broadly cross-reactive antibodies against all group 2 HAs, as well as systemic and local antigen-specific T cell responses. Antibodies elicited after sequential vaccination are directed to conserved regions of the HA such as the stalk and the trimer interface and also to the N2 neuraminidase (NA). Immunized mice were fully protected from challenge with a broad panel of influenza A viruses.


Figures

Fig. 1.
Fig. 1.. Group 2 cHA vaccination strategy and experimental design.
(A) Timeline of global evolutionary frequencies of H3N2 viruses (02 December 2010 to 03 June 2022). The graph was adapted from nextstrain/flu/seasonal/h3n2/ha/12y (accessed on 10 November 2022) (78). (B) Schematic of sequential vaccination with group 2 cHA constructs to induce antibodies that target the immunosubdominant HA stalk domain as envisioned in humans with preexisting immunity to influenza virus. (C) Cladogram of HAs from the influenza viruses used in this study for challenge and of recombinant HA proteins used for serology analysis. HAs from challenge viruses are marked with an asterisk. The tree was constructed using amino acid sequences aligned in Clustal Omega (79) and visualized with the FigTree software (tree.bio.ed.ac.uk/software/figtree/). Strain designations can be found in Materials and Methods. (D) Different groups of BALB/c mice (n = 10) were primed i.n. with either a sublethal infection of the B-cH5/1 virus [105 plaque-forming units (PFU) per mouse] or PBS. After 4 weeks, mice were vaccinated with cH15/3HK14N2HK14 split vaccine (1 μg HA per mouse), BSA, or whole inactivated A/Philippines/2/1982 (H3N2, X-79) or A/Hunan/02285/2017 (H7N1) virus (WIV, positive control) via the i.m. route. Five mice per group were used for WIV control groups. Alternatively, mice were also infected with cH15/3HK14N2HK14 LAIV (105 PFU per mouse) i.n., or with allantoic fluid (AF), or PBS delivered i.n. After four additional weeks, mice were vaccinated/infected in the same manner but with cH4/3HK14N2HK14 split vaccine or LAIV. Groups coadministered with the CpG 1018 adjuvant (Adj) received a dose of 30 μg CpG 1018 per mouse. Six weeks after the second boost, mice were bled and challenged with 5× LD50 of the heterologous A/Philippines/2/1982 (H3N2, X-79) virus. This vaccination experiment was performed in two sets of independent mice (n = 5 mice per set) for serum analysis. Only one set of mice was challenged.
Fig. 2.
Fig. 2.. Vaccination with group 2 cHA constructs protects mice from lethal challenge and elicits cross-reactive antibodies.
(A) Weight loss and survival plots of mice (n = 5) challenged with 5× LD50 of A/Philippines/2/1982 (H3N2, X-79) (average and SD). Lines in the survival graphs are nudged to allow for distinction between overlapping groups. (B) ELISA geometric mean titers (GMT) of total serum IgG responses of the two sets of mice (n = 10) against a variety of influenza A and B virus HA and vaccine-matched NA protein. Comparisons were performed by considering all IgG responses to all tested influenza virus antigens in the split/CpG group and comparing these to the other groups. (C) Serum competition ELISA for two sets of vaccinated mice (n = 10) with the trimer interface mAb FluA-20 against the H3 HK14 protein. (D and E) GMT and ratio (F) of individual serum IgG1 and IgG2a responses against the vaccine matched H3 HK14 protein (n = 5). (G) Serum from the two sets of vaccinated mice (n = 10) was analyzed for ADCC reporter activity against the HK14 virus (fold induction over blank). (H) NAI assay of sera from the two sets of mice (n = 10) against an H6N2 reassortant virus expressing the N2 of HK14. NI activity was plotted as ID50. (I and J) Neutralizing activity of mouse sera against A/Philippines/2/1982 (H3N2, X-79) and HK14. Mouse sera from each one of the sets of vaccinated mice (n = 5) were pooled within each group from each set and analyzed in technical duplicate. The X-79 H3 head mAb 1F12 was used as a positive control (30 µg/mL). GMTs are shown as black line. Limit of detection (LoD): ELISA/ADCC = 1, competition ELISA = 476 (GMT of PBS group), NAI = 2, microneutralization = 10. Half the value of the LoD was assigned to negative samples. Statistical analyses were performed using one-way analysis of variance (ANOVA) corrected for Dunnett’s multiple comparisons test. Only statistically significant P values (<0.05) are shown. Experiments were conducted once.
Fig. 3.
Fig. 3.. Lung viral loads and serum passive transfer and dose–de-escalation experiments.
(A) Day 3 and day 6 lung viral load of BALB/c mice (n = 6) vaccinated following the same vaccination regimen as shown in the previous experiment, and challenged with A/Philippines/2/1982 (H3N2, X-79). LoD was 50 PFU/ml, negative samples were assigned a titer of 25 PFU/ml. The GMT of viral titers are also shown. (B) Sera from sequentially vaccinated DBA/2J mice were pooled and transferred into naïve DBA/2J mice (n = 5), which were challenged with the heterologous A/Switzerland/9715293/2013 (H3N2) virus and monitored for weight loss and survival. Average and SD are shown. Statistical comparison of Split and Split/CpG weight loss curves is also indicated. Lines in the survival graphs are nudged to allow for distinction between overlapping groups. (C and D) GMT of total serum IgG responses from the dose–de-escalation experiment of CpG 1018 and combination with alum against the H3 HK14 protein and a stabilized headless H3 protein (mini H3) from the A/Wisconsin/67/2005 (H3N2) virus, respectively. (E and F) Serum IgG1 and IgG2a responses from the dose–de-escalation experiment of CpG 1018 and combination with alum against the H3 HK14 protein. (G) Ratio of IgG2a to IgG1 responses against the H3 HK14 protein. The GMTs are shown as black line. The LoD for ELISA was defined as 1, and 0.5 was assigned to negative samples. In all cases, mice vaccinated with split vaccines and BSA were initially primed with the B-cH5/1 virus. Statistical analyses were performed using one-way ANOVA corrected with the nonparametric Dunn’s test for viral titers and one-way ANOVA corrected for Dunnett’s multiple comparisons test for other assays. Only statistically significant P values (<0.05) are shown. Experiments were conducted once except for the lung titer experiments which were conducted twice (pooled data are shown). i.p., intraperitoneal.
Fig. 4.
Fig. 4.. Systemic and local CD4+ EM T cell responses are induced by split vaccines.
(A) Representative flow cytometry plots showing the percentage of IFNγ- and TNFα-producing CD4+ EM T lymphocytes in mouse spleens and lungs 6 days after challenge with A/Philippines/2/1982 (H3N2, X-79) virus. T cells were stimulated with overlapping peptide libraries covering the H3 protein sequence from A/Perth/16/2009 (H3N2) virus, the N2 protein from A/Perth/16/2009 (H3N2) virus, and the NP protein from A/Puerto Rico/8/1934 (H1N1) virus. Different groups of BALB/c mice were sequentially vaccinated with PBS, BSA + 10 μg per mouse of CpG 1018, or 1 μg of HA per mouse of split vaccine +10 μg per mouse of CpG 1018 following the vaccination regimen as shown for previous experiments. (B) Percentage of different cytokine-producing cell populations within the total CD4+ EM T cell subset (n = 3) after background subtraction. Average and SD values are shown. In all cases, mice vaccinated with split vaccines and BSA were initially primed with the B-cH5/1 virus. Statistical analyses were performed using one-way ANOVA corrected for Dunn’s multiple comparisons test. Only statistically significant P values (<0.05) are shown. Experiments were conducted once.
Fig. 5.
Fig. 5.. Sequential vaccination with group 2 cHA split vaccines protects mice from challenge with a broad spectrum of influenza A viruses.
Different groups of mice (n = 5) were sequentially vaccinated with 1 μg of HA per mouse of split vaccine adjuvanted with 10 μg per mouse of CpG 1018 as shown for previous experiments, and challenged with the heterologous A/Switzerland/9715293/2013 (H3N2) and A/canine/Illinois/41915/2015 (H3N2) viruses, the heterosubtypic group 2 A/swine/Missouri/A01727926/2015 (H4N6), A/Shanghai/1/2013 (H7N9), A/Jiangxi-Donghu/346/2013 (H10N8), A/mallard/Gurjev/263/1982 (H14N1), A/wedge-tailed shearwater/Western Australia/2576/1979 (H15N5) viruses, and the group 1 A/Singapore/GP1908/2015 (H1N1) virus. Body weight and survival were monitored over the course of 14 days after the challenge. Vaccination and challenge experiments with H3N2, H4N6, and H14N1 viruses were conducted in DBA/2J mice, whereas H7N9, H10N8, H15N5, and H1N1 challenge experiments were performed in BALB/c mice. The average weight values and SD are shown. In all cases, mice vaccinated with split vaccines and BSA were initially primed with the B-cH5/1 virus. Comparison of Split/CpG and BSA/CpG weight loss curves is shown. Statistical analyses were performed using one-way ANOVA corrected for Dunnett’s multiple comparisons test. Lines in the survival graphs are nudged to allow for distinction between the lines, which would otherwise overlap. Experiments were conducted once.

Similar articles

Cited by

References

    1. E. A. Belongia, H. Q. McLean, Influenza Vaccine Effectiveness: Defining the H3N2 Problem. Clin. Infect. Dis. 69, 1817–1823 (2019). - PubMed
    1. G. N. Okoli, F. Racovitan, T. Abdulwahid, C. H. Righolt, S. M. Mahmud, Variable seasonal influenza vaccine effectiveness across geographical regions, age groups and levels of vaccine antigenic similarity with circulating virus strains: A systematic review and meta-analysis of the evidence from test-negative design studies after the 2009/10 influenza pandemic. Vaccine 39, 1225–1240 (2021). - PubMed
    1. R. A. Neher, T. Bedford, R. S. Daniels, C. A. Russell, B. I. Shraiman, Prediction, dynamics, and visualization of antigenic phenotypes of seasonal influenza viruses. Proc. Natl. Acad. Sci. U.S.A. 113, E1701–E1709 (2016). - PMC - PubMed
    1. Y. Suzuki, Positive selection for gains of N-linked glycosylation sites in hemagglutinin during evolution of H3N2 human influenza A virus. Genes Genet. Syst. 86, 287–294 (2011). - PubMed
    1. S. Rajaram, R. Wojcik, C. Moore, R. Ortiz de Lejarazu, S. de Lusignan, E. Montomoli, A. Rossi, A. Pérez-Rubio, A. Trilla, V. Baldo, R. Jandhyala, G. Kassianos, The impact of candidate influenza virus and egg-based manufacture on vaccine effectiveness: Literature review and expert consensus. Vaccine 38, 6047–6056 (2020). - PubMed