. 2023 Oct 5;13(10):2180-2191.
doi: 10.1158/2159-8290.CD-22-1340.

Early-Stage Breast Cancer Detection in Breast Milk

Affiliations

Early-Stage Breast Cancer Detection in Breast Milk

Cristina Saura et al. Cancer Discov. .

Abstract

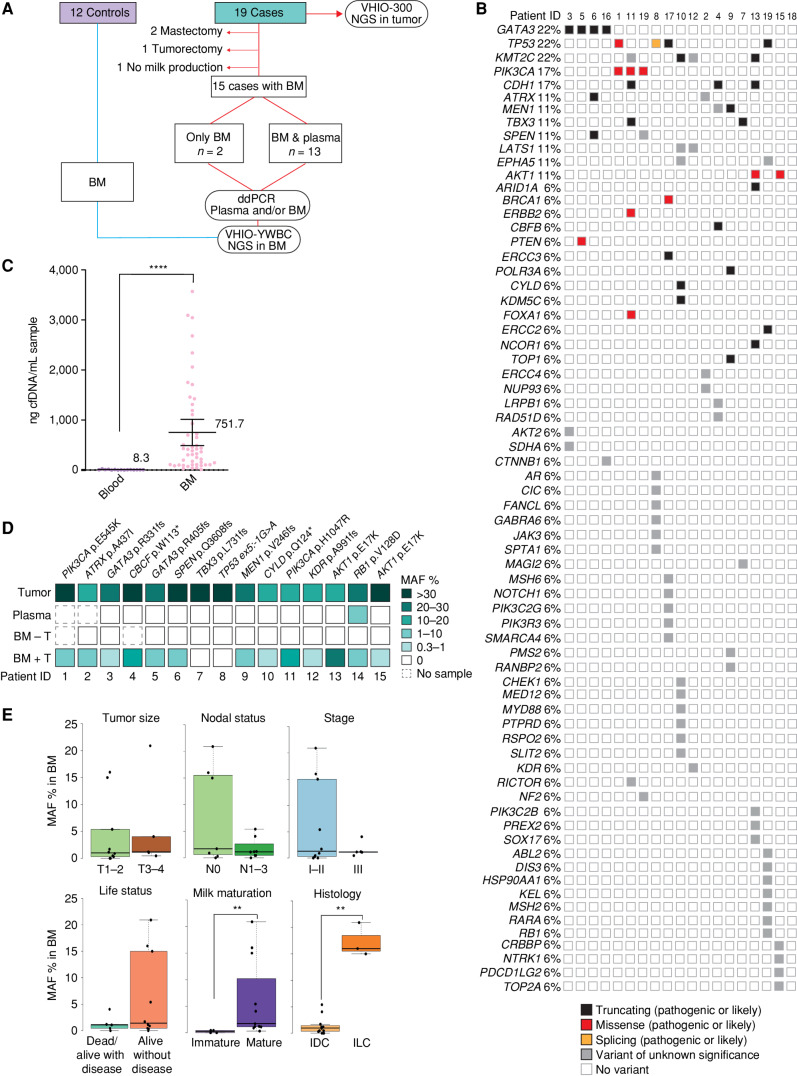
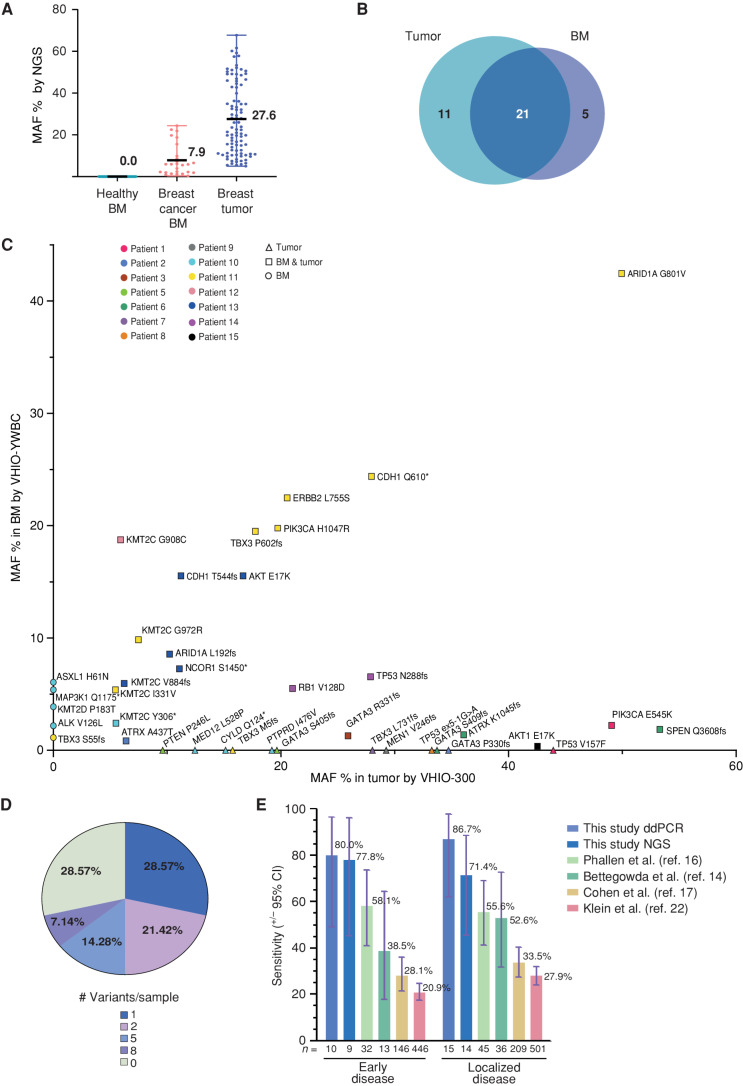
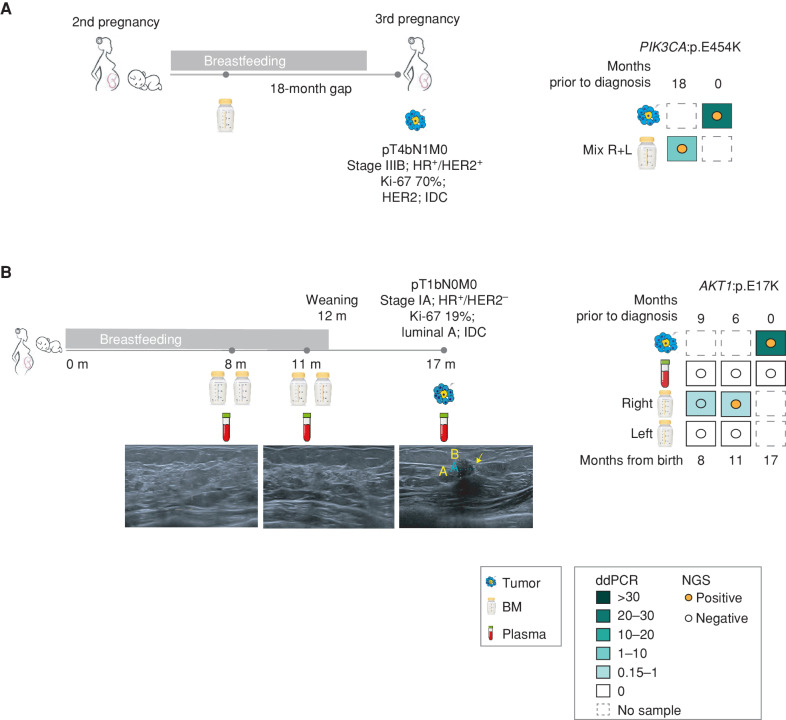
Breast cancer occurring during pregnancy (PrBC) and postpartum (PPBC) is usually diagnosed at more advanced stages compared with other breast cancer, worsening its prognosis. PPBC is particularly aggressive, with increased metastatic risk and mortality. Thus, effective screening methods to detect early PrBC and PPBC are needed. We report for the first time that cell-free tumor DNA (ctDNA) is present in breast milk (BM) collected from patients with breast cancer. Analysis of ctDNA from BM detects tumor variants in 87% of the cases by droplet digital PCR, while variants remain undetected in 92% of matched plasma samples. Retrospective next-generation sequencing analysis in BM ctDNA recapitulates tumor variants, with an overall clinical sensitivity of 71.4% and specificity of 100%. In two cases, ctDNA was detectable in BM collected 18 and 6 months prior to standard diagnosis. Our results open up the potential use of BM as a new source for liquid biopsy for PPBC detection.

Significance: For the first time, we show that BM obtained from patients with breast cancer carries ctDNA, surpassing plasma-based liquid biopsy for detection and molecular profiling of early-stage breast cancer, even prior to diagnosis by image. See related commentary by Cunningham and Turner, p. 2125. This article is featured in Selected Articles from This Issue, p. 2109.


Figures

Figure 1. Genomic profile of tumor tissue and matched plasma and BM ctDNA. A, Cohorts included in the study, samples, and workflow. ddPCR, droplet digital PCR; NGS, next-generation sequencing. B, Oncoprint of all solid tumors analyzed by NGS from the case cohort (n = 19). C, cfDNA concentration purified from blood samples of the case group (n = 12) and compared with BM samples collected from the control and case groups (n = 49). Individual values, mean, and 95% confidence interval are included. Nonparametric two-sided Mann–Whitney–Wilcoxon test was performed (****, P < 0.0001). D, Targeted detection of selected clonal variants by ddPCR in the parallel tumor, plasma, and BM samples from the affected breast (BM + T n = 15; BM – T n = 13) from the case cohort. E, Association between MAF percentage and tumor size, nodal status, disease stage, current life status, milk maturation, and histology (Mann–Whitney–Wilcoxon test; **, P < 0.01). IDC, invasive ductal carcinoma; ILC, invasive lobular carcinoma.
Figure 1.
Genomic profile of tumor tissue and matched plasma and BM ctDNA. A, Cohorts included in the study, samples, and workflow. ddPCR, droplet digital PCR; NGS, next-generation sequencing. B, Oncoprint of all solid tumors analyzed by NGS from the case cohort (n = 19). C, cfDNA concentration purified from blood samples of the case group (n = 12) and compared with BM samples collected from the control and case groups (n = 49). Individual values, mean, and 95% confidence interval are included. Nonparametric two-sided Mann–Whitney–Wilcoxon test was performed (****, P < 0.0001). D, Targeted detection of selected clonal variants by ddPCR in the parallel tumor, plasma, and BM samples from the affected breast (BM + T n = 15; BM – T n = 13) from the case cohort. E, Association between MAF percentage and tumor size, nodal status, disease stage, current life status, milk maturation, and histology (Mann–Whitney–Wilcoxon test; **, P < 0.01). IDC, invasive ductal carcinoma; ILC, invasive lobular carcinoma.
Figure 2. NGS-based detection of breast cancer in BM using a targeted sequencing assay. A, Variants detected by the NGS panel VHIO-YWBC in healthy BM (n = 0) and breast cancer BM (n = 26), as well as in tumor tissue with the VHIO-300 NGS panel (n = 94), represented as % of MAF. The mean and range are depicted in the chart. B, Number of variants detected in common between BM and matched tumor tissue from the case cohort, focusing only on genes captured by both the VHIO-YWBC and VHIO-300 panels. C, Variants detected by NGS in BM samples by VHIO-YWBC (y-axis) vs. variants detected by the VHIO-300 panel in formalin-fixed, paraffin embedded (FFPE) solid tumor biopsies (x-axis) only in genes common to both panels. Data are represented as MAF %. Color coding is used to discriminate patients. The shape of the symbols represents variants detected only in BM (circles), only in FFPE (triangles), or in both (squares). D, Percentage of cases according to the number of variants detected in BM by NGS (n = 14). E, Sensitivity of our ddPCR and NGS approaches for the detection of ctDNA in early (stages I–II) and localized (stages I–III) disease and compared with four reported methods for early breast cancer detection from plasma; data are represented as a percentage, with exact mean numbers and plus/minus a 95% confidence interval (CI).
Figure 2.
NGS-based detection of breast cancer in BM using a targeted sequencing assay. A, Variants detected by the NGS panel VHIO-YWBC in healthy BM (n = 0) and breast cancer BM (n = 26), as well as in tumor tissue with the VHIO-300 NGS panel (n = 94), represented as % of MAF. The mean and range are depicted in the chart. B, Number of variants detected in common between BM and matched tumor tissue from the case cohort, focusing only on genes captured by both the VHIO-YWBC and VHIO-300 panels. C, Variants detected by NGS in BM samples by VHIO-YWBC (y-axis) vs. variants detected by the VHIO-300 panel in formalin-fixed, paraffin embedded (FFPE) solid tumor biopsies (x-axis) only in genes common to both panels. Data are represented as MAF %. Color coding is used to discriminate patients. The shape of the symbols represents variants detected only in BM (circles), only in FFPE (triangles), or in both (squares). D, Percentage of cases according to the number of variants detected in BM by NGS (n = 14). E, Sensitivity of our ddPCR and NGS approaches for the detection of ctDNA in early (stages I–II) and localized (stages I–III) disease and compared with four reported methods for early breast cancer detection from plasma; data are represented as a percentage, with exact mean numbers and plus/minus a 95% confidence interval (CI).
Figure 3. Early detection of breast cancer through BM ctDNA analysis. A, Description of case #1, timeline, sample collection, and test results by ddPCR and NGS. Patient 1 was diagnosed with PrBC during her third pregnancy. The patient provided a mixture of both breasts from the lactancy of a previous pregnancy and collected 18 months prior to diagnosis. HR, hormone receptor; R + L, right and left. B, Description of positive high-risk case BC-15, timeline (m = months from childbirth), sample collection, and the corresponding right breast ultrasound images. The third image taken at a 17-month time point corresponds to the time of clinical diagnosis. The yellow arrow points to the malignant lesion observed and its measurement by image (A = 7.4 mm; B = 6.4 mm). The different samples collected and test results obtained by ddPCR and NGS. Colored squares represent the MAF % of the pathogenic variant detected by ddPCR. Colored dots represent the detection of the same variant by NGS.
Figure 3.
Early detection of breast cancer through BM ctDNA analysis. A, Description of case #1, timeline, sample collection, and test results by ddPCR and NGS. Patient 1 was diagnosed with PrBC during her third pregnancy. The patient provided a mixture of both breasts from the lactancy of a previous pregnancy and collected 18 months prior to diagnosis. HR, hormone receptor; R + L, right and left. B, Description of positive high-risk case BC-15, timeline (m = months from childbirth), sample collection, and the corresponding right breast ultrasound images. The third image taken at a 17-month time point corresponds to the time of clinical diagnosis. The yellow arrow points to the malignant lesion observed and its measurement by image (A = 7.4 mm; B = 6.4 mm). The different samples collected and test results obtained by ddPCR and NGS. Colored squares represent the MAF % of the pathogenic variant detected by ddPCR. Colored dots represent the detection of the same variant by NGS.

Comment in

References

    1. Amant F, Lefrere H, Borges VF, Cardonick E, Lambertini M, Loibl S, et al. . The definition of pregnancy-associated breast cancer is outdated and should no longer be used. Lancet Oncol 2021;22:753–4. - PMC - PubMed
    1. Lyons TR, Schedin PJ, Borges VF. Pregnancy and breast cancer: when they collide. J Mammary Gland Biol Neoplasia 2009;14:87–98. - PMC - PubMed
    1. Callihan EB, Gao D, Jindal S, Lyons TR, Manthey E, Edgerton S, et al. . Postpartum diagnosis demonstrates a high risk for metastasis and merits an expanded definition of pregnancy-associated breast cancer. Breast Cancer Res Treat 2013;138:549–59. - PMC - PubMed
    1. Amant F, Loibl S, Neven P, Van Calsteren K. Malignancies in pregnancy 2 breast cancer in pregnancy. Lancet 2012;379:570–9. - PubMed
    1. Amant F, Von Minckwitz G, Han SN, Bontenbal M, Ring AE, Giermek J, et al. . Prognosis of women with primary breast cancer diagnosed during pregnancy: results from an international collaborative study. J Clin Oncol 2013;31:2532–9. - PubMed

Publication types