. 2023 Sep 13;14(1):5632.
doi: 10.1038/s41467-023-41407-2.

Human OPRM1 and murine Oprm1 promoter driven viral constructs for genetic access to μ-opioidergic cell types

Affiliations

Human OPRM1 and murine Oprm1 promoter driven viral constructs for genetic access to μ-opioidergic cell types

Gregory J Salimando et al. Nat Commun. .

Abstract

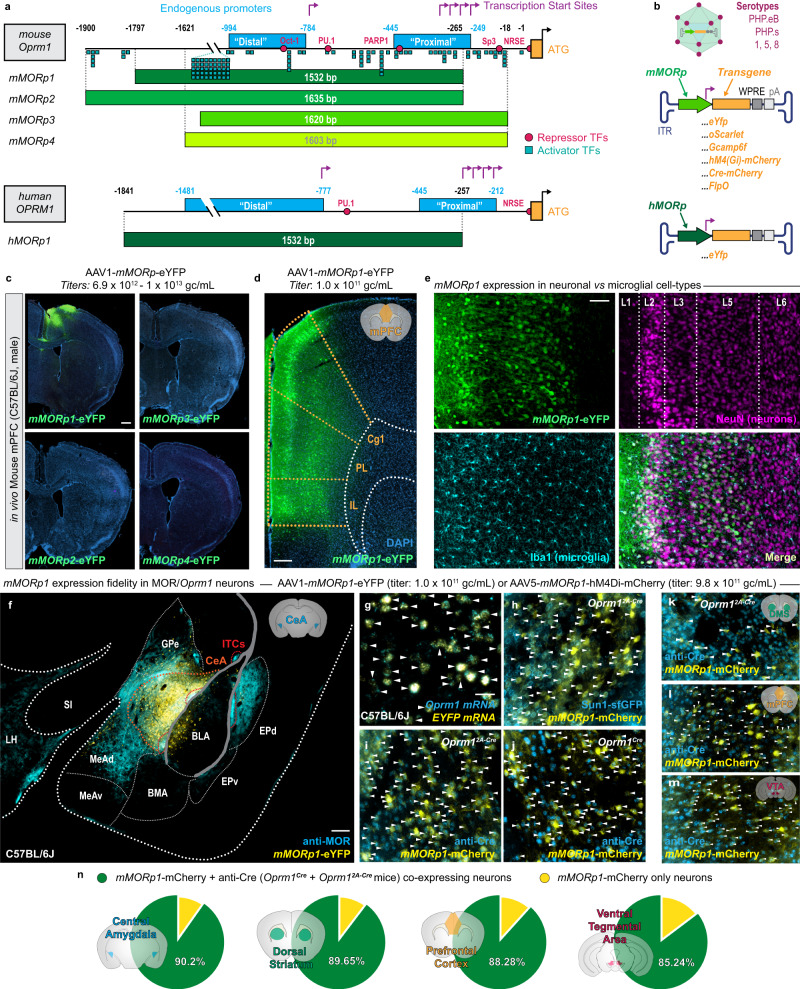
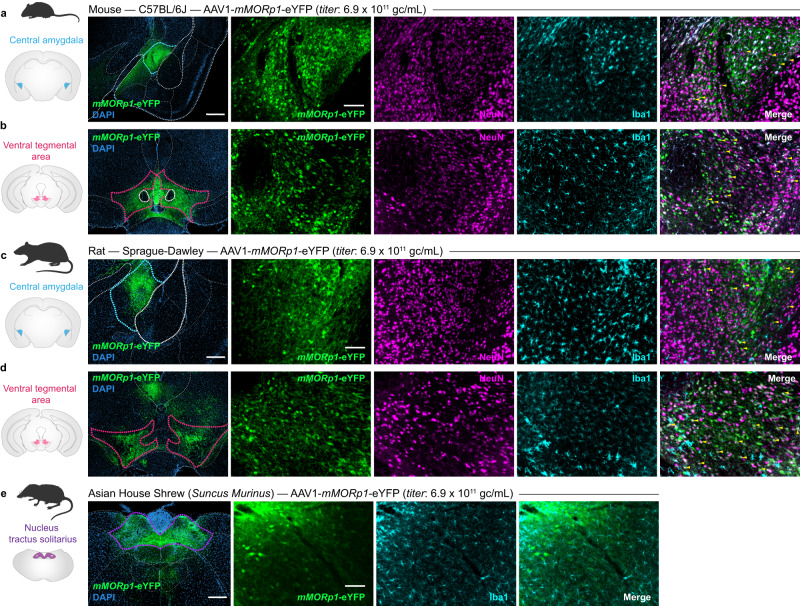
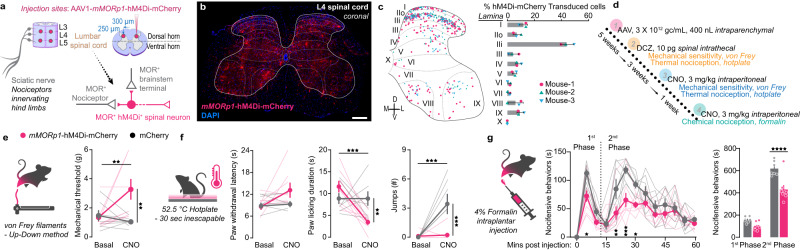
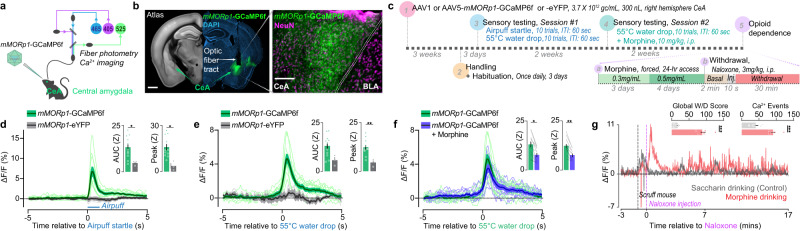
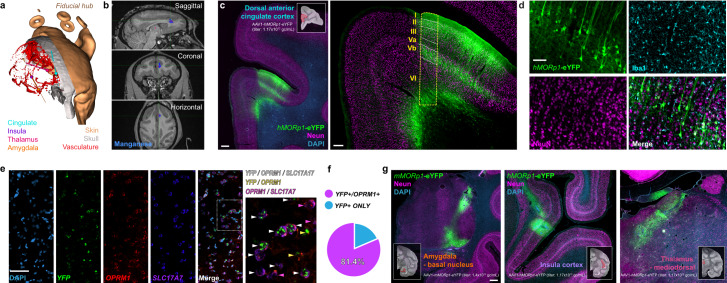
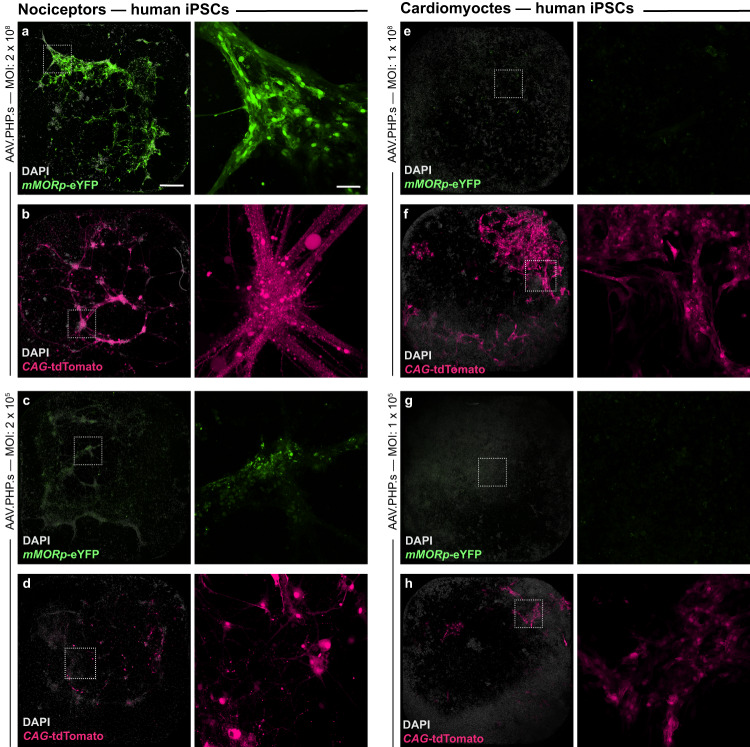
With concurrent global epidemics of chronic pain and opioid use disorders, there is a critical need to identify, target and manipulate specific cell populations expressing the mu-opioid receptor (MOR). However, available tools and transgenic models for gaining long-term genetic access to MOR+ neural cell types and circuits involved in modulating pain, analgesia and addiction across species are limited. To address this, we developed a catalog of MOR promoter (MORp) based constructs packaged into adeno-associated viral vectors that drive transgene expression in MOR+ cells. MORp constructs designed from promoter regions upstream of the mouse Oprm1 gene (mMORp) were validated for transduction efficiency and selectivity in endogenous MOR+ neurons in the brain, spinal cord, and periphery of mice, with additional studies revealing robust expression in rats, shrews, and human induced pluripotent stem cell (iPSC)-derived nociceptors. The use of mMORp for in vivo fiber photometry, behavioral chemogenetics, and intersectional genetic strategies is also demonstrated. Lastly, a human designed MORp (hMORp) efficiently transduced macaque cortical OPRM1+ cells. Together, our MORp toolkit provides researchers cell type specific genetic access to target and functionally manipulate mu-opioidergic neurons across a range of vertebrate species and translational models for pain, addiction, and neuropsychiatric disorders.


Conflict of interest statement

G.C, K.D., C.R. and G.J.S. are listed as inventors on a provisional patent application filed on November 11th, 2022 through both the University of Pennsylvania and Stanford University regarding the custom sequences used to develop, and the applications of, both the mMORp1 and hMORp1 constructs (patent application number: 63/383,462 462 ‘Human and Murine Oprm1 Promotes and Uses Thereof’). The remaining authors declare no competing interests.

Figures

Fig. 1
Fig. 1. Development and validation of murine and human mu opioid receptor promoter (MORp) driven viral constructs.
a DNA sequence for the murine Oprm1 (upper) and human OPRM1 (lower) promoter regions, including the approximate locations of several transcriptional elements such as repressor and activator transcription factors (TFs), transcription start sites and promoter elements, as determined via PROMO and Eukaryotic Promoter Database & UCSC Genome Browser analyses of the murine and human genes (Supplementary Fig. 1). The promoter region encoded by the four murine promoter constructs (mMORp1-4) and single human promoter construct (hMORp) are depicted beneath each sequence map. b mMORp and hMORp construct designs and packaging schema within adeno-associated viral (AAV) vectors of multiple different capsid serotypes. c Transduction efficacy from initial in vivo intracranial injections of the mMORp1-4-eYFP constructs into C57BL/6J mouse medial prefrontal cortex (mPFC), scale bar = 500 μm. d mPFC expression pattern with AAV1-mMORp1-eYFP across mPFC subregions, including the cingulate (Cg1), prelimbic (PL) and infralimbic (IL) cortex, scale bar = 200 μm. e Higher magnification images of the mPFC following transduction with the mMORp1 viral construct. Amplification of the eYFP signal, along with staining for both neuronal (NeuN) and microglial (Iba1) markers demonstrate selective transduction of neurons, with staining for additional glial markers to further verify this shown in Supplementary Fig. 5. Cortical layer division markers (Layers 1–6) highlight viral spread and efficiency, scale bar = 100 μm. f Overlap of mMORp1-eYFP viral expression and endogenous mu opioid receptor (MOR) immunoreactivity within the central amygdala (CeA) (denoted by blue outline), but not surrounding amygdalar subregions of a C57BL/6J mouse, using a knock-out mouse-validated anti-MOR antibody (Supplementary Fig. 3). Basolateral amygdala (BLA), medial anterodorsal amygdala (MeAd), medial anteroventral amygdala (MeAv), basomedial amygdala (BMA), dorsal entopeduncular nucleus (EPd), ventral entopeduncular nucleus (EPv), intercalcated cells (ITCs), globus pallidus externa (GPe), substantia innominota (SI), and lateral hypothalamus (LH); scale bar = 200 µm. g RNAscope FISH in the CeA of a mMORp1-eYFP injected mouse examining co-localized of Oprm1 and eYfp mRNA transcripts. CeA co-localization of AAV5-mMORp1-hM4Di-mCherry and Oprm12A-Cre:Sun1-sfGFP reporter nuclei (h) or anti-Cre staining (i). Co-expression of AAV5-mMORp1-hM4Di-mCherry with anti-Cre immunoreactive cells in the CeA of Oprm1Cre mice (j), and the dorsomedial striatum (DMS) (k), mPFC (l) and ventral tegmental area (VTA, m) of Oprm12A-Cre mice. n Averaged number of mMORp1-mCherry+/anti-Cre+ cells compared to mMORp1-mCherry+/anti-Cre− cells quantified from successfully transduced brain regions of interest (from left or right hemispheres, or both) of Oprm1Cre and Oprm12A-Cre:Sun1 mice within the CeA (~90.2%, N = 5, n = 9), DMS (~89.65%, N = 5, n = 7), mPFC (~88.28%, N = 3, n = 4), and VTA (~85.24%, N = 5, n = 8). Detailed information of total counts and quantification for each region within individual mouse lines can be found in Supplementary Fig. 4. Scale bar = 100 μm for gm. White arrow heads denote cells in which co-labeling for Oprm1 and EYFP transcript (g) or mMORp1-mCherry and anti-Cre signal (hm) is observed.
Fig. 2
Fig. 2. mMORp viral transduction within putative MOR+ cells in multiple brain regions across mammalian model organisms.
a Mouse (C57BL/6 J) CeA expression of AAV1-mMORp-eYFP (titer: 1 × 1011 gc/mL). Left: overview of the CeA (blue borders) and surrounding regions (white borders). Right: higher magnification images of mMORp-eYFP (anti-GFP amplified) with neuronal (NeuN) and microglial (Iba1) cell type markers. b Mouse VTA expression of AAV1-mMORp-eYFP: Left: VTA (magenta borders). Right: anti-GFP amplified eYFP, NeuN and Iba1. c Rat (Sprague-Dawley) CeA expression of AAV1-mMORp-eYFP (titer: 1 × 1012 gc/mL). Left: overview of the CeA (blue borders) and surrounding structures. Right: anti-GFP amplified eYFP, NeuN and Iba1. d Rat VTA expression of mMORp-eYFP. Left: overview of VTA (magenta borders). Right: anti-GFP amplified eYFP, NeuN and Iba1. e Shrew (Asian house shrew) area postrema/nucleus tractus solitarius (AP/NTS) expression of AAV1-mMORp-eYFP (titer: 1 × 1012 gc/mL). Left: overview of NTS (purple borders) and surrounding structures. Right: anti-GFP amplified eYFP, NeuN and Iba1. Scale bars = 100 μm (far left), 200 µm (right) for ae. Staining for additional glial markers to demonstrate transduction of predominantly neurons in rat and shrew tissue is shown in Supplementary Fig. 8 (including quantification for Iba1 and mMORp-eYFP staining demonstrated in representative images above). Yellow arrows indicated representative NeuN/eYFP positive cells within merged images.
Fig. 3
Fig. 3. mMORp-hM4Di spinal cord expression and chemogenetic-induced analgesia.
a AAV1-mMORp-hM4Di-mCherry injection schema within the lumbar spinal cord in C57BL/6J mice to inhibit dorsal horn MOR+ cells and not MOR+ nociceptors or descending brain stem circuits. b mMORp-hM4Di-mCherry expression and spread across the L4 spinal cord; scale bar = 100 μm. c Location map and quantification of mMORp-hM4Di-mCherry+ cells across the Rexed laminae in the dorsal and ventral horns (N = 3 mice). d Experimental timeline for viral injections and chemogenetic behavioral testing. e Mechanical sensory thresholds (von Frey Up-Down testing) in mMORp-hM4Di-mCherry injected mice (N = 9 mice) compared with hSyn-mCherry injected controls (N = 7 mice) at baseline and 30 min following systemic CNO administration (3 mg/kg; Two-way ANOVA + Bonferroni: main effect: P = 0.011 [viral treatment × CNO treatment]; multiple comparisons: basal v. CNO, P = 0.990 [mCherry], P = 0.006 [hM4Di]). Average response changes per group shown as thick gray (mCherry) or red (hM4Di) lines. Individual mice are shown as thin gray and red lines. f Nocifensive behaviors observed on an inescapable 52.5 °C hot plate over a 30-sec trial for the same animals (N = 9 hM4Di-mCherry, N = 7 mCherry): latency (sec) to hind paw withdrawal (two-way ANOVA + Bonferroni: main effect: P = 0.085 [viral treatment], P = 0.162 [CNO treatment]; multiple comparisons: basal v. CNO, P > 0.999 [mCherry], P = 0.067 [hM4Di]), hind paw licking duration (two way ANOVA + Bonferroni; main effects: P = 0.008 [viral treatment × CNO treatment], P = 0.008 [viral treatment]; multiple comparisons: basal v. CNO, P > 0.999 [mCherry], P = 0.0007 [hM4Di]), and total jumping bouts (two way ANOVA + Bonferroni; main effects: P = 0.004 [viral treatment × CNO treatment], P = 0.002 [viral treatment], P = 0.006 [CNO treatment]; multiple comparisons: basal v. CNO, P = 0.0006 [mCherry], P > 0.999 [hM4Di]). g Time course (left) and cumulative global scoring (right) of nocifensive behaviors (licking, biting, jumping, etc.) observed in the formalin injection test during the first and second phases of testing in mMORp-hM4Di-mCherry (N = 9) and control (N = 7) animals at basal and post-CNO time points (Time course: two-way ANOVA + Bonferroni; main effects: P = 0.006 [time bin × nocifensive behaivors], P < 0.0001 [time bin], P = 0.001 [nocifensive behaviors]; multiple comparisons: mCherry v. hM4Di, P = 0.014 [5 min], P = 0.008 [20 min], P = 0.0002 [25 min], P = 0.48 [30 min]. Global scoring: two-way ANOVA + Bonferroni; main effects: P = 0.006 [stage × nocifensive behaviors], P < 0.0001 [stage], P = 0.001 [nocifensive behaviors]; multiple comparisons: mCherry v. hM4Di, P = 0.222 [1st stage], P < 0.0001 [2nd stage]). All data are presented as means ± SEM *P < 0.05, **P < 0.01, ***P < 0.001, ****P < 0.0001.
Fig. 4
Fig. 4. mMORp-GCaMP6f in vivo photometry recording of MOR+ neural population calcium activity in response to noxious stimulation, opioid administration, and opioid withdrawal.
a In vivo fiber photometry recording set up and overall experimental design, as well as AAV1/5-mMORp-GCaMP6f injection schema in C57BL/6J mice. b mMORp-GCaMP6f viral targeting and transduction efficiency within CeA neurons (NeuN+) and fiber optic implant placement; scale bars = 500 μm (left), 100 m (right). c Photometry experimental timeline for mMORp-GCaMP6f (N = 12) and mMORp-eYFP (N = 3) injected mice. d Normalized calcium-mediated activity responses observed in the CeA of mMORp-GCaMP6f and mMORp-eYFP mice in response to 10 air puff applications (1-min inter-stimulation interval. Thick lines = averaged responses, thin lines = individual mice average responses to all 10 stimulations). Inset graphs depict differences in the area under the curve (AUC) quantified between averaged GCaMP6f and eYFP control response (two tailed unpaired t-test, P = 0.035) and peak z-score between groups (two tailed unpaired t-test, P = 0.011). e Plots for normalized, calcium-mediated responses to the application of 10 ~ 55 °C hot water droplets to the left hind paw (1-min inter-stimulation interval). Thick lines = average group response, thin lines = individual mice averaged response. Insets show AUC (two tailed unpaired t-test, P = 0.051) and peak z-score (two tailed unpaired t-test, P = 0.009) comparisons for eYFP (N = 3) and GCaMP6f (N = 12) expressing mice. f Normalized, calcium-mediated responses to an additional round of hot water hind paw stimulations in the mMORp-GCaMP6f mice (N = 12) before and 30 min after morphine (i.p., 10 mg/kg). Opioid-naïve responses (green) and post-morphine responses (blue) are shown as grouped averages (thick lines) and individual averages (thin lines) following 10 stimulations. Insets show AUC (two tailed unpaired t-test, P = 0.016) and peak z-scores (two tailed unpaired t-test, P = 0.005) comparisons between the pre- and post-morphine responses in mMORp-GCaMP6f mice. Gray lines track changes in AUC and peak z-score for individual mice in pre- and post-morphine treatment conditions. g Normalized, calcium-mediated responses from mMORp-GCaMP6f mice undergoing an escalating forced morphine drinking paradigm (Fig. 4c) for morphine drinking (red, N = 6 mice) or saccharin drinking (gray, N = 5 mice) subjects following naloxone induced precipitated withdrawal (i.p., 3 mg/kg). Insets show the global withdrawal behavior score (left) and total calcium-mediated events (right) post-naloxone between morphine and saccharin mice (W/D score: two tailed unpaired t-test, P = 0.0001; Ca2+ events: two tailed unpaired t-test, P = 0.0007). All data are presented as means ± SEM *P < 0.05, **P < 0.01, ***P < 0.001.
Fig. 5
Fig. 5. mMORp driven recombinases and PHP.eB/PHP.S capsid packaging support intersectional viral strategies for gaining genetic access to CNS and PNS opioidergic cells/circuits.
C57BL/6J mice injected with a 9 µl:1 µl mix of AAV8-mMORp-mCherry-IRES-Cre and a Cre-dependent AAV9-hDlx-FLEx-eGFP with intersectional expression in putative MOR+/GABAergic neurons in mPFC (a) and somatosensory cortex (S1, b). Insets in a and b show higher magnification images of hDlx-FLEx-eGFP cells (green) overlap with mMORp-mCherry-IRES-Cre cells (magenta); scale bars = 200 μm and 100 μm for insets. C57BL/6J mice injected in mPFC (c) or S1 (d) with a 9 µl:1 µl mix of AAV1-mMORp-FlpO and Flp-dependent AAV9-Ef1α-fDIO-mCherry. Inset high magnification images show mCherry+ cells. e CNS expression in representative sections from the spinal cord (coronal) and brain (sagittal along the medial-lateral axis relative to Bregma; coronal sections are shown in Supplementary Fig. 10) of C57BL/6J mice injected retro-orbitally with AAV.PHP.eB-mMORp-eYFP virus; scale bars = 500 μm (spinal cord sections) and 1000 µm (sagittal sections). f PNS dorsal root ganglia (DRG) FISH from C57BL/6J mice with intracerebroventrical injection of either AAV.PHP.S-mMORp-eYFP (upper) or AAV.PHP.S-CAG-tdTomato (lower). Custom cDNA probes targeting Rbfox3 (NeuN), Oprm1, EYFP and tdTomato transcripts; scale bars = 50 μm. g Quantification of total Oprm1+ cells co-labeled for tdTomato in control animals (N = 5 mice, n = 14 ROIs) compared to total Oprm1+ cells co-labeled for EYFP in PHP.S-mMORp-eYFP injected mice (N = 4 mice, n = 11 ROIs) across treatment groups (two tailed unpaired t-test with Welsh’s correction, P = 0.0437). h Summary quantification of the percent total number of cells positive for EYFP transcript (i.e., transduced by the AAV.PHP.s-mMORp-eYFP virus) that were also either positive for Oprm1 transcript (mMORp-eYFP/Oprm1+, 82.5%) or negative for Oprm1 transcript (mMORp-eYFP+ only, 17.5%) to demonstrate AAV.PHP.s-mMORp-eYFP specificity within mouse DRG neurons. Data presented as means ± SEM, *P < 0.05.
Fig. 6
Fig. 6. hMORp viral constructs drive robust transduction of putative opioidergic cells in non-human primate neural tissue.
a 3D reconstruction of the skin, skull and underlying vasculature of a rhesus macaque for pre-operative intracranial injection planning. b Post-injection manganese-enhanced MRI for AAV1-hMORp-eYFP in vivo targeting accuracy assessement (virus mixed 1:100 with 100 mM manganese solution). c Left: Dorsal anterior cingulate cortex (dACC) expression of hMORp-eYFP; scale bar = 1000 μm. Right: dACC, higher magnification with cortical layer markers; scale bar = 200 μm. d Co-expression of hMORp-eYFP with neuronal (NeuN) but not microglial (Iba1) markers; scale bar = 100 μm. Staining for additional glial markers and relevant quantification to demonstrate transduction of predominantly neurons in macaque tissue is shown in Supplementary Fig. 13. e RNAscope FISH in dACC tissue for co-expression of YFP, OPRM1, and SLC17A7 (VGLUT1) mRNA transcripts; scale bar = 100 μm, far right image = digital zoom of merged image. f Summary quantification of the total EYFP transcript positive cells quantified in sample regions of interest within dACC (upper, N = 1 dACC slice, n = 4 ROIs) with either EYFP+/OPRM1− (18.6%) or EYFP+/OPRM1+(81.4%) to demonstrate hMORp-eYFP virus expression specificity. g mMORp-eYFP expression within the basal nucleus of the amygdala, and hMORp-eYFP expression within the insular cortex and the mediodorsal thalamus following intracranial viral injections into these putative MOR expressing regions. Scale bar = 1000 μm.
Fig. 7
Fig. 7. mMORp viral transduction in human iPSC-derived MOR+ nociceptors.
Representative low (left, scale bar = 50 μm) and high (right, scale bar = 100 μm) magnification images of cultured human nociceptors treated with higher titer (1 × 1012 gc/mL, MOI: 2 × 108 [nociceptors], 1 × 108 [cardiomyocytes]) AAV.PHP.S-mMORp-eYFP virus (a), or an AAV.PHP.S-CAG-tdTomato virus (b). High magnification sample regions are denoted in lower magnification images via a white box. c, d Similar low (left) and high (right) magnification images of cultured nociceptors treated with lower titer mMORp-eYFP (1 × 109 gc/mL, MOI: 2 ×10⁵ [nociceptors], 1 ×10⁵ [cardiomyocytes], c) or CAG-tdTomato virus (d). Images of cultured human cardiomyocytes treated with high titer mMORp-eYFP (e) or CAG-tdTomato (f) viruses, with regions boxed in white denoting high magnification sample areas shown on the right. Images of cardiomyocytes treated with low titer mMORp-eYFP (g) or CAG-tdTomato (h) viruses, at both low (left) and high (right) magnification. Evidence of OPRM1 gene expression within cultured nociceptor cells is demonstrated in Supplementary Fig. 15.

References

    1. Corder G, Castro DC, Bruchas MR, Scherrer G. Endogenous and exogenous opioids in pain. Annu. Rev. Neurosci. 2018;41:453–473. doi: 10.1146/annurev-neuro-080317-061522. - DOI - PMC - PubMed
    1. Darcq E, Kieffer BL. Opioid receptors: drivers to addiction? Nat. Rev. Neurosci. 2018;19:499–514. doi: 10.1038/s41583-018-0028-x. - DOI - PubMed
    1. Mansour A, et al. Anatomy of CNS opioid receptors. Trends Neurosci. 1988;11:308–314. doi: 10.1016/0166-2236(88)90093-8. - DOI - PubMed
    1. Henriksen G, Willoch F. Imaging of opioid receptors in the central nervous system. Brain. 2008;131:1171–1196. doi: 10.1093/brain/awm255. - DOI - PMC - PubMed
    1. Pasternak GW, Pan YX. Mu opioids and their receptors: evolution of a concept. Pharmacol. Rev. 2013;65:1257–1317. doi: 10.1124/pr.112.007138. - DOI - PMC - PubMed

Publication types