. 2023 Sep 13;14(1):5635.
doi: 10.1038/s41467-023-41122-y.

CSF proteome profiling reveals biomarkers to discriminate dementia with Lewy bodies from Alzheimer´s disease

Affiliations

CSF proteome profiling reveals biomarkers to discriminate dementia with Lewy bodies from Alzheimer´s disease

Marta Del Campo et al. Nat Commun. .

Abstract

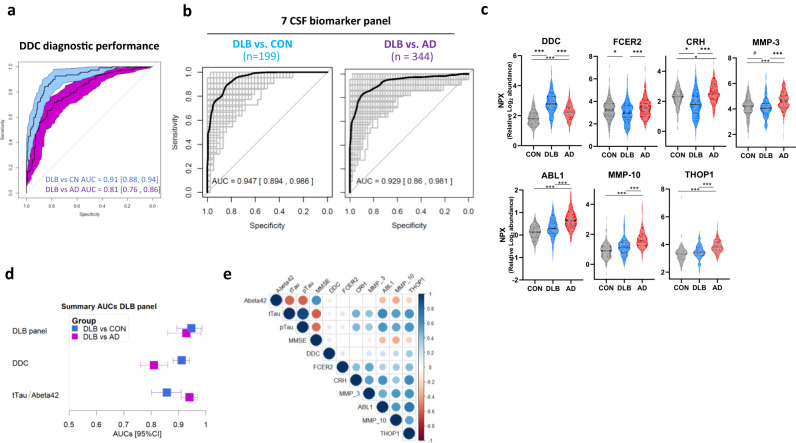
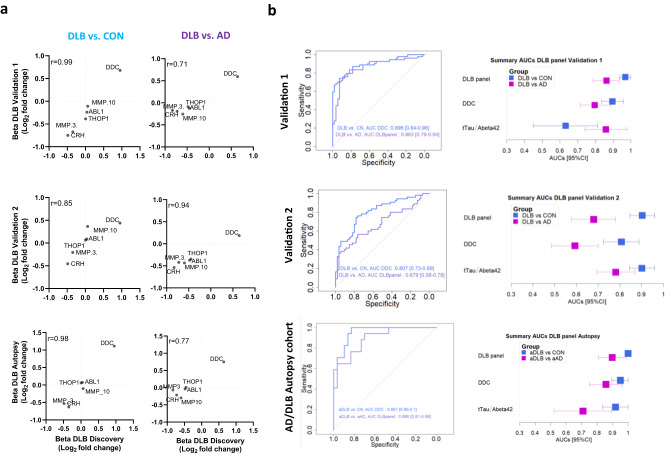
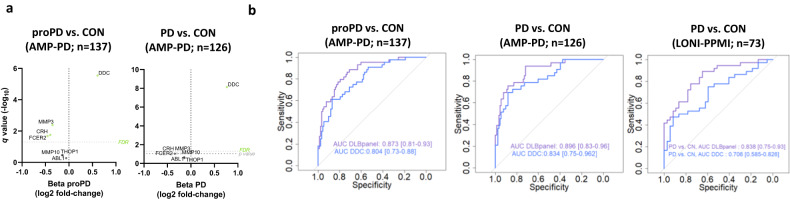
Diagnosis of dementia with Lewy bodies (DLB) is challenging and specific biofluid biomarkers are highly needed. We employed proximity extension-based assays to measure 665 proteins in the cerebrospinal fluid (CSF) from patients with DLB (n = 109), Alzheimer´s disease (AD, n = 235) and cognitively unimpaired controls (n = 190). We identified over 50 CSF proteins dysregulated in DLB, enriched in myelination processes among others. The dopamine biosynthesis enzyme DDC was the strongest dysregulated protein, and could efficiently discriminate DLB from controls and AD (AUC:0.91 and 0.81 respectively). Classification modeling unveiled a 7-CSF biomarker panel that better discriminate DLB from AD (AUC:0.93). A custom multiplex panel for six of these markers (DDC, CRH, MMP-3, ABL1, MMP-10, THOP1) was developed and validated in independent cohorts, including an AD and DLB autopsy cohort. This DLB CSF proteome study identifies DLB-specific protein changes and translates these findings to a practicable biomarker panel that accurately identifies DLB patients, providing promising diagnostic and clinical trial testing opportunities.


Conflict of interest statement

M.C. has been an invited speaker at Eisai, is an associate editor at Alzheimer´s Research & Therapy and has been an invited writer for Springer Healthcare. L.V. received a grant for CORAL consortium by Olink. D.I. is a Scientific Advisory Board Member for Denali Therapeutics. D.A. participated in advisory boards from Fujirebio-Europe and Roche Diagnostics and received speaker honoraria from Fujirebio-Europe, Roche Diagnostics, Nutricia, Krka Farmacéutica S.L., Zambon S.A.U. and Esteve Pharmaceuticals S.A. D.A., and A.L. declare a filed patent application (Title: Markers of synaptopathy in neurodegenerative disease; Applicant: Fundació Institut de Recerca de l’Hospital de la Santa Creu i Sant Pau, Inventors: Olivia BELBIN; Alberto LLEÓ; Alejandro BAYÉS; Juan FORTEA; Daniel ALCOLEA; Application number: PCT/EP2019/056535; International Publication Number: WO 2019/175379 A1; Current status: Active. Licensed to ADx Neurociences NV (Ghent, Belgium); This patent is not related to any specific aspect of the current manuscript). W.F. has performed contract research for Biogen MA Inc, and Boehringer Ingelheim. W.F. has been an invited speaker at Boehringer Ingelheim, Biogen MA Inc, Danone, Eisai, WebMD Neurology (Medscape), Springer Healthcare. W.F. is consultant to Oxford Health Policy Forum CIC, Roche, and Biogen MA Inc. WF participated in advisory boards of Biogen MA Inc and Roche. All funding is paid to her institution. W.F. is a member of the steering committee of PAVE, and Think Brain Health. WF was associate editor of Alzheimer, Research & Therapy in 2020/2021. W.F. is an associate editor at Brain. C.E.T. has a collaboration contract with ADx Neurosciences, Quanterix and Eli Lilly, performed contract research or received grants from AC-Immune, Axon Neurosciences, Bioconnect, Bioorchestra, Brainstorm Therapeutics, Celgene, EIP Pharma, Eisai, Grifols, Novo Nordisk, PeopleBio, Roche, Toyama, Vivoryon. She serves on editorial boards of Medidact Neurologie/Springer, Alzheimer Research and Therapy, Neurology: Neuroimmunology & Neuroinflammation, and is editor of a Neuromethods book Springer. She had speaker contracts for Roche, Grifols, Novo Nordisk. The rest of the authors declare no competing interest.

Figures

Fig. 1
Fig. 1. Study overview and differential abundance of CSF proteins in DLB.
a Protein levels in CSF from cognitively unimpaired controls (white), DLB (blue) and AD (red) were measured by antibody-based PEA technology. Differential CSF protein abundance as well as classification models were investigated. Custom multiplex PEA assays containing the markers identified within the classification panels were developed and validated in three independent validation cohorts. b Volcano plot shows the CSF proteins that are differentially regulated in DLB vs. controls. Each dot represents a protein. The beta coefficients (log2 fold-change) are plotted versus q values (−log10-transformed). Proteins significantly dysregulated after adjusting for false discovery rate (FDR, q < 0.05) are colored in light green and those with nominal significance (p < 0.05) are colored in grey. The name of the top 10 significant dysregulated CSF proteins and the top 5 with the strongest effect sizes are annotated. The total number of proteins that are down-regulated (left) or up-regulated (right) is indicated. Horizontal dotted line indicates the significance threshold. Adjusted p values (q < 0.05) were calculated using two-sided nested linear models, adjusting for FDR. c UpSet plot indicates which of the proteins dysregulated between DLB and controls are also dysregulated between DLB and AD or AD and controls. d Bar plots depict the direction of changes of the different proteins identified when compared to controls within the subsets defined through the UpSet plot. Data are presented as median and 95% confidence interval of the fold changes of all the proteins within each subset in DLB and AD vs. CON. e Bar graphs depicting the biological pathways enriched in those protein dysregulated in DLB. Functional enrichment was performed using Metascape selecting Gene Ontology (GO) Biological Processes as ontology source. Terms with a P value < 0.01, a minimum count of 3, and an enrichment factor >1.5 were collected and grouped into clusters based on their membership similarities. P values were calculated based on the accumulative hypergeometric distribution. Kappa scores are used as the similarity metric when performing hierarchical clustering on the enriched terms, and subtrees with a similarity of >0.3 are considered a cluster. The most statistically significant term within a cluster is chosen to represent the cluster. The corresponding GO number and biological process are defined on the right side. Stronger colors represent higher significant enrichment. Vertical line represents the significant threshold (unadjusted P < 0.01). CON cognitively unimpaired controls, DLB Dementia with Lewy bodies, AD Alzheimer’s disease. Some images within (a) are courtesy of Olink® Proteomics AB.
Fig. 2
Fig. 2. CSF biomarker panel for specific diagnosis of DLB.
a Receiver operating characteristic (ROC) curves depict the performance of CSF DDC discriminating DLB (n = 109) from controls (n = 190, blue) and AD (n = 235, purple). Inset indicate the total area under the curve (AUC) and shaded areas depict 95% CI after 100 bootstrap. b ROC curves depicting the performance of 7 CSF biomarker panel discriminating DLB from controls and AD. Black line is the mean AUC over all re-samplings (1000 repeats of 5-fold cross-validation, gray lines). Inserts outline corresponding AUC and 95% CI. c Violins represent the abundance (log2 NPX) of the different CSF within the DLB biomarker panel. Horizontal black and dash lines indicate median and interquartile range of the protein abundance. d) Forest plot depicts the mean AUC over all re-samplings and 95% CI obtained with the CSF DLB biomarker panel, CSF DDC or CSF tTau/Abeta42 biomarkers in the comparison between DLB (n = 109) and controls (n = 190, blue) or AD (n = 235, purple). e Correlation matrix heatmap representing the Spearman’s correlation coefficient in-between the proteins selected of the CSF DLB panel, the classical AD CSF biomarkers and ratios and MMSE score. Significant associations are depicted by circles. *q < 0.05, **q < 0.01, ***q < 0.001. DLB dementia with Lewy Bodies, AD Alzheimer’s disease, CON cognitively unimpaired controls.
Fig. 3
Fig. 3. Development and validation of custom CSF biomarker panels for DLB diagnosis in independent cohorts.
a Scatter plots show the correlation between the beta-coefficients obtained in the discovery phase to those obtained with the custom assays in the clinical validation cohorts 1 and 2 and the autopsy confirmed cohort. Insert indicate the spearman correlation coefficient. b Receiver operating characteristic (ROC) curves depicting the performance of DDC or the CSF biomarker panel discriminating DLB from controls or AD respectively using the custom assays across the different validation cohorts (Validation cohort 1: 54 DLB, 55 AD, and 55 CON, clinical validation cohort 2: 55 DLB, 55 AD, and CON and the AD/DLB autopsy cohort: 17 aDLB, 30 aAD and 29 non-autopsy confirmed controls). Inserts outline the total AUC and 95% CI after 100 bootstrap. Forest plots depict the total AUC and 95%CI after 100 bootstrap obtained with the CSF DLB biomarker panel, CSF DDC, or the CSF tTau/Abeta42 ratio in the comparison between DLB and controls (blue) or AD (purple). DLB dementia with Lewy Bodies, AD Alzheimer’s disease, aDLB autopsy confirmed DLB, aAD autopsy confirmed AD, CON cognitively unimpaired controls.
Fig. 4
Fig. 4. CSF proteins within the DLB biomarker panel associate with different pathophysiological features of DLB.
a, b Correlation matrix heatmap representing the Pearson’s correlation in-between the DLB proteins within the panel and (a) UPDRS-III in the clinical validations 1 and 2; or (b) α-syn load in different brain areas from a subset of cases with pathological confirmation in the discovery cohort and the AD/DLB autopsy validation cohort. Total α-syn represent the average of α-syn load across different areas. Neocortical α-syn depicts the average α-syn load in all the cortical areas (discovery: Midfrontal, angular and superior mid-temporal and anterior cingulate; Validation cohort: GFS and GTM). Significant associations are depicted by circles. c, d Box plots represent the abundance (log2 NPX) of CSF DDC across (c) the different DLB stages in the subset of cases with pathological confirmation in the discovery cohort and in the AD/DLB autopsy validation cohort; and (d) α-syn Braak stages in the AD/DLB autopsy cohort. Insert indicate p-value of one-side ANOVA analysis. Data are presented as median, upper and lower quartiles defining the interquartile range (IQR), and whiskers defining the highest and lower values without outliers (within 1.5 times IQR). Each dot represents an individual sample. DLB dementia with Lewy Bodies, AD Alzheimer’s disease, aDLB autopsy confirmed DLB, aAD autopsy confirmed AD, Hipp (Sub)/(ER) Hippocampus CA/subiculum and Enthorinal, Anter. Cing. Anterios cingulate, GFS superior frontal girus, GTS superior temporal girus.
Fig. 5
Fig. 5. CSF DDC and proteins within the DLB protein panel are dysregulated in the prodromal or symptomatic stages of Parkinson´s disease.
a Volcano plot shows the CSF proteins that are differentially regulated in prodromal PD or PD vs. controls. Each dot represents a protein. The beta coefficients (log2 fold-change) are plotted versus q values (−log10-transformed). Proteins significantly dysregulated after adjusting for false discovery rate (FDR, q < 0.05) are colored in light green and those with nominal significance (p < 0.05) are colored in gray. Horizontal dotted line indicates the significance thresholds. Adjusted p values (q < 0.05) were calculated using two-sided nested linear models, adjusting for FDR. b Receiver operating characteristic (ROC) curves depicting the performance of DDC (blue) or the CSF biomarker panel (purple) discriminating prodromal PD or PD from controls in the two cohorts (AMP-PD: 44proPD, 33 PD and 99 controls; and LONI-PPMI: 36 PD and 37 controls). CSF PEA proteome data is publicly available from Parkinson’s Progression Markers Initiative (see method section). Inserts outline corresponding AUC and 95% CI after 100 bootstrap. PD Parkinson´s disease, pro-PD prodromal PD, CON cognitively unimpaired controls.

Comment in

References

    1. McKeith I, et al. Dementia with Lewy bodies. Lancet Neurol. 2004;3:19–28. - PubMed
    1. Spillantini MG, et al. α-Synuclein in Lewy bodies. Nature. 1997;388:839–840. - PubMed
    1. Nelson PT, et al. Low sensitivity in clinical diagnoses of dementia with Lewy bodies. J. Neurol. 2010;257:359–366. - PMC - PubMed
    1. McKeith IG, et al. Diagnosis and management of dementia with Lewy bodies Fourth consensus report of the DLB Consortium. Neurology. 2017;89:1–13. - PMC - PubMed
    1. Donadio V, et al. A new potential biomarker for dementia with Lewy bodies. Neurology. 2017;89:318–326. - PubMed

Publication types