. 2023 Sep 13;14(1):5669.
doi: 10.1038/s41467-023-41434-z.

Detection of diagnostic and prognostic methylation-based signatures in liquid biopsy specimens from patients with meningiomas

Affiliations

Detection of diagnostic and prognostic methylation-based signatures in liquid biopsy specimens from patients with meningiomas

Grayson A Herrgott et al. Nat Commun. .

Abstract

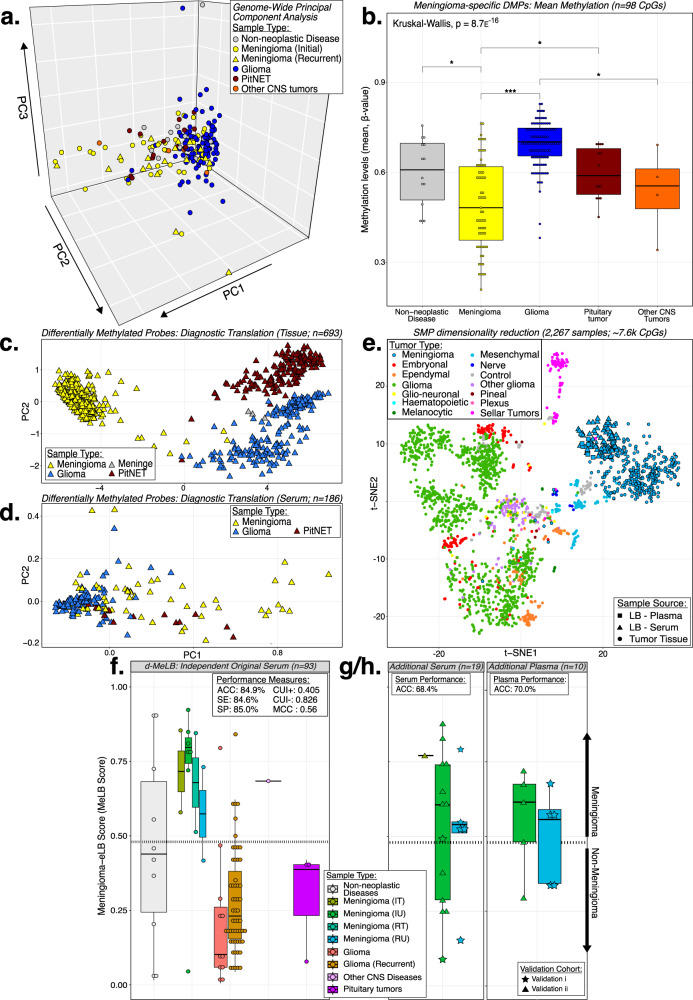
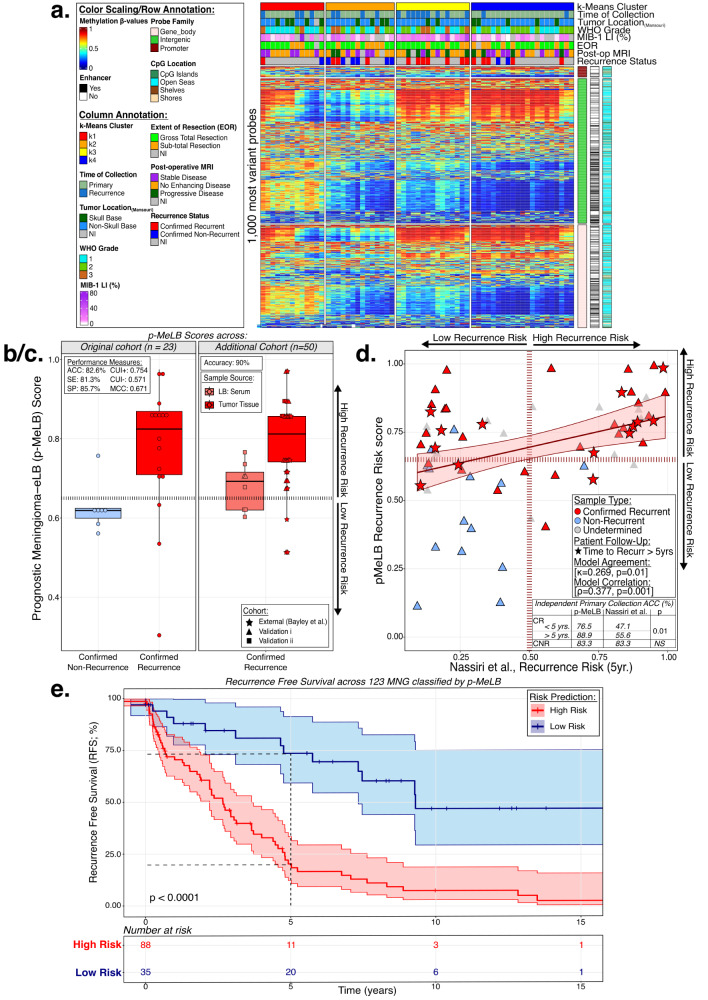
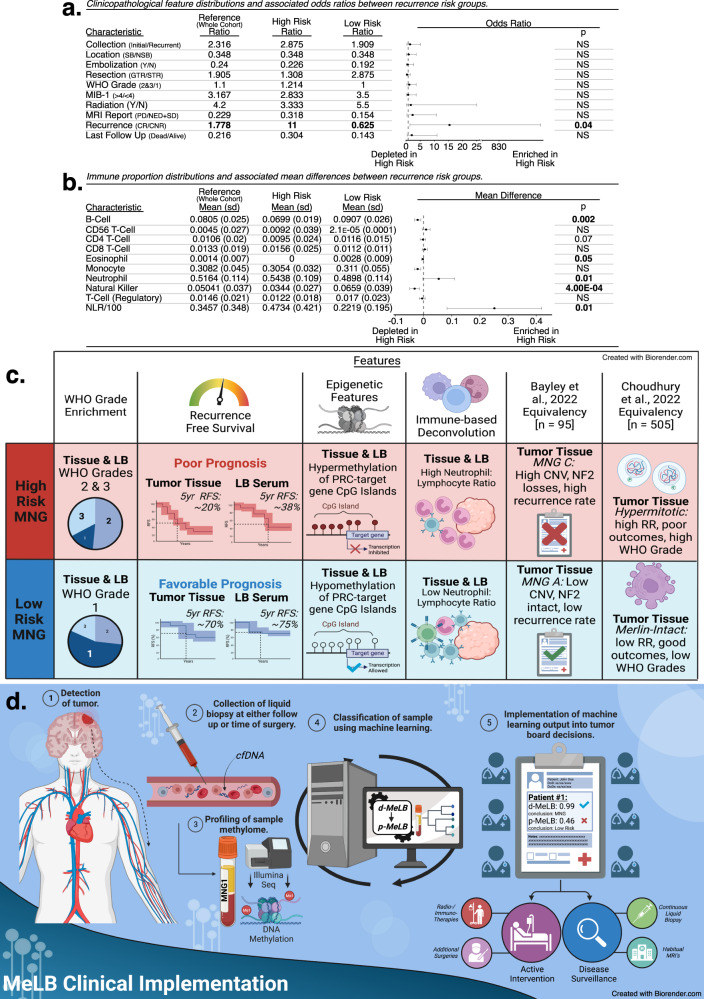
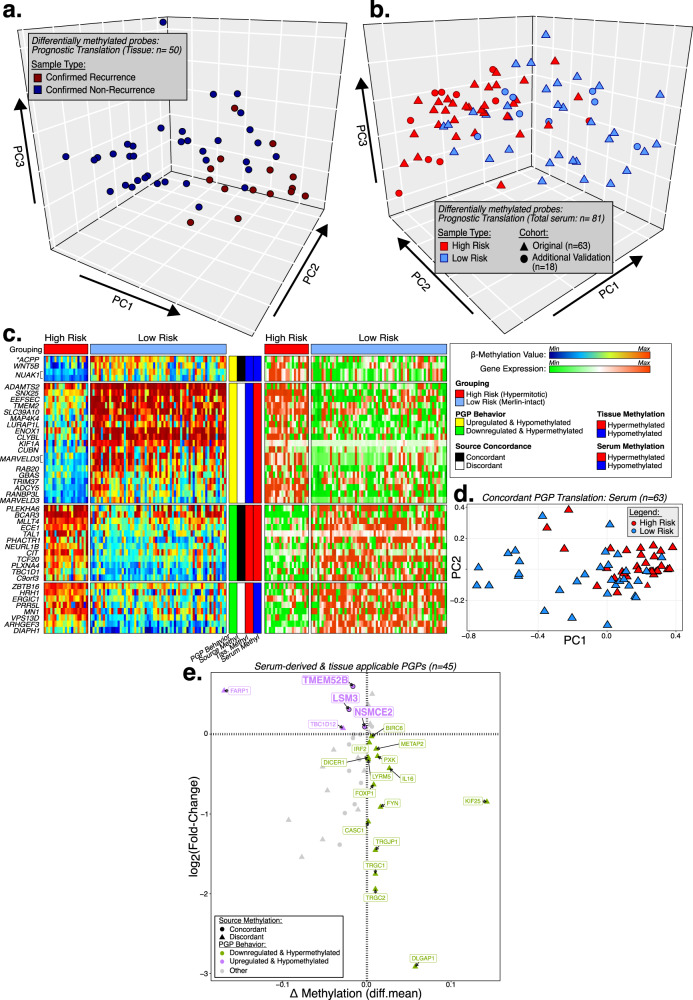
Recurrence of meningiomas is unpredictable by current invasive methods based on surgically removed specimens. Identification of patients likely to recur using noninvasive approaches could inform treatment strategy, whether intervention or monitoring. In this study, we analyze the DNA methylation levels in blood (serum and plasma) and tissue samples from 155 meningioma patients, compared to other central nervous system tumor and non-tumor entities. We discover DNA methylation markers unique to meningiomas and use artificial intelligence to create accurate and universal models for identifying and predicting meningioma recurrence, using either blood or tissue samples. Here we show that liquid biopsy is a potential noninvasive and reliable tool for diagnosing and predicting outcomes in meningioma patients. This approach can improve personalized management strategies for these patients.


Conflict of interest statement

The authors declare no competing interests.

Figures

Fig. 1
Fig. 1. Serum circulating cell-free DNA methylation patterns and signatures distinguish meningiomas from other CNS entities.
a Principal component analysis (PCA) depicting the genome-wide mean methylation levels of serum cfDNA derived from patients with meningioma (MNG; n = 63) and non-MNG conditions (other CNS entities and non-neoplastic diseases; n = 141). Note: MNG: meningiomas; CNS Central Nervous System. b Mean methylation levels of the differentially methylated CpG probes (DMP, n = 98) across comparisons between MNG and non-MNG (Wilcoxon rank sum test; Kruskal-Wallis; *p < 0.05, **p < 0.01, ***p < 0.001). Box plots - data are presented as median and upper (75%) and lower (25%) quartiles. Whiskers represent minimum to maximum values, excluding outliers. Exact p-values: Meningioma vs Non-neoplastic Disease: p = 0.018; Meningioma vs Glioma: p = 4.4e−16; Meningioma vs pituitary neuroendocrine tumors: p = 0.017; Glioma vs Other CNS tumors: p = 0.012. Note: DMP: differentially methylated probes. t-distributed stochastic neighbor embedding (t-SNE) plots displaying clustering of meningioma-specific DMPs across MNG and non-MNG tissue specimens (c). A subset of these DMPs is detected in the serum and also distinguish equivalent groups (d). e t-SNE plot displaying dimension-reduced diagnostic-Meningioma Epigenetic Liquid Biopsy (d-MeLB) probes (SMP: n = 18k CpGs) across CNS tumor tissue, liquid biopsy (serum and plasma) and tumor tissue from patients with MNG. SMP similarly methylated probes, LB liquid biopsy. Distribution of the d-MeLB scores across independent cohorts (f: original liquid biopsy serum, n = 93; g: additional MNG serum, n = 19; h: additional MNG plasma, n = 10) (Dashed line: MeLB cutoff score). Box plots - data are presented as median and upper (75%) and lower (25%) quartiles. Whiskers represent minimum to maximum values, excluding outliers. Upper left corner: performance measures. ACC Accuracy, SE Sensitivity, SP Specificity, CUI Clinical Utility Index, MCC Matthew’s Correlation Coefficient, IT initial treated, IU initial untreated, RT recurrent treated, RU recurrence untreated.
Fig. 2
Fig. 2. Serum circulating cell-free DNA methylation patterns and signatures differentiate meningiomas with different behaviors.
a Methylation heatmap displaying the 1000 most variable methylated probes (β-values) across serum meningioma unsupervised k-clusters (n = 63). Samples are sorted into methylation-based clusters and annotated with clinicopathological/molecular features. Vertical tracks (right) genomic annotations. LI Labeling Index, EOR Extent of Resection, NI non-informed, MRI magnetic resonance imaging b/c. Distribution of the prognostic-Meningioma Epigenetic Liquid Biopsy (p-MeLB) scores across (b) the original independent cohort (n = 23) and (c) additional validations (n = 50) from patients with meningiomas presenting different outcomes (confirmed recurrence or no recurrence; dashed lines: p-MeLB score cutoff). Box plots - data are presented as median and upper (75%) and lower (25%) quartiles. Whiskers represent minimum to maximum values, excluding outliers. Upper left corner: performance measures. ACC Accuracy, SE Sensitivity, SP Specificity, CUI Clinical Utility Index, MCC Matthew’s Correlation Coefficient. d Scatterplot displaying the relationship between p-MeLB and the nomogram recurrence risk prediction across the primary meningioma tissue subset. Linear relationship is depicted with 95% confidence interval (lower and upper limits). Measurements of concordance are displayed (Cohen’s unweighted kappa/Spearman’s ρ, p < 0.05). Table comparing the accuracies of p-MeLB and the nomogram-based classifier across an independent subset of primary meningioma tissue (n = 69). ACC accuracy, CR Confirmed Recurrence, CNR Confirmed No Recurrence. e Kaplan-Meier survival curves displaying meningioma tumor tissue samples stratified by their predicted recurrence risk (n = 127, vertical ticks: censorship). Survival curves are depicted with 95% confidence intervals (lower and upper limits) for point estimates; comparisons of median survival time in both recurrence risk groups were conducted using log-rank tests (p < 0.0001). MNG meningioma, RR recurrence risk.
Fig. 3
Fig. 3. Clinicopathological and molecular characterization of serum from patients with meningioma predicted to present distinct recurrence risk outcomes through p-MeLB.
a Clinicopathological feature proportions and associated odds ratios (p-values: two-sided Fisher’s Exact test; error bars: 95% confidence interval estimates) derived from the comparison between meningioma serum samples predicted to present high or low recurrence risks. Reference column depicts the mean proportion of each feature across the whole cohort. SB Skull-base, NSB Non-Skull Base, Y Yes, N No, GTR Gross Total Resection, STR Subtotal Resection, PD Progressive Disease, SD Stable Disease, NED Non-Enhancing Disease, CR Confirmed Recurrence, CNR Confirmed No Recurrence; Bolded features are those with observed statistical significance. b Immune cell proportions and associated mean differences derived from the comparison between meningioma serum samples predicted to present high or low recurrence risks (error bars: mean difference 95% confidence interval; p-values: two-sided t-test). Reference column depicts the mean proportion across the whole cohort. NLR Neutrophil-Lymphocyte Ratio. Bolded features are those with observed statistical significance. c Schematic summarization of observed clinicopathological and molecular features across samples (LB-serum and/or tissue) from patients with meningiomas predicted to present high or low risk of recurrence through p-MeLB. LB liquid biopsy, RFS Recurrence Free Survival, RR Recurrence Risk, MNG C Bayley Meningioma C group, CNV copy number variation, RR recurrence risk, PRC Polycomb Repressive Complex. d Schematic representation—clinical application of liquid biopsy DNA methylation-based diagnostic and prognostic classifiers in patients suspected to present meningioma. MeLB Meningioma epigenetic Liquid Biopsy, cfDNA cell-free DNA, d-MeLB and p-MeLB diagnostic- and prognostic- Meningioma Epigenetic Liquid Biopsy, respectively, MRI magnetic resonance imaging.
Fig. 4
Fig. 4. Characterization and functional analysis (in silico) of recurrent-risk differentially methylated probes.
Principal component analysis depicting the tissue-derived recurrence risk group DMPs (High vs Low) and respective outcomes (Confirmed Recurrence vs. Confirmed No Recurrence) across (a) the tumor tissue cohort, (b) the original liquid biopsy serum cohort and an additional serum cohort of samples from patients with meningiomas. c Heatmap displaying methylation and expression levels of differentially methylated probes and differentially expressed target genes that are negatively correlated across high and low recurrence risk groups identified in an external molecular meningioma tissue dataset (Choudhury et al., 2022). *PGP Promoter-linked probe-gene pair. d Principal component analysis of liquid biopsy serum samples using the identified and concordantly methylated probe-gene pairs as input. PGP probe-target gene pair. e Scatter plot depicting serum-derived risk-specific probes that are also detected in meningioma tissue and respective target genes expression changes between high and low risk sample cohorts. PGP probe-target gene pair, Diff mean differential mean.

References

    1. Ostrom QT, et al. CBTRUS Statistical Report: Primary Brain and Other Central Nervous System Tumors Diagnosed in the United States in 2015-2019. Neuro Oncol. 2022;24:v1–v95. - PMC - PubMed
    1. Huang RY, et al. Imaging and diagnostic advances for intracranial meningiomas. Neuro Oncol. 2019;21:i44–i61. - PMC - PubMed
    1. Ius T, et al. Advances in multidisciplinary management of skull base meningiomas. Cancers. 2021;13:2664. - PMC - PubMed
    1. Goldbrunner R, et al. EANO guideline on the diagnosis and management of meningiomas. Neuro Oncol. 2021;23:1821–1834. - PMC - PubMed
    1. Kaley T, et al. Historical benchmarks for medical therapy trials in surgery- and radiation-refractory meningioma: a RANO review. Neuro Oncol. 2014;16:829–840. - PMC - PubMed

Publication types