. 2023 Sep 13;14(1):5653.
doi: 10.1038/s41467-023-41438-9.

Cell microparticles loaded with tumor antigen and resiquimod reprogram tumor-associated macrophages and promote stem-like CD8+ T cells to boost anti-PD-1 therapy

Affiliations

Cell microparticles loaded with tumor antigen and resiquimod reprogram tumor-associated macrophages and promote stem-like CD8+ T cells to boost anti-PD-1 therapy

Xiaoqiong Zhang et al. Nat Commun. .

Abstract

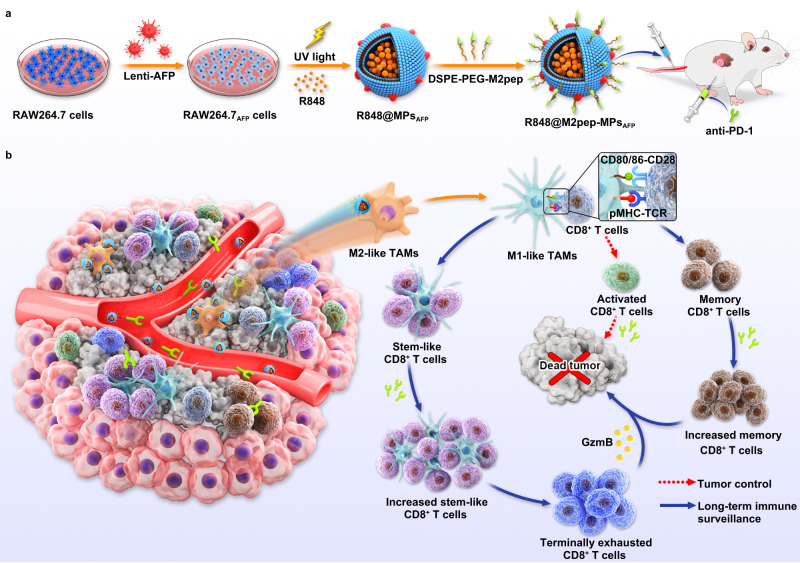
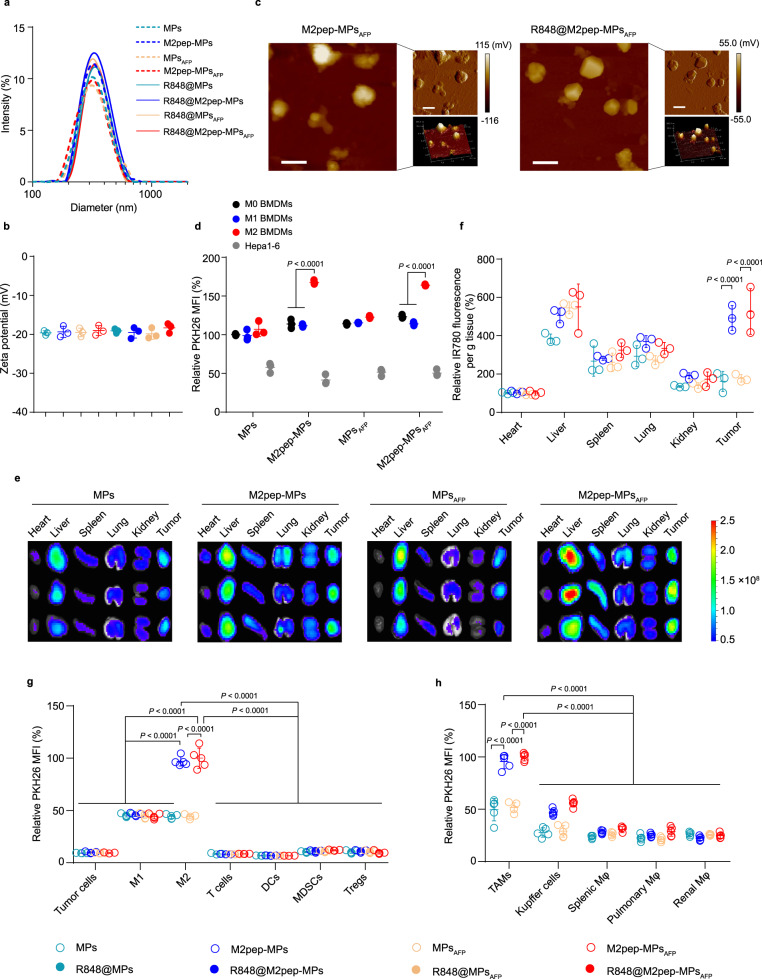
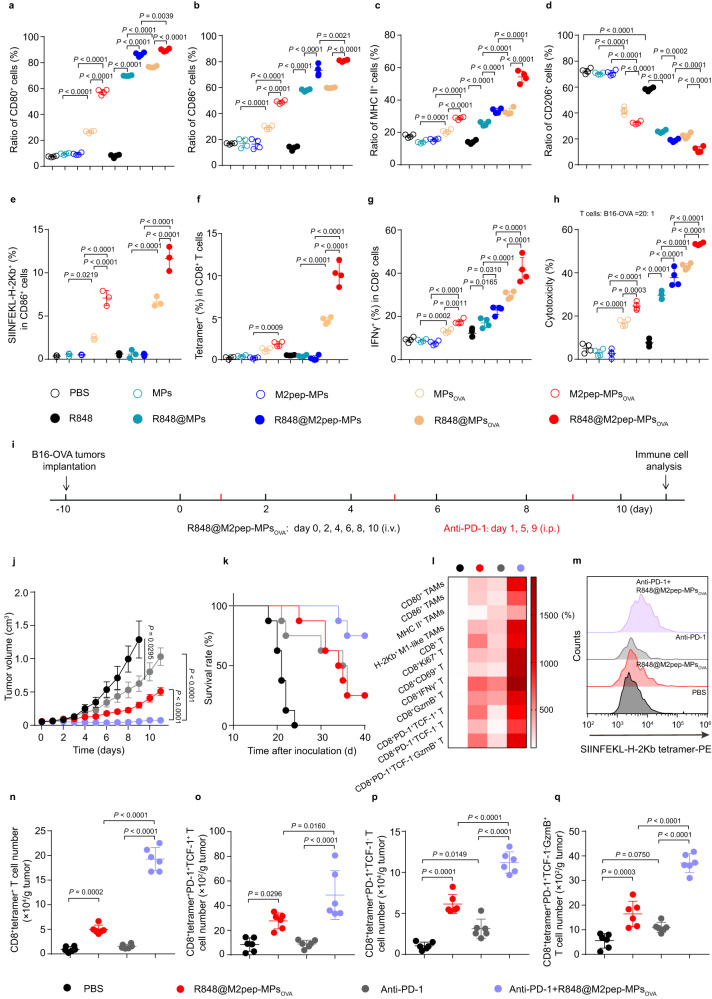
The durable response rate to immune checkpoint blockade such as anti-programmed cell death-1 (PD-1) antibody remains relatively low in hepatocellular carcinoma (HCC), mainly depending on an immunosuppressive microenvironment with limited number of CD8+ T cells, especially stem-like CD8+ T cells, in tumor tissues. Here we develop engineered microparticles (MPs) derived from alpha-fetoprotein (AFP)-overexpressing macrophages to load resiquimod (R848@M2pep-MPsAFP) for enhanced anti-PD-1 therapy in HCC. R848@M2pep-MPsAFP target and reprogram immunosuppressive M2-like tumor-associated macrophages (TAMs) into M1-like phenotype. Meanwhile, R848@M2pep-MPsAFP-reprogrammed TAMs act as antigen-presenting cells, not only presenting AFP antigen to activate CD8+ T cell-mediated antitumor immunity, but also providing an intra-tumoral niche to maintain and differentiate stem-like CD8+ T cells. Combination immunotherapy with anti-PD-1 antibody generates strong antitumor immune memory and induces abundant stem-like CD8+ T cell proliferation and differentiation to terminally exhausted CD8+ T cells for long-term immune surveillance in orthotopic and autochthonous HCC preclinical models in male mice. We also show that the R848-loaded engineered MPs derived from macrophages overexpressing a model antigen ovalbumin (OVA) can improve anti-PD-1 therapy in melanoma B16-OVA tumor-bearing mice. Our work presents a facile and generic strategy for personalized cancer immunotherapy to boost anti-PD-1 therapy.


Conflict of interest statement

The authors declare no competing interests.

Figures

Fig. 1
Fig. 1. Schematic of R848@M2pep-MPsAFP as an efficient therapeutic strategy to potentiate anti-PD-1 antibody therapy in HCC.
a Schematic illustration of the preparation of R848@M2pep-MPsAFP. R848@M2pep-MPsAFP were obtained by loading R848 to M2pep-conjugated MPs derived from AFP-overexpressing RAW264.7 cells by lentivirus transduction. b Schematic illustration of R848@M2pep-MPsAFP to boost anti-PD-1 antibody therapy in HCC. R848@M2pep-MPsAFP targeted and reprogrammed M2-like TAMs into M1-like phenotype, followed by presenting AFP antigen to activate antigen-specific CD8+ T cell for tumor control and promote stem-like CD8+ T cell proliferation and differentiation. Combination with anti-PD-1 antibody generated strong antitumor immune memory and induced abundant stem-like CD8+ T cell proliferation and differentiation to terminally exhausted CD8+ T cells for long-term immune surveillance.
Fig. 2
Fig. 2. Relationship between the sensitivity of anti-PD-1 antibody therapy and tumor microenvironment.
a Volcano plots showing differential gene expression in the tumor tissues of anti-PD-1 antibody-responsive and nonresponsive mice. (n = 3 mice per group; two-tailed Student’s t-test for comparison using Cuffdiff in the Cufflinks package). b Top 20 enrichment ratios (E-ratio) in GO term enrichment analysis of differentially expressed genes in tumor tissues of anti-PD-1 antibody-responsive and nonresponsive mice. (n = 3 mice per group; one-sided hypergeometric test). c GO enrichment analysis of the differentially expressed genes associated with macrophages, T cells and antigen presentation pathways in tumor tissues of anti-PD-1 antibody-responsive and nonresponsive mice. (n = 3 mice per group; one-sided hypergeometric test). dk The numbers of CD80+ TAMs (d), CD86+ TAMs (e), CD206+ TAMs (f), CD8+ T (g), CD8+IFNγ+ T (h), CD8+PD-1+ T (i), CD8+PD-1+TCF-1+ T (j), and CD8+PD-1+TCF-1- T (k) cells in tumor tissues of orthotopic Hepa1-6 tumor-bearing mice after intraperitoneal injection of PBS or anti-PD-1 antibody at the dosage of 5 mg kg−1 every four days for 5 times indicated in Supplementary Fig. 1a. Data are presented as means ± s.d. (n = 5 mice for control group, n = 11 mice for anti-PD-1 nonresponsive group, n = 12 mice for anti-PD-1 responsive group; one-way ANOVA followed by Tukey’s HSD post-hoc test). Source data are provided as a Source Data file.
Fig. 3
Fig. 3. Characterization and M2-like TAM targeting of R848@M2pep-MPsAFP.
a, b Hydrodynamic diameters (a) and zeta potentials (b) of MPs, M2pep-MPs, MPsAFP, M2pep-MPsAFP, R848@MPs, R848@M2pep-MPs, R848@MPsAFP and R848@M2pep-MPsAFP by DLS analysis. Data are presented as means ± sd (n = 3 independent samples). c Representative AFM height images (left), amplitude images (upper right) and three-dimensional morphology (lower right) of M2pep-MPsAFP and R848@M2pep-MPsAFP. Scale bars: 400 nm. Images are representative of three independent samples. d Relative PKH26 mean fluorescence intensity (MFI) in BMDMs (M0 BMDMs), LPS- and IFNγ-stimulated BMDMs (M1-like BMDMs), IL-4-stimulated BMDMs (M2-like BMDMs) and Hepa1-6 cells after treatment with PKH26-labeled MPs, M2pep-MPs, MPsAFP or M2pep-MPsAFP at the concentration of 10 µg protein mL−1 for 4 h by flow cytometry. Data are presented as means ± sd (n = 3 biological independent samples; one-way ANOVA followed by Tukey’s HSD post-hoc test). e, f Ex vivo imaging (e) and relative fluorescence intensity (f) of IR780 in major organs and tumors of orthotopic Hepa1-6 tumor-bearing mice at 24 h after intravenous injection of IR780-labeled MPs, M2pep-MPs, MPsAFP or M2pep-MPsAFP at the dosage of 15 mg protein kg−1. Data are presented as means ± s.d. for (f). (n = 3 mice per group; one-way ANOVA followed by Tukey’s HSD post-hoc test). g Relative PKH26 MFI in tumor cells (CD45- cells), M1-like TAMs (CD11b+F4/80+CD80+ cells), M2-like TAMs (CD11b+F4/80+CD206+ cells), T cells (CD45+CD3+ cells), DCs (CD45+F4/80-CD11c+ cells), MDSCs (CD45+CD11b+Gr1+ cells) and Tregs (CD45+CD3+CD4+CD25+FoxP3+ cells) in tumor tissues of orthotopic Hepa1-6 tumor-bearing mice at 24 h after intravenous injection of PKH26-labeled MPs, M2pep-MPs, MPsAFP or M2pep-MPsAFP at the dosage of 15 mg protein kg−1. Data are presented as means ± sd (n = 5 mice per group; two-way ANOVA followed by Bonferroni’s multiple comparisons post-test). h Relative PKH26 MFI in TAMs, liver Kupffer cells, splenic macrophages, pulmonary macrophages and renal macrophages (CD11b+F4/80+ cells) of orthotopic Hepa1-6 tumor-bearing mice at 24 h after treatment indicated in (g). Data are presented as means ± sd (n = 5 mice per group; two-way ANOVA followed by Bonferroni’s multiple comparisons post-test). Source data are provided as a Source Data file.
Fig. 4
Fig. 4. Efficiently reprogramming M2-like TAMs and activating CD8+ T cells by R848@M2pep-MPsAFP in vivo.
a Schematic schedule for reprogramming M2-like TAMs and activating CD8+ T cells by R848@M2pep-MPsAFP in orthotopic Hepa1-6 tumor-bearing mice. be The numbers of CD80+ (b), CD86+ (c), MHC II+ (d), and CD206+ (e) TAMs in tumor tissues of orthotopic Hepa1-6 tumor-bearing mice after intravenous injection of PBS, MPs, M2pep-MPs, MPsAFP, M2pep-MPsAFP, R848, R848@MPs, R848@M2pep-MPs, R848@MPsAFP or R848@M2pep-MPsAFP at the R848 dosage of 0.5 mg kg−1 every three days for six times as indicated in (a). Data are presented as means ± s.d. (n = 5 mice per group; one-way ANOVA followed by Tukey’s HSD post-hoc test). fi Representative flow plots (f) and percentages of proliferated CD8+ T cells (g), IFNγ+ (h), and GzmB+ (i) cells in CD8+ T cells at 5 days after co-culture with TAMs isolated from tumor tissues of orthotopic Hepa1-6 tumor-bearing mice which were intravenously injected with PBS, MPs, M2pep-MPs, MPsAFP, M2pep-MPsAFP, R848, R848@MPs, R848@M2pep-MPs, R848@MPsAFP or R848@M2pep-MPsAFP at the R848 dosage of 0.5 mg kg−1 every three days for six times as indicated in (a) by flow cytometry. Data are presented as means ± s.d. for (gi) (n = 5 mice per group; one-way ANOVA followed by Tukey’s HSD post-hoc test). j, k Representative flow plots (j) and ratios of antigen-specific lysis (k) in splenocytes of orthotopic Hepa1-6 tumor-bearing mice at 24 h after intravenous injection of PBS, R848@M2pep-MPs or R848@M2pep-MPsAFP at the R848 dosage of 0.5 mg kg−1 every three days for six times, followed by intravenous injection of the mixtures of CFSElow OVA257-264-loaded and CFSEhigh AFP212-loaded splenocytes at the ratio of 1:1 as indicated in (a) by flow cytometry. Data are presented as means ± s.d. for (k). (n = 5 mice per group; one-way ANOVA followed by Tukey’s HSD post-hoc test). Panels (f, j) show representative results of five independent samples. Source data are provided as a Source Data file.
Fig. 5
Fig. 5. Potent antitumor activity and improved antitumor immunity of R848@M2pep-MPsAFP in orthotopic Hepa1-6 tumor-bearing mice.
a Schematic schedule for the antitumor experiment of R848@M2pep-MPsAFP in orthotopic Hepa1-6 tumor-bearing mice. b, c Tumor images (b) and tumor weight (c) of orthotopic Hepa1-6 tumor-bearing mice at 16 days after intravenous injection of PBS, MPs, M2pep-MPs, MPsAFP, M2pep-MPsAFP, R848, R848@MPs, R848@M2pep-MPs, R848@MPsAFP or R848@M2pep-MPsAFP at the R848 dosage of 0.5 mg kg−1 every three days for six times. Data are presented as means ± s.d. for (c). (n = 5 mice per group; one-way ANOVA followed by Tukey’s HSD post-hoc test). d Kaplan–Meier survival plot of orthotopic Hepa1-6 tumor-bearing mice after treatment indicated in (a). (n = 8 mice per group). el The numbers of CD8+ T cells (gated as CD45+CD3+CD8+, e), CD8+Ki67+ T cells (gated as CD45+CD3+CD8+Ki67+, f), CD8+CD69+ T cells (gated as CD45+CD3+CD8+CD69+, g), CD8+IFNγ+ T cells (gated as CD45+CD3+CD8+IFNγ+, h), CD8+GzmB+ T cells (gated as CD45+CD3+CD8+GzmB+, i), CD8+PD-1+TCF-1+ T cells (gated as CD45+CD3+CD8+PD-1+TCF-1+, j), CD8+PD-1+TCF-1- T cells (gated as CD45+CD3+CD8+PD-1+TCF-1-, k) and CD8+PD-1+TCF-1-GzmB+ T cells (gated as CD45+CD3+CD8+PD-1+TCF-1-GzmB+, l) in tumor tissues of orthotopic Hepa1-6 tumor-bearing mice at 16 days after treatment indicated in (a). Data are presented as means ± s.d. (n = 5 mice per group; one-way ANOVA followed by Tukey’s HSD post-hoc test). m Colocalization of M1-like TAMs (F4/80 (red) and CD86 (pink)-positive cells) and TCF-1 (green) in tumor tissues of orthotopic Hepa1-6 tumor-bearing mice at 16 days after treatment indicated in (a) by immunofluorescent staining. Scale bars: 10 μm. Images are representative of three independent samples. Source data are provided as a Source Data file.
Fig. 6
Fig. 6. Improved antitumor effects and antitumor immunity of anti-PD-1 antibody by R848@M2pep-MPsAFP in orthotopic Hepa1-6 tumor-bearing mice.
a Schematic schedule for the antitumor experiment of combination of R848@M2pep-MPsAFP and anti-PD-1 antibody in orthotopic Hepa1-6 tumor-bearing mice. b, c Tumor images (b) and tumor weight (c) of orthotopic Hepa1-6 tumor-bearing mice after treatment with R848@M2pep-MPsAFP in the presence or absence of anti-PD-1 antibody at the anti-PD-1 antibody dosage of 5 mg kg−1 and R848 dosage of 0.5 mg kg−1 indicated in (a). Data are presented as means ± s.d. for (c). (n = 5 mice per group; one-way ANOVA followed by Tukey’s HSD post-hoc test). d Kaplan–Meier survival plot of orthotopic Hepa1-6 tumor-bearing mice after treatment indicated in (a). (n = 8 mice per group). el The numbers of CD8+ T cells (e), CD8+Ki67+ T cells (f), CD8+CD69+ T cells (g), CD8+IFNγ+ T cells (h), CD8+GzmB+ T cells (i), CD8+PD-1+TCF-1+ T cells (j), CD8+PD-1+TCF-1- T cells (k) and CD8+PD-1+TCF-1-GzmB+ T cells (l) in tumor tissues of orthotopic Hepa1-6 tumor-bearing mice after treatment indicated in (a). Data are presented as means ± s.d. (n = 5 mice per group; one-way ANOVA followed by Tukey’s HSD post-hoc test). m Schematic schedule for ELISPOT and T cell cytotoxic assay. n, o Images (n) and numbers (o) of IFNγ immune spots from OVA257-264- or AFP212-restimulated splenocytes isolated from orthotopic Hepa1-6 tumor bearing mice after treatment indicated in (m) by the ELISPOT assay. Data are presented as means ± s.d. (n = 5 biological independent samples; two-way ANOVA followed by Bonferroni’s multiple comparisons post-test). p Cytotoxicity of T cells against Hepa1-6 cells when T cells isolated from OVA257-264- or AFP212-restimulated splenocytes were incubated with Hepa1-6 cells at the effector/target ratio of 10:1 for 6 h as indicated in (m) by LDH assay. Data are presented as means ± s.d. (n = 5 biological independent samples; two-way ANOVA followed by Bonferroni’s multiple comparisons post-test). Source data are provided as a Source Data file.
Fig. 7
Fig. 7. Improved antitumor activity and antitumor immunity of anti-PD-1 antibody by R848@M2pep-MPsAFP in DEN-induced autochthonous HCC mice.
a Schematic schedule for the anticancer experiment of combination of R848@M2pep-MPsAFP and anti-PD-1 antibody in DEN-induced autochthonous HCC mice. be Tumor images (b), tumor weight (c), nodule numbers (d) and H&E staining of liver tissues (e) in DEN-induced autochthonous HCC mice at 30 weeks after treatment with R848@M2pep-MPsAFP in the presence or absence of anti-PD-1 antibody at the anti-PD-1 antibody dosage of 5 mg kg−1 and R848 dosage of 0.5 mg kg−1 indicated in (a). Data are presented as means ± s.d. for (c, d). (n = 5 mice per group; one-way ANOVA followed by Tukey’s HSD post-hoc test). Scale bar: 5000 μm for (e). f Kaplan–Meier survival plot of DEN-induced autochthonous HCC mice after treatment indicated in (a). (n = 6 mice per group). gr The numbers of CD80+ TAMs (g), CD86+ TAMs (h), MHC II+ TAMs (i), CD206+ TAMs (j), CD8+ T cells (k), CD8+Ki67+ T cells (l), CD8+CD69+ T cells (m), CD8+IFNγ+ T cells (n), CD8+GzmB+ T cells (o), CD8+PD-1+TCF-1+ T cells (p), CD8+PD-1+TCF-1- T cells (q) and CD8+PD-1+TCF-1-GzmB+ T cells (r) in tumor tissues of DEN-induced autochthonous HCC mice at 30 weeks after treatment indicated in (a). Data are presented as means ± s.d. (n = 5 mice per group; one-way ANOVA followed by Tukey’s HSD post-hoc test). Source data are provided as a Source Data file.
Fig. 8
Fig. 8. Improved anticancer activity and antitumor immunity of anti-PD-1 antibody by 848@M2pep-MPsOVA in B16-OVA tumor-bearing mice.
ae Percentages of CD80+ (a), CD86+ (b), MHC II+ (c), and CD206+ cells (d) and SIINFEKL-H-2Kb+ M1-like macrophages (e) in IL-4-stimulated RAW264.7 cells after treatment with the indicated formulations at R848 concentration of 2 nM for 24 h. Data are presented as means ± sd (n = 4 and 3 biological independent samples for (ad) and (e), respectively; one-way ANOVA followed by Tukey’s HSD post-hoc test). f, g Percentages of SIINFEKL-H-2Kb tetramer+ (f) and IFNγ+ cells (g) in CD8+ T cells at 5 days after co-culture with IL-4-stimulated RAW264.7 cells pretreated indicated in (ae). Data are presented as means ± sd (n = 4 biological independent samples; one-way ANOVA followed by Tukey’s HSD post-hoc test). h Cytotoxicity of CD8+ T cells treated indicated in (f, g) against B16-OVA cells after co-incubation at the effector/target ratio of 20:1 for 6 h. Data are presented as means ± s.d. (n = 4 biological independent samples; one-way ANOVA followed by Tukey’s HSD post-hoc test). i Schematic schedule for anticancer experiment of combination of R848@M2pep-MPsOVA and anti-PD-1 antibody. j, k Tumor growth curves (j) and Kaplan–Meier survival plots (k) of B16-OVA tumor-bearing mice after treatment with R848@M2pep-MPsOVA in the presence or absence of anti-PD-1 antibody at anti-PD-1 antibody and R848 dosage of 5 and 0.5 mg kg−1 indicated in (i), respectively. Data are presented as means ± sem for (j). (n = 6 and 8 mice per group for (j) and (k), respectively; one-way ANOVA followed by Tukey’s HSD post-hoc test). l Relative immune cell numbers in tumors of B16-OVA tumor-bearing mice after treatment indicated in (i). (n = 6 mice per group). mq Representative flow plots of SIINFEKL-H-2Kb tetramer+ in CD3+CD8+T cells (m) and numbers of CD8+tetramer+ (n), CD8+tetramer+PD-1+TCF-1+ (o), CD8+tetramer+PD-1+TCF-1- (p) and CD8+tetramer+PD-1+TCF-1-GzmB+ T (q) cells in tumors of B16-OVA tumor-bearing mice after treatment indicated in (i). Data are presented as means ± s.d. (n = 6 mice per group; one-way ANOVA followed by Tukey’s HSD post-hoc test). Source data are provided as a Source Data file.

Similar articles

Cited by

References

    1. Sung H, et al. Global cancer statistics 2020: globocan estimates of incidence and mortality worldwide for 36 cancers in 185 countries. CA Cancer J. Clin. 2021;71:209–249. doi: 10.3322/caac.21660. - DOI - PubMed
    1. Ribas A, Wolchok JD. Cancer immunotherapy using checkpoint blockade. Science. 2018;359:1350–1355. doi: 10.1126/science.aar4060. - DOI - PMC - PubMed
    1. Zhou F, Qiao M, Zhou C. The cutting-edge progress of immune-checkpoint blockade in lung cancer. Cell Mol. Immunol. 2021;18:279–293. doi: 10.1038/s41423-020-00577-5. - DOI - PMC - PubMed
    1. Han X, Li H, Zhou D, Chen Z, Gu Z. Local and targeted delivery of immune checkpoint blockade therapeutics. Acc Chem. Res. 2020;53:2521–2533. doi: 10.1021/acs.accounts.0c00339. - DOI - PMC - PubMed
    1. El-Khoueiry AB, et al. Nivolumab in patients with advanced hepatocellular carcinoma (CheckMate 040): an open-label, non-comparative, phase 1/2 dose escalation and expansion trial. Lancet. 2017;389:2492–2502. doi: 10.1016/S0140-6736(17)31046-2. - DOI - PMC - PubMed

Publication types